Diesel Power Engine Market

Diesel Power Engine Market by Operation (Standby, Prime, Peak Shaving), Power Rating (Below 0.5 MW, 0.5–1 MW, 1–2 MW, 2–5 MW, and Above 5 MW), End User (Power Utilities, Industrial, Commercial, and Residential), Speed, & Region - Global Forecast to 2029

Report Code: EP 5925 Jun, 2024, by marketsandmarkets.com

[292 Pages Report] The global diesel power engine market is estimated at USD 20.1 billion in 2024, with a projected growth to USD 25.2 billion by 2029, exhibiting a Compound Annual Growth Rate (CAGR) of 4.5%. The diesel power engine market is influenced by several key drivers that shape its growth and trajectory. Firstly, the expansion of industrialization and infrastructure development across emerging economies drives the demand for diesel power engines. These engines are vital for powering heavy machinery and equipment used in construction, mining, agriculture, and manufacturing sectors. As these industries grow and modernize, the need for reliable and efficient power sources like diesel engines increases, thereby propelling market growth. Secondly, the rising demand for backup and prime power solutions, especially in regions with unreliable or inadequate electrical grids, fuels the adoption of diesel power engines. These engines serve as dependable sources of standby power during grid outages or as primary power generators in remote areas where grid connectivity is limited. The need for continuous and uninterrupted power supply drives the deployment of diesel generators across various sectors including commercial buildings, healthcare facilities, data centers, and telecommunications networks.

The expanding transportation sector, particularly in emerging markets, contributes significantly to the demand for diesel power engines. Diesel engines are widely used in heavy-duty trucks, buses, locomotives, and marine vessels due to their high torque output and fuel efficiency. The growth of e-commerce, logistics, and freight transportation amplifies the demand for diesel-powered vehicles, further stimulating market growth. Additionally, stringent emission regulations and the pursuit of cleaner technologies are driving innovation in the diesel power engine market. Engine manufacturers are investing in research and development to develop advanced diesel engines that comply with stringent emission standards such as Euro VI, EPA Tier 4, and Bharat Stage VI. These engines incorporate technologies like selective catalytic reduction (SCR), exhaust gas recirculation (EGR), and diesel particulate filters (DPF) to reduce harmful emissions while maintaining performance and efficiency. The increasing adoption of diesel power engines in the renewable energy sector contributes to market expansion. Diesel generators are often used as backup power sources for renewable energy systems such as solar and wind farms to ensure continuous power supply during periods of low renewable energy generation or grid instability. As the deployment of renewable energy projects continues to rise globally, the demand for complementary diesel power solutions is expected to grow, driving market expansion. Therefore, the diesel power engine market is propelled by a combination of industrial growth, demand for reliable power solutions, expansion of the transportation sector, technological advancements, and integration with renewable energy systems. These drivers collectively contribute to the market's resilience and continued growth trajectory in diverse sectors and geographic regions.

Diesel Power Engine Market

To know about the assumptions considered for the study, Request for Free Sample Report

Diesel Power Engine Market Opportunities

To know about the assumptions considered for the study, download the pdf brochure

Diesel Power Engine Market Dynamics

Driver: Rising demand for reliable and uninterrupted power

The rising demand for reliable and uninterrupted power supply is a significant driver fueling the growth of the diesel power engine market. In today's increasingly digitalized and interconnected world, businesses and industries rely heavily on continuous electricity supply to power their operations. Any disruption or downtime in power supply can result in significant financial losses, operational inefficiencies, and damage to critical equipment. As a result, there is a growing need for backup and prime power solutions to mitigate the impact of power outages and ensure uninterrupted operations. Diesel power engines serve as reliable sources of backup power, especially in regions prone to grid instabilities, natural disasters, or inadequate electrical infrastructure. These engines can quickly ramp up to full capacity and provide immediate power during grid failures, ensuring business continuity and safeguarding critical operations. Industries such as healthcare, telecommunications, data centers, manufacturing, and hospitality rely on diesel generators to maintain essential services and protect against revenue loss during power outages.

Moreover, diesel power engines are favored for their robustness, durability, and ability to operate continuously for extended periods without overheating or performance degradation. They are well-suited for harsh environmental conditions, remote locations, and off-grid applications where access to reliable electricity is limited. This versatility makes diesel generators indispensable for various industries, including construction sites, mining operations, oil and gas facilities, and agricultural operations, where consistent power supply is essential for productivity and safety. In addition to serving as backup power sources, diesel generators are also deployed as prime power solutions in areas with unreliable or nonexistent grid infrastructure. These engines provide a dependable and independent source of electricity for remote communities, rural areas, and off-grid installations such as telecommunications towers, irrigation systems, and remote industrial sites. In regions where access to electricity is limited or intermittent, diesel generators play a crucial role in supporting economic development, improving living standards, and enhancing quality of life. Furthermore, the increasing frequency and severity of extreme weather events, such as storms, hurricanes, and wildfires, have heightened the demand for resilient power solutions. Diesel generators offer a reliable and immediate response to emergencies, allowing businesses, governments, and communities to maintain essential services and minimize disruptions in the aftermath of natural disasters. The ability of diesel power engines to operate independently of external power sources makes them indispensable assets for disaster preparedness and recovery efforts.

Restraints: Competition from alternative power sources

Competition from alternative power sources poses a significant restraint on the global diesel power engine market. The increasing focus on sustainability, environmental regulations, and the push for decarbonization has spurred the adoption of cleaner and more sustainable energy sources such as natural gas, renewables, and energy storage solutions. As a result, diesel power engines face stiff competition from these alternative power sources, which offer lower emissions, reduced operating costs, and greater environmental benefits. Natural gas-fired generators, in particular, have emerged as a popular alternative to diesel generators due to their lower emissions profile and relatively lower fuel costs. Natural gas is considered a cleaner-burning fossil fuel compared to diesel, resulting in lower greenhouse gas emissions and air pollutants such as particulate matter, nitrogen oxides, and sulfur dioxide. Additionally, advancements in natural gas extraction technologies and infrastructure have made it more accessible and cost-effective, further driving its adoption for power generation purposes.

Renewable energy sources such as solar, wind, and hydropower also pose a competitive threat to diesel generators, especially in remote and off-grid applications. The declining costs of renewable energy technologies, coupled with government incentives and mandates to promote clean energy adoption, have accelerated the deployment of renewable energy systems worldwide. Solar photovoltaic (PV) systems, wind turbines, and micro-hydropower installations offer sustainable and emissions-free electricity generation options, reducing dependence on diesel generators in areas with ample renewable energy resources. Furthermore, advancements in energy storage technologies, such as lithium-ion batteries and flow batteries, enable the integration of intermittent renewable energy sources into the grid and provide reliable backup power solutions. Battery energy storage systems (BESS) offer fast response times, grid stabilization capabilities, and the ability to store excess renewable energy for use during periods of low generation or high demand. As battery storage costs continue to decline and energy density improves, they become increasingly competitive with diesel generators for short-duration backup power applications. The competition from alternative power sources also extends to the transportation sector, where electrification initiatives and stricter emissions regulations drive the adoption of electric vehicles (EVs) and hybrid vehicles over diesel-powered counterparts. The shift towards electric mobility reduces the demand for diesel fuel, impacting the overall diesel engine market, particularly in segments such as passenger cars, buses, and commercial vehicles.

Opportunities: Hybrid power systems integration

Hybrid power systems integration presents a significant opportunity for the global diesel power engine market. Hybrid power systems combine multiple energy sources, such as diesel generators, renewable energy sources, and energy storage systems, to optimize energy efficiency, reliability, and cost-effectiveness. By integrating diesel power engines with renewable energy sources like solar photovoltaic (PV) panels, wind turbines, or micro-hydropower systems, hybrid power systems can capitalize on the strengths of each energy source while mitigating their individual limitations. One of the key advantages of hybrid power systems is the ability to reduce fuel consumption and operating costs by leveraging renewable energy sources to offset diesel fuel usage. During periods of ample sunlight, wind, or hydro resources, renewable energy generation can supplement or even replace diesel power generation, reducing reliance on fossil fuels and lowering fuel procurement expenses. This not only improves the economic viability of off-grid and remote power systems but also contributes to environmental sustainability by reducing greenhouse gas emissions and air pollutants associated with diesel combustion.

Furthermore, hybrid power systems offer enhanced reliability and resilience by diversifying the energy sources and incorporating energy storage solutions. Energy storage systems, such as batteries or flywheels, enable the capture and storage of excess renewable energy during times of high generation for later use during periods of low renewable energy availability or high demand. This buffering capability helps stabilize power output, mitigate intermittency issues, and ensure a steady and reliable electricity supply, particularly in off-grid or unreliable grid environments. Moreover, hybrid power systems integration facilitates the adoption of advanced control and optimization algorithms to dynamically manage energy generation, storage, and consumption based on real-time data and demand fluctuations. Smart grid technologies, predictive analytics, and remote monitoring capabilities enable operators to optimize system performance, minimize fuel consumption, and maximize renewable energy utilization while ensuring reliable power delivery to end-users. This intelligent management of hybrid power systems enhances operational efficiency, reduces downtime, and improves overall system resilience and performance. The growing emphasis on energy independence, grid resiliency, and environmental sustainability drives the demand for hybrid power solutions across various sectors, including telecommunications, mining, military, and remote communities. Hybrid power systems offer a versatile and scalable solution for addressing diverse energy needs and requirements, ranging from small-scale microgrids to large-scale industrial applications. As governments, businesses, and communities seek to transition towards cleaner and more sustainable energy solutions, the demand for hybrid power systems integration is expected to grow, presenting new business opportunities for diesel engine manufacturers, renewable energy developers, and energy system integrators..

Challenges: Stricter environmental regulations

Stricter environmental regulations represent a significant restraint for the global diesel power engine market. With increasing concerns about air pollution, greenhouse gas emissions, and climate change, governments worldwide are implementing more stringent environmental standards and emission regulations to curb the environmental impact of diesel-powered equipment and machinery. These regulations typically target pollutants such as nitrogen oxides (NOx), particulate matter (PM), sulfur dioxide (SO2), and carbon dioxide (CO2) emitted by diesel engines, imposing limits on allowable emissions levels and mandating the use of emission control technologies. As a result of these regulations, diesel engine manufacturers face challenges in meeting the stringent emission standards while maintaining engine performance, fuel efficiency, and cost-effectiveness. Compliance with emissions regulations often requires the integration of advanced emission control technologies, such as selective catalytic reduction (SCR), exhaust gas recirculation (EGR), diesel particulate filters (DPF), and oxidation catalysts, into diesel engines to reduce harmful pollutants and meet regulatory requirements. However, the adoption of these emission control technologies can increase the complexity, cost, and maintenance requirements of diesel engines, posing challenges for manufacturers and end-users.

Moreover, stricter environmental regulations may lead to higher production costs, as manufacturers invest in research and development (R&D) efforts to develop cleaner and more efficient diesel engine technologies and comply with regulatory requirements. Additionally, the need for continuous innovation and investment in emission reduction technologies to stay ahead of evolving regulatory standards adds pressure on diesel engine manufacturers to remain competitive in the market while ensuring compliance with environmental regulations. These increased compliance costs and regulatory uncertainties may impact profit margins and pricing strategies, potentially affecting the overall competitiveness of diesel power engines compared to alternative power solutions. Stricter environmental regulations may influence purchasing decisions and market demand for diesel power engines, particularly in environmentally sensitive or regulated sectors such as transportation, construction, and stationary power generation. End-users may prioritize cleaner and more environmentally friendly alternatives to diesel power, such as natural gas, propane, electric, or hybrid power solutions, to minimize environmental impact and comply with regulatory requirements. This shift in demand towards alternative power solutions could result in reduced market share and sales volumes for diesel power engines, especially in regions with stringent emissions standards or carbon pricing mechanisms.

Diesel Power Engine Market Ecosystem

The market for diesel power engine is marked by the participation of leading companies that are firmly established, financially robust, and possess substantial expertise in the production of diesel power engines. These companies hold a significant market presence and provide a wide array of product offerings. They harness advanced technologies and maintain extensive global sales and marketing networks. Among the notable players in this market are Caterpillar (US), Cummins Inc. (US), WEICHAI POWER CO.,LTD (China), MAN (Germany), Rolls-Royce plc (UK), AB Volvo Penta (Sweden), MITSUBISHI HEAVY INDUSTRIES, LTD. (Japan), HD HYUNDAI INFRACORE (South Korea), DAIHATSU DIESEL MFG. CO., LTD. (Japan), YANMAR HOLDINGS CO., LTD. (Japan), KUBOTA Corporation (Japan), Kohler Energy (US), DEUTZ AG (Germany), and others.

Top Companies in Diesel Power Engine Market

Standby segment, by operation, to have the largest market share during forecast period.

The Standby segment holds the largest market share by operation in the global diesel power engine market primarily due to its critical role in providing backup power during emergencies and outages. Standby diesel generators serve as reliable and immediate sources of power in situations where the primary grid power supply fails, ensuring uninterrupted operation of essential facilities such as hospitals, data centers, telecommunications networks, airports, and manufacturing plants. As businesses and organizations increasingly rely on uninterrupted power supply to maintain operations and safeguard critical infrastructure, the demand for standby power solutions has grown significantly, driving the dominance of the Standby segment in the diesel power engine market. One of the key drivers behind the preference for standby diesel generators is their high reliability and fast response time. Standby generators are designed to automatically start and supply power within seconds of detecting a power outage, providing seamless transition and continuous operation until grid power is restored. This rapid response capability is crucial for mission-critical applications where even momentary power interruptions can have severe consequences, such as data loss, equipment damage, productivity losses, or compromised safety and security.

Standby diesel generators offer scalability and flexibility to meet varying power requirements and application needs. These generators are available in a wide range of power ratings, from a few kilowatts to several megawatts, allowing users to select the appropriate capacity based on their specific load demands and backup power duration requirements. Moreover, standby generators can be integrated with advanced control and monitoring systems to enable remote operation, real-time diagnostics, and predictive maintenance, enhancing reliability, efficiency, and performance. The robust and durable nature of diesel engines makes them well-suited for standby power applications, particularly in harsh environments or remote locations where grid reliability may be compromised. Diesel generators can operate continuously for extended periods without degradation in performance, offering long-term reliability and low lifecycle costs compared to alternative power sources. Additionally, diesel fuel availability and infrastructure are widely established globally, ensuring consistent fuel supply and accessibility during emergencies or natural disasters when other energy sources may be unavailable.

Above 1000 RPM segment, by speed, to emerge as largest segment of diesel power engine market.

The Above 1000 RPM segment by speed holds the largest market share in the global diesel power engine market primarily due to its widespread adoption in various high-speed applications and industries where efficiency, power density, and compact size are paramount. Diesel engines operating at speeds above 1000 RPM offer several advantages that make them preferred choices for a wide range of applications, including automotive, marine, construction, agriculture, and industrial equipment. One of the key factors driving the dominance of the Above 1000 RPM segment is the superior power-to-weight ratio and energy efficiency offered by high-speed diesel engines. These engines are capable of delivering higher power outputs relative to their size and weight compared to low-speed counterparts, making them ideal for applications where space and weight constraints are critical considerations, such as automotive vehicles, compact machinery, and portable power units. The compact size and lightweight design of high-speed diesel engines enable their integration into smaller equipment and systems without compromising performance or efficiency.

Diesel engines operating at speeds above 1000 RPM exhibit excellent dynamic response and throttle control, allowing for rapid acceleration, deceleration, and precise power modulation in dynamic operating conditions. This responsiveness is particularly advantageous in applications requiring frequent load changes, variable speed operation, or precise power delivery, such as vehicles, generators, pumps, compressors, and propulsion systems. The ability of high-speed diesel engines to quickly adjust to varying loads and operating conditions enhances overall system performance, productivity, and operational flexibility. Furthermore, the Above 1000 RPM segment offers a wide range of power ratings and configurations to accommodate diverse application requirements and performance specifications. High-speed diesel engines are available in various cylinder configurations, turbocharged or supercharged designs, and fuel injection systems, allowing manufacturers to tailor engine designs to specific application needs, operating environments, and regulatory standards. This versatility and customization capability make high-speed diesel engines suitable for a broad spectrum of industries and end-users seeking reliable, high-performance power solutions. Advancements in engine design, materials, combustion technology, and emissions control have further enhanced the efficiency, reliability, and environmental performance of high-speed diesel engines, driving their adoption across industries and regions. Modern high-speed diesel engines incorporate advanced features such as electronic controls, common rail fuel injection, variable geometry turbocharging, and exhaust aftertreatment systems to optimize fuel efficiency, reduce emissions, and comply with stringent regulatory requirements for air quality and greenhouse gas emissions.

Power Utilites segment, by End User, to hold the largest market share in diesel power engine market.

The Power Utilities segment likely holds the largest market share by end user in the global diesel power engine market due to several crucial factors. Utilities require large, high-output diesel engines for continuous electricity generation. These engines power entire grids or major substations, ensuring a steady supply of electricity to homes and businesses. The sheer volume and power output of these engines for large-scale generation contribute significantly to the market share. Power utilities utilize diesel engines for both baseload and peak power generation. Baseload refers to the constant minimum level of electricity required to meet consumer demand. Diesel engines can be efficient for baseload power in remote areas or as a supplement to renewable energy sources during low generation periods. Additionally, utilities rely on diesel engines during peak demand periods to meet surges in electricity consumption and prevent blackouts. Power grids are not always expansive, and some regions lack grid infrastructure entirely. In these scenarios, power utilities deploy diesel engines for off-grid power generation, supplying electricity to remote communities and industrial facilities. While renewable energy sources like solar and wind power are gaining traction, they are intermittent. Diesel engines can provide crucial backup power and grid stabilization during periods of low renewable energy generation, ensuring a reliable and balanced electricity supply. While other segments like industrial and commercial utilize diesel engines, the sheer volume and power output of engines required by power utilities for continuous baseload, peak power generation, off-grid applications, and grid resilience solidify their position as the largest market share holder in the global diesel power engine market.

The Asia Pacific diesel power engine market is poised to achieve the highest CAGR throughout the forecast period.

Asia Pacific holds the largest market share in the global diesel power engine market primarily due to several key factors driving demand for diesel engines across various industries and applications in the region. One of the main drivers is the rapid industrialization and urbanization witnessed across Asia Pacific countries, leading to robust growth in construction, manufacturing, infrastructure development, and transportation sectors. Diesel engines play a crucial role in powering heavy-duty machinery, construction equipment, commercial vehicles, and generators required for these activities, driving significant demand for diesel power solutions. The expanding population, rising energy consumption, and increasing demand for reliable electricity supply in remote or off-grid areas have fueled the deployment of diesel generators for backup power generation, grid stabilization, and decentralized energy solutions in Asia Pacific countries. Diesel generators are widely used in residential, commercial, industrial, and institutional settings to ensure uninterrupted power supply during grid outages, peak demand periods, or in areas with limited access to centralized electricity grids, thereby driving substantial demand for diesel power engines in the region.

The agriculture sector in Asia Pacific heavily relies on diesel-powered machinery and equipment for various agricultural activities such as plowing, planting, harvesting, irrigation, and transportation. Diesel engines are preferred for their robustness, fuel efficiency, torque, and reliability, making them indispensable for mechanized farming operations across the region. The agricultural machinery market in Asia Pacific is experiencing steady growth due to increasing mechanization, adoption of modern farming techniques, and government initiatives to enhance agricultural productivity and rural livelihoods, further boosting demand for diesel power engines. Asia Pacific countries are investing in infrastructure development, renewable energy integration, and electrification initiatives to support economic growth, enhance energy security, and mitigate environmental challenges. While there is a growing emphasis on transitioning to cleaner energy sources and reducing greenhouse gas emissions, diesel power engines continue to play a vital role in supporting critical infrastructure, backup power systems, and remote applications where grid connectivity or renewable energy alternatives are limited or unreliable.

The presence of leading diesel engine manufacturers, extensive distribution networks, and technological advancements in engine design, performance, and emissions control systems have contributed to the widespread adoption of diesel power solutions in Asia Pacific. Manufacturers are continuously innovating to develop more efficient, reliable, and environmentally friendly diesel engines that comply with stringent emission standards and regulatory requirements while meeting the diverse needs of customers across different industries and applications in the region. Hence, the combination of industrial growth, urban development, infrastructure expansion, agricultural mechanization, energy demand, and technological advancements has propelled Asia Pacific to become the largest market for diesel power engines globally. With continued investments in infrastructure, energy, and manufacturing sectors, coupled with rising demand for reliable power solutions, Asia Pacific is expected to maintain its dominant position in the global diesel power engine market in the foreseeable future.

North American Diesel Power Engine Market Size, and Share

Key Market Players

Caterpillar (US), Cummins Inc. (US), WEICHAI POWER CO.,LTD (China), MAN (Germany), Rolls-Royce plc (UK), AB Volvo Penta (Sweden), MITSUBISHI HEAVY INDUSTRIES, LTD. (Japan), HD HYUNDAI INFRACORE (South Korea), DAIHATSU DIESEL MFG. CO., LTD. (Japan), YANMAR HOLDINGS CO., LTD. (Japan), KUBOTA Corporation (Japan)

Get online access to the report on the World's First Market Intelligence Cloud

  • Easy to Download Historical Data & Forecast Numbers
  • Company Analysis Dashboard for high growth potential opportunities
  • Research Analyst Access for customization & queries
  • Competitor Analysis with Interactive dashboard
  • Latest News, Updates & Trend analysis
Request Sample

Scope of the Report

Report Metric

Details

Market Size available for years

2020–2029

Base year considered

2023

Forecast period

2024–2029

Forecast units

Value (USD Million)

Segments covered

By Operation, By Power Rating, By Speed, By End User

Geographies covered

Asia Pacific, North America, Europe, Middle East and Africa, and South America 

Companies covered

Caterpillar (US), Cummins Inc. (US), WEICHAI POWER CO.,LTD (China), MAN (Germany), Rolls-Royce plc (UK), AB Volvo Penta (Sweden), MITSUBISHI HEAVY INDUSTRIES, LTD. (Japan), HD HYUNDAI INFRACORE (South Korea), DAIHATSU DIESEL MFG. CO., LTD. (Japan), YANMAR HOLDINGS CO., LTD. (Japan), KUBOTA Corporation (Japan), Kohler Energy (US), DEUTZ AG (Germany), Mahindra&Mahindra Ltd. (India), IHI Power Systems Co.,Ltd (Japan), Guangzhou diesel engine factory Limited (China).

The diesel power engine market is classified in this research report based on operation,, power rating, speed, end user, and region.

Based on operation:
  • Standby
  • Prime
  • Peak shaving
Based on power rating:
  • Below 0.5 MW
  • 0.5-1 MW
  • 1-2 MW
  • 2-5 MW
  • Abovw 2-5 MW
Based on speed:
  • Below 720 RPM
  • 720-1000 RPM
  • Above 1000 RPM
Based on End User:
  • Power Utilities
  • Industrial
  • Commercial
  • Residential
Based on regions:
  • North America
  • Asia Pacific
  • South America
  • Europe
  • Middle East and Africa  

Recent Developments

  • In April 2024, Rolls-Royce, ASCO Carbon Dioxide Ltd (ASCO), and Landmark Power Holdings Limited (LMPH), have signed an agreement aimed at developing scalable solutions for clean power generation with carbon capture from mtu engines.
  • In March 2024, Caterpillar has come into a partnership with Africa Data Centres Association (ADCA), where Caterpillar’s power solutions will offer efficient diesel and gas generator sets with high power densities with specifically customized for continuous, standby, and temporary power applications at data centres.
  • In April 2023, Cummins announced that in addition to recent investments in Fridley, the company is investing more than (USD 1 billion) across its U.S. engine manufacturing network in Indiana, North Carolina, and New York.

Frequently Asked Questions (FAQ):

To speak to our analyst for a discussion on the above findings, click Speak to Analyst

TABLE OF CONTENTS
 
1 INTRODUCTION (Page No. - 39)
    1.1 STUDY OBJECTIVES 
    1.2 MARKET DEFINITION 
    1.3 STUDY SCOPE 
           1.3.1 INCLUSIONS AND EXCLUSIONS
                    TABLE 1 DIESEL POWER ENGINE MARKET: INCLUSIONS AND EXCLUSIONS, BY OPERATION
                    TABLE 2 MARKET: INCLUSIONS AND EXCLUSIONS, BY POWER RATING
                    TABLE 3 MARKET: INCLUSIONS AND EXCLUSIONS, BY SPEED
                    TABLE 4 MARKET: INCLUSIONS AND EXCLUSIONS, BY END USER
                    TABLE 5 MARKET: INCLUSIONS AND EXCLUSIONS, BY REGION
           1.3.2 MARKETS COVERED
                    FIGURE 1 DIESEL POWER ENGINE MARKET SEGMENTATION
           1.3.3 REGIONAL SCOPE
           1.3.4 YEARS CONSIDERED
           1.3.5 CURRENCY CONSIDERED
           1.3.6 UNITS CONSIDERED
    1.4 LIMITATIONS 
    1.5 STAKEHOLDERS 
    1.6 SUMMARY OF CHANGES 
    1.7 IMPACT OF RECESSION 
 
2 RESEARCH METHODOLOGY (Page No. - 45)
    2.1 RESEARCH DATA 
           FIGURE 2 RESEARCH DESIGN
           2.1.1 SECONDARY DATA
                    2.1.1.1 List of key secondary sources
                    2.1.1.2 Key data from secondary sources
           2.1.2 PRIMARY DATA
                    2.1.2.1 List of primary interview participants
                    2.1.2.2 Key industry insights
                    2.1.2.3 Key data from primary sources
                    2.1.2.4 Breakdown of primaries
                               FIGURE 3 MAIN METRICS CONSIDERED TO ANALYZE AND ASSESS DEMAND FOR DIESEL POWER ENGINES
    2.2 MARKET SIZE ESTIMATION METHODOLOGY 
           2.2.1 BOTTOM-UP APPROACH
                    FIGURE 4 MARKET: BOTTOM-UP APPROACH
                    2.2.1.1 Demand-side analysis
                               2.2.1.1.1 Regional analysis
                               2.2.1.1.2 Country-level analysis
                               2.2.1.1.3 Demand-side assumptions
                               2.2.1.1.4 Demand-side calculations
           2.2.2 TOP-DOWN APPROACH
                    FIGURE 5 DIESEL POWER ENGINE MARKET: TOP-DOWN APPROACH
                    2.2.2.1 Supply-side analysis
                               FIGURE 6 KEY STEPS CONSIDERED TO ASSESS SUPPLY OF DIESEL POWER ENGINES
                               FIGURE 7 MARKET: SUPPLY-SIDE ANALYSIS
                               2.2.2.1.1 Supply-side calculations
                               2.2.2.1.2 Supply-side assumptions
    2.3 FORECAST 
    2.4 MARKET BREAKDOWN AND DATA TRIANGULATION 
           FIGURE 8 DATA TRIANGULATION
    2.5 RESEARCH ASSUMPTIONS 
    2.6 RISK ASSESSMENT 
           TABLE 6 MARKET: RISK ASSESSMENT
    2.7 RECESSION IMPACT 
    2.8 RESEARCH LIMITATIONS 
 
3 EXECUTIVE SUMMARY (Page No. - 59)
    TABLE 7 DIESEL POWER ENGINE MARKET SNAPSHOT 
    FIGURE 9 ASIA PACIFIC DOMINATED DIESEL POWER MARKET IN 2023 
    FIGURE 10 STANDBY SEGMENT TO ACCOUNT FOR LARGEST SHARE OF MARKET IN 2024 
    FIGURE 11 BELOW 0.5 MW SEGMENT TO LEAD MARKET BETWEEN 2024 AND 2029 
    FIGURE 12 ABOVE 1,000 RPM SEGMENT TO DOMINATE MARKET BETWEEN 2024 AND 2029 
    FIGURE 13 POWER UTILITIES SEGMENT TO ACCOUNT FOR LARGEST SHARE OF MARKET IN 2024 
 
4 PREMIUM INSIGHTS (Page No. - 64)
    4.1 ATTRACTIVE OPPORTUNITIES FOR PLAYERS IN DIESEL POWER ENGINE MARKET 
           FIGURE 14 RAPID INDUSTRIALIZATION, EXTENSIVE INFRASTRUCTURE DEVELOPMENT, AND GROWING EMPHASIS ON ADOPTING CLEANER TECHNOLOGIES TO CREATE GROWTH OPPORTUNITIES FOR MARKET PLAYERS
    4.2 MARKET, BY REGION 
           FIGURE 15 ASIA PACIFIC TO EXHIBIT HIGHEST CAGR IN MARKET DURING FORECAST PERIOD
    4.3 MARKET IN ASIA PACIFIC, BY OPERATION AND COUNTRY 
           FIGURE 16 STANDBY SEGMENT AND CHINA HELD LARGEST SHARES OF ASIA PACIFIC MARKET IN 2023
    4.4 MARKET, BY OPERATION 
           FIGURE 17 STANDBY SEGMENT TO ACCOUNT FOR LARGEST MARKET SHARE IN 2029
    4.5 MARKET, BY POWER RATING 
           FIGURE 18 BELOW 0.5 MW SEGMENT TO DOMINATE MARKET IN 2029
    4.6 MARKET, BY SPEED 
           FIGURE 19 ABOVE 1,000 RPM SEGMENT TO HOLD LARGEST MARKET SHARE IN 2029
    4.7 MARKET, BY END USER 
           FIGURE 20 POWER UTILITIES SEGMENT TO DOMINATE MARKET IN 2029
 
5 MARKET OVERVIEW (Page No. - 68)
    5.1 INTRODUCTION 
    5.2 MARKET DYNAMICS 
           FIGURE 21 DIESEL POWER ENGINE MARKET: DRIVERS, RESTRAINTS, OPPORTUNITIES, AND CHALLENGES
           5.2.1 DRIVERS
                    5.2.1.1 Rising demand for reliable and uninterrupted power in various industries and sectors
                               FIGURE 22 GLOBAL INVESTMENTS IN POWER SECTOR, 2019–2023 (USD BILLION)
                               FIGURE 23 ELECTRICITY DEMAND, BY SECTOR/INDUSTRY, 2022–2050 (THOUSAND TWH)
                    5.2.1.2 Industrial growth and infrastructure development
                               FIGURE 24 GLOBAL INFRASTRUCTURE INVESTMENTS, 2019–2029 (USD BILLION)
                    5.2.1.3 Increasing trend of decentralized power generation
           5.2.2 RESTRAINTS
                    5.2.2.1 Preference for alternative power sources
                               FIGURE 25 GLOBAL CLEAN ENERGY INVESTMENTS, 2019–2023 (USD BILLION)
                               FIGURE 26 CLEAN ENERGY SPENDING IN SELECTED REGIONS, 2023
                    5.2.2.2 High initial investment and maintenance costs
                               FIGURE 27 GLOBAL OIL DEMAND, BY PRODUCT, 2019–2028
           5.2.3 OPPORTUNITIES
                    5.2.3.1 Integration of diesel generators into hybrid power systems
                               FIGURE 28 RENEWABLE ELECTRICITY CAPACITY ADDITIONS, BY TECHNOLOGY AND SEGMENTS, 2019–2028 (GW)
                    5.2.3.2 Rising focus on enhancing energy efficiency of diesel power engines
                               FIGURE 29 END USE INVESTMENTS, 2019–2023 (USD BILLION)
                    5.2.3.3 Expansion of presence to emerging markets
           5.2.4 CHALLENGES
                    5.2.4.1 Fluctuations in fuel prices and global supply chain disruptions
                               FIGURE 30 DIESEL PRICE TREND, 2019–2023 (USD/LITER)
                               FIGURE 31 AVERAGE CRUDE OIL PRICE TREND, 2015–2024 (USD)
                    5.2.4.2 Rising emission regulations and environmental concerns
                               FIGURE 32 GLOBAL CO2 EMISSIONS FROM ELECTRICITY GENERATION, 2016–2026 (METRIC TON)
    5.3 TRENDS/DISRUPTIONS IMPACTING CUSTOMERS’ BUSINESSES 
           FIGURE 33 TRENDS/DISRUPTIONS IMPACTING CUSTOMERS’ BUSINESSES
    5.4 ECOSYSTEM ANALYSIS 
           FIGURE 34 KEY PARTICIPANTS IN DIESEL POWER ENGINE ECOSYSTEM
           TABLE 8 ROLES OF COMPANIES IN DIESEL POWER ENGINE ECOSYSTEM
    5.5 INVESTMENT AND FUNDING SCENARIO 
           FIGURE 35 MARKET: FUNDING RAISED BY TOP THREE PLAYERS, 2020–2022 (USD MILLION)
    5.6 SUPPLY CHAIN ANALYSIS 
           FIGURE 36 MARKET: SUPPLY CHAIN ANALYSIS
    5.7 TECHNOLOGY ANALYSIS 
           5.7.1 KEY TECHNOLOGY
                    5.7.1.1 Biodiesel compatibility
                               TABLE 9 BIODIESEL PRODUCTION IN SELECTED COUNTRIES, 2021–2028  (THOUSAND BARRELS/DAY)
                               FIGURE 37 CUMULATIVE INVESTMENTS IN BIODIESEL PRODUCTION IN SELECTED COUNTRIES/REGIONS, 2010–2022 (USD BILLION)
           5.7.2 COMPLEMENTARY TECHNOLOGY
                    5.7.2.1 Selective catalytic reduction (SCR)
                               TABLE 10 COMPARISON OF POWER CONSUMPTION BY LOW- AND HIGH-DUST SCR
    5.8 PRICING ANALYSIS 
           5.8.1 AVERAGE SELLING PRICE (ASP) TREND, BY POWER RATING
                    TABLE 11 AVERAGE SELLING PRICE (ASP) TREND OF DIESEL POWER ENGINES, BY POWER RATING, 2023 (USD/UNIT)
           5.8.2 INDICATIVE PRICING TREND, BY REGION
                    FIGURE 38 INDICATIVE PRICING TREND OF DIESEL POWER ENGINES, BY REGION,  2020–2024 (USD THOUSAND/UNIT)
    5.9 KEY CONFERENCES AND EVENTS, 2024–2025 
           TABLE 12 DIESEL POWER ENGINE MARKET: LIST OF KEY CONFERENCES AND EVENTS, 2024–2025
    5.10 TARIFFS, STANDARDS, AND REGULATORY LANDSCAPE 
           5.10.1 TARIFFS
                    TABLE 13 IMPORT TARIFF RELATED TO HS 8408-COMPLIANT PRODUCTS IN 2022
           5.10.2 REGULATORY BODIES, GOVERNMENT AGENCIES, AND OTHER ORGANIZATIONS
                    TABLE 14 NORTH AMERICA: LIST OF REGULATORY BODIES, GOVERNMENT AGENCIES, AND OTHER ORGANIZATIONS
                    TABLE 15 EUROPE: LIST OF REGULATORY BODIES, GOVERNMENT AGENCIES, AND OTHER ORGANIZATIONS
                    TABLE 16 ASIA PACIFIC: LIST OF REGULATORY BODIES, GOVERNMENT AGENCIES, AND OTHER ORGANIZATIONS
                    TABLE 17 ROW: LIST OF REGULATORY BODIES, GOVERNMENT AGENCIES, AND OTHER ORGANIZATIONS
           5.10.3 STANDARDS
                    TABLE 18 MARKET: STANDARDS
    5.11 TRADE ANALYSIS 
           5.11.1 IMPORT SCENARIO (HS CODE 8408)
                    TABLE 19 IMPORT DATA FOR HS CODE 8408-COMPLIANT PRODUCTS, BY COUNTRY,  2021–2023 (USD THOUSAND)
                    FIGURE 39 IMPORT DATA FOR HS CODE 8408-COMPLIANT PRODUCTS FOR TOP FIVE COUNTRIES, 2019–2023 (USD THOUSAND)
           5.11.2 EXPORT SCENARIO (HS CODE 8408)
                    TABLE 20 EXPORT DATA FOR HS CODE 8408-COMPLIANT PRODUCTS, BY COUNTRY,  2021–2023 (USD THOUSAND)
                    FIGURE 40 EXPORT DATA FOR HS CODE 8408-COMPLIANT PRODUCTS FOR TOP FIVE COUNTRIES, 2019–2023 (USD THOUSAND)
    5.12 PATENT ANALYSIS 
                    FIGURE 41 INNOVATIONS AND PATENT REGISTRATIONS RELATED TO DIESEL POWER ENGINES, 2013–2023
                    TABLE 21 MARKET: INNOVATIONS AND PATENT REGISTRATIONS,  2019–2023
    5.13 PORTER’S FIVE FORCES ANALYSIS 
                    FIGURE 42 PORTER’S FIVE FORCES ANALYSIS
                    TABLE 22 MARKET: PORTER’S FIVE FORCES ANALYSIS
           5.13.1 THREAT OF SUBSTITUTES
           5.13.2 BARGAINING POWER OF SUPPLIERS
           5.13.3 BARGAINING POWER OF BUYERS
           5.13.4 THREAT OF NEW ENTRANTS
           5.13.5 INTENSITY OF COMPETITIVE RIVALRY
    5.14 KEY STAKEHOLDERS AND BUYING CRITERIA 
           5.14.1 KEY STAKEHOLDERS IN BUYING PROCESS
                    FIGURE 43 INFLUENCE OF KEY STAKEHOLDERS ON BUYING PROCESS, BY END USER
                    TABLE 23 INFLUENCE OF KEY STAKEHOLDERS ON BUYING PROCESS, BY END USER
           5.14.2 BUYING CRITERIA
                    FIGURE 44 KEY BUYING CRITERIA, BY END USER
                    TABLE 24 KEY BUYING CRITERIA, BY END USER
    5.15 CASE STUDY ANALYSIS 
           5.15.1 CALBANK INSTALLED TWO CUMMINS C900D5 230/400V 50 HZ DIESEL-POWERED GENERATORS OFFERED BY CUMMINS GHANA TO ENSURE RELIABLE STANDBY POWER FOR HEAD OFFICE
           5.15.2 CUMMINS SUPPLIED EMERGENCY STANDBY POWER SYSTEM TO NAVAJO TRIBAL UTILITY AUTHORITY (NTUA) AND NNGE TO ENSURE RELIABLE EMERGENCY STANDBY POWER FOR TWIN ARROWS NAVAJO CASINO RESORT
           5.15.3 LG CNS CONTRACTED CUMMINS TO PROVIDE POWER SYSTEM AND ENSURE RELIABLE STANDBY POWER FOR GLOBAL DATA CENTER
           5.15.4 NESTE DEVELOPED RENEWABLE DIESEL CALLED HVO100 TO REDUCE GREENHOUSE GAS EMISSIONS BY UP TO 90% COMPARED TO FOSSIL DIESEL
 
6 DIESEL POWER ENGINE MARKET, BY POWER RATING (Page No. - 109)
    6.1 INTRODUCTION 
           FIGURE 45 DIESEL POWER ENGINE MARKET, BY POWER RATING, 2023
           TABLE 25 MARKET, BY POWER RATING, 2020–2023 (USD MILLION)
           TABLE 26 MARKET, BY POWER RATING, 2024–2029 (USD MILLION)
    6.2 BELOW 0.5 MW 
           6.2.1 COST-EFFECTIVENESS AND EASE OF INSTALLATION AND MAINTENANCE TO DRIVE DEMAND
                    TABLE 27 BELOW 0.5 MW: MARKET, BY REGION,  2020–2023 (USD MILLION)
                    TABLE 28 BELOW 0.5 MW: MARKET, BY REGION,  2024–2029 (USD MILLION)
    6.3 0.5–1 MW 
           6.3.1 SCALABILITY AND ADAPTABILITY FEATURES TO FUEL DEMAND
                    TABLE 29 0.5–1 MW: MARKET, BY REGION, 2020–2023 (USD MILLION)
                    TABLE 30 0.5–1 MW: MARKET, BY REGION, 2024–2029 (USD MILLION)
    6.4 1.0–2 MW 
           6.4.1 RAPID INDUSTRIALIZATION AND TECHNOLOGICAL ADVANCEMENTS TO DRIVE DEMAND
                    TABLE 31 1–2 MW: MARKET, BY REGION, 2020–2023 (USD MILLION)
                    TABLE 32 1–2 MW: MARKET, BY REGION, 2024–2029 (USD MILLION)
    6.5 2–5 MW 
           6.5.1 LARGE-SCALE INDUSTRIAL APPLICATIONS AND ADVANCED FEATURES TO FUEL MARKET GROWTH
                    TABLE 33 2–5 MW: MARKET, BY REGION, 2020–2023 (USD MILLION)
                    TABLE 34 2–5 MW: MARKET, BY REGION, 2024–2029 (USD MILLION)
    6.6 ABOVE 5 MW 
           6.6.1 INCREASE IN NUMBER OF LARGE-SCALE POWER GENERATION PROJECTS TO DRIVE DEMAND
                    TABLE 35 ABOVE 5 MW: MARKET, BY REGION, 2020–2023 (USD MILLION)
                    TABLE 36 ABOVE 5 MW: MARKET, BY REGION, 2024–2029 (USD MILLION)
 
7 DIESEL POWER ENGINE MARKET, BY SPEED (Page No. - 117)
    7.1 INTRODUCTION 
           FIGURE 46 MARKET, BY SPEED, 2023
           TABLE 37 MARKET, BY SPEED, 2020–2023 (USD MILLION)
           TABLE 38 MARKET, BY SPEED, 2024–2029 (USD MILLION)
    7.2 BELOW 720 RPM 
           7.2.1 RAPID INDUSTRIALIZATION TO FUEL MARKET GROWTH
                    TABLE 39 BELOW 720 RPM: MARKET, BY REGION,  2020–2023 (USD MILLION)
                    TABLE 40 BELOW 720 RPM: MARKET, BY REGION,  2024–2029 (USD MILLION)
    7.3 720–1,000 RPM 
           7.3.1 COMPACT DESIGN AND SPACE EFFICIENCY TO DRIVE DEMAND
                    TABLE 41 720–1,000 RPM: MARKET, BY REGION,  2020–2023 (USD MILLION)
                    TABLE 42 720–1,000 RPM: MARKET, BY REGION,  2024–2029 (USD MILLION)
    7.4 ABOVE 1,000 RPM 
           7.4.1 HIGHER COST-EFFECTIVENESS IN MANUFACTURING COMPARED WITH SLOW ENGINES TO PROPEL MARKET
                    TABLE 43 ABOVE 1,000 RPM: MARKET, BY REGION,  2020–2023 (USD MILLION)
                    TABLE 44 ABOVE 1,000 RPM: MARKET, BY REGION,  2024–2029 (USD MILLION)
 
8 DIESEL POWER ENGINE MARKET, BY OPERATION (Page No. - 122)
    8.1 INTRODUCTION 
           FIGURE 47 MARKET, BY OPERATION, 2023
           TABLE 45 MARKET, BY OPERATION, 2020–2023 (USD MILLION)
           TABLE 46 MARKET, BY OPERATION, 2024–2029 (USD MILLION)
    8.2 STANDBY 
           8.2.1 RELIABILITY AND AFFORDABILITY FEATURES OF STANDBY DIESEL POWER ENGINES TO PROPEL DEMAND
                    TABLE 47 STANDBY: MARKET, BY REGION, 2020–2023 (USD MILLION)
                    TABLE 48 STANDBY: MARKET, BY REGION, 2024–2029 (USD MILLION)
    8.3 PRIME 
           8.3.1 DEVELOPMENT OF EFFICIENT AND CLEANER DIESEL ENGINES TO FUEL MARKET GROWTH
                    TABLE 49 PRIME: MARKET, BY REGION, 2020–2023 (USD MILLION)
                    TABLE 50 PRIME: MARKET, BY REGION, 2024–2029 (USD MILLION)
    8.4 PEAK SHAVING 
           8.4.1 GROWING DEMAND FOR ELECTRICITY TO DRIVE MARKET
                    TABLE 51 PEAK SHAVING: MARKET, BY REGION,  2020–2023 (USD MILLION)
                    TABLE 52 PEAK SHAVING: MARKET, BY REGION,  2024–2029 (USD MILLION)
 
9 DIESEL POWER ENGINE MARKET, BY END USER (Page No. - 127)
    9.1 INTRODUCTION 
           FIGURE 48 MARKET, BY END USER, 2023
           TABLE 53 MARKET, BY END USER, 2020–2023 (USD MILLION)
           TABLE 54 MARKET, BY END USER, 2024–2029 (USD MILLION)
    9.2 POWER UTILITIES 
           9.2.1 GRID INFRASTRUCTURE DEVELOPMENTS TO DRIVE MARKET
                    TABLE 55 POWER UTILITIES: MARKET, BY REGION,  2020–2023 (USD MILLION)
                    TABLE 56 POWER UTILITIES: MARKET, BY REGION,  2024–2029 (USD MILLION)
    9.3 INDUSTRIAL 
           9.3.1 INCREASING GLOBAL POWER CONSUMPTION TO DRIVE MARKET
                    TABLE 57 INDUSTRIAL: MARKET, BY REGION, 2020–2023 (USD MILLION)
                    TABLE 58 INDUSTRIAL: MARKET, BY REGION, 2024–2029 (USD MILLION)
    9.4 COMMERCIAL 
           9.4.1 NEED FOR PRIME POWER IN REMOTE LOCATIONS TO FUEL MARKET GROWTH
                    TABLE 59 COMMERCIAL: MARKET, BY REGION, 2020–2023 (USD MILLION)
                    TABLE 60 COMMERCIAL: MARKET, BY REGION, 2024–2029 (USD MILLION)
    9.5 RESIDENTIAL 
           9.5.1 RAPID URBANIZATION AND INCREASING CONSTRUCTION ACTIVITIES TO FUEL MARKET GROWTH
                    TABLE 61 RESIDENTIAL: MARKET, BY REGION, 2020–2023 (USD MILLION)
                    TABLE 62 RESIDENTIAL: MARKET, BY REGION, 2024–2029 (USD MILLION)
 
10 DIESEL POWER ENGINE MARKET, BY REGION (Page No. - 134)
     10.1 INTRODUCTION 
               FIGURE 49 MARKET, BY REGION, 2023
               FIGURE 50 MARKET IN ASIA PACIFIC TO REGISTER HIGHEST CAGR FROM 2024 TO 2029
               TABLE 63 MARKET, BY REGION, 2020–2023 (USD MILLION)
               TABLE 64 MARKET, BY REGION, 2024–2029 (USD MILLION)
               TABLE 65 MARKET, BY REGION, 2020–2023 (UNIT)
               TABLE 66 MARKET, BY REGION, 2024–2029 (UNIT)
     10.2 ASIA PACIFIC 
             10.2.1 IMPACT OF RECESSION ON MARKET  IN ASIA PACIFIC
                       FIGURE 51 ASIA PACIFIC: MARKET SNAPSHOT
                       TABLE 67 ASIA PACIFIC: MARKET, BY OPERATION,  2020–2023 (USD MILLION)
                       TABLE 68 ASIA PACIFIC: MARKET, BY OPERATION,  2024–2029 (USD MILLION)
                       TABLE 69 ASIA PACIFIC: MARKET, BY POWER RATING,  2020–2023 (USD MILLION)
                       TABLE 70 ASIA PACIFIC: MARKET, BY POWER RATING,  2024–2029 (USD MILLION)
                       TABLE 71 ASIA PACIFIC: MARKET, BY SPEED,  2020–2023 (USD MILLION)
                       TABLE 72 ASIA PACIFIC: MARKET, BY SPEED,  2024–2029 (USD MILLION)
                       TABLE 73 ASIA PACIFIC: MARKET, BY END USER,  2020–2023 (USD MILLION)
                       TABLE 74 ASIA PACIFIC: MARKET, BY END USER,  2024–2029 (USD MILLION)
                       TABLE 75 ASIA PACIFIC: MARKET, BY COUNTRY,  2020–2023 (USD MILLION)
                       TABLE 76 ASIA PACIFIC: MARKET, BY COUNTRY,  2024–2029 (USD MILLION)
             10.2.2 CHINA
                       10.2.2.1 Rapid industrialization to fuel demand
                                   TABLE 77 CHINA: MARKET, BY OPERATION, 2020–2023 (USD MILLION)
                                   TABLE 78 CHINA: MARKET, BY OPERATION, 2024–2029 (USD MILLION)
                                   TABLE 79 CHINA: MARKET, BY END USER, 2020–2023 (USD MILLION)
                                   TABLE 80 CHINA: MARKET, BY END USER, 2024–2029 (USD MILLION)
             10.2.3 INDIA
                       10.2.3.1 Rising infrastructure development to drive demand
                                   TABLE 81 INDIA: MARKET, BY OPERATION, 2020–2023 (USD MILLION)
                                   TABLE 82 INDIA: MARKET, BY OPERATION, 2024–2029 (USD MILLION)
                                   TABLE 83 INDIA: MARKET, BY END USER, 2020–2023 (USD MILLION)
                                   TABLE 84 INDIA: MARKET, BY END USER, 2024–2029 (USD MILLION)
             10.2.4 AUSTRALIA
                       10.2.4.1 Developments in mining and agriculture industries to propel demand
                                   TABLE 85 AUSTRALIA: MARKET, BY OPERATION,  2020–2023 (USD MILLION)
                                   TABLE 86 AUSTRALIA: MARKET, BY OPERATION,  2024–2029 (USD MILLION)
                                   TABLE 87 AUSTRALIA: MARKET, BY END USER, 2020–2023 (USD MILLION)
                                   TABLE 88 AUSTRALIA: MARKET, BY END USER, 2024–2029 (USD MILLION)
             10.2.5 REST OF ASIA PACIFIC
                       TABLE 89 REST OF ASIA PACIFIC: MARKET, BY OPERATION,  2020–2023 (USD MILLION)
                       TABLE 90 REST OF ASIA PACIFIC: MARKET, BY OPERATION,  2024–2029 (USD MILLION)
                       TABLE 91 REST OF ASIA PACIFIC: MARKET, BY END USER,  2020–2023 (USD MILLION)
                       TABLE 92 REST OF ASIA PACIFIC: MARKET, BY END USER,  2024–2029 (USD MILLION)
     10.3 EUROPE 
             10.3.1 IMPACT OF RECESSION ON MARKET IN EUROPE
                       FIGURE 52 EUROPE: MARKET SNAPSHOT
                       TABLE 93 EUROPE: MARKET, BY OPERATION, 2020–2023 (USD MILLION)
                       TABLE 94 EUROPE: MARKET, BY OPERATION, 2024–2029 (USD MILLION)
                       TABLE 95 EUROPE: MARKET, BY POWER RATING,  2020–2023 (USD MILLION)
                       TABLE 96 EUROPE: MARKET, BY POWER RATING,  2024–2029 (USD MILLION)
                       TABLE 97 EUROPE: MARKET, BY SPEED, 2020–2023 (USD MILLION)
                       TABLE 98 EUROPE: MARKET, BY SPEED, 2024–2029 (USD MILLION)
                       TABLE 99 EUROPE: MARKET, BY END USER, 2020–2023 (USD MILLION)
                       TABLE 100 EUROPE: MARKET, BY END USER, 2024–2029 (USD MILLION)
                       TABLE 101 EUROPE: MARKET, BY COUNTRY, 2020–2023 (USD MILLION)
                       TABLE 102 EUROPE: MARKET, BY COUNTRY, 2024–2029 (USD MILLION)
             10.3.2 GERMANY
                       10.3.2.1 Recovery from recession to boost market growth
                                   TABLE 103 GERMANY: MARKET, BY OPERATION, 2020–2023 (USD MILLION)
                                   TABLE 104 GERMANY: MARKET, BY OPERATION, 2024–2029 (USD MILLION)
                                   TABLE 105 GERMANY: MARKET, BY END USER, 2020–2023 (USD MILLION)
                                   TABLE 106 GERMANY: MARKET, BY END USER, 2024–2029 (USD MILLION)
             10.3.3 FRANCE
                       10.3.3.1 Economic stabilization and gradual recovery from recession to propel market
                                   TABLE 107 FRANCE: MARKET, BY OPERATION, 2020–2023 (USD MILLION)
                                   TABLE 108 FRANCE: MARKET, BY OPERATION, 2024–2029 (USD MILLION)
                                   TABLE 109 FRANCE: MARKET, BY END USER, 2020–2023 (USD MILLION)
                                   TABLE 110 FRANCE: MARKET, BY END USER, 2024–2029 (USD MILLION)
             10.3.4 UK
                       10.3.4.1 Growing industrialization to drive demand
                                   TABLE 111 UK: MARKET, BY OPERATION, 2020–2023 (USD MILLION)
                                   TABLE 112 UK: MARKET, BY OPERATION, 2024–2029 (USD MILLION)
                                   TABLE 113 UK: MARKET, BY END USER, 2020–2023 (USD MILLION)
                                   TABLE 114 UK: MARKET, BY END USER, 2024–2029 (USD MILLION)
             10.3.5 RUSSIA
                       10.3.5.1 High emphasis on increasing industrial output to propel demand
                                   TABLE 115 RUSSIA: MARKET, BY OPERATION, 2020–2023 (USD MILLION)
                                   TABLE 116 RUSSIA: MARKET, BY OPERATION, 2024–2029 (USD MILLION)
                                   TABLE 117 RUSSIA: MARKET, BY END USER, 2020–2023 (USD MILLION)
                                   TABLE 118 RUSSIA: MARKET, BY END USER, 2024–2029 (USD MILLION)
             10.3.6 REST OF EUROPE
                       TABLE 119 REST OF EUROPE: MARKET, BY OPERATION,  2020–2023 (USD MILLION)
                       TABLE 120 REST OF EUROPE: MARKET, BY OPERATION,  2024–2029 (USD MILLION)
                       TABLE 121 REST OF EUROPE: MARKET, BY END USER,  2020–2023 (USD MILLION)
                       TABLE 122 REST OF EUROPE: MARKET, BY END USER,  2024–2029 (USD MILLION)
     10.4 SOUTH AMERICA 
             10.4.1 IMPACT OF RECESSION ON MARKET  IN SOUTH AMERICA
                       TABLE 123 SOUTH AMERICA: MARKET, BY OPERATION,  2020–2023 (USD MILLION)
                       TABLE 124 SOUTH AMERICA: MARKET, BY OPERATION,  2024–2029 (USD MILLION)
                       TABLE 125 SOUTH AMERICA: MARKET, BY POWER RATING,  2020–2023 (USD MILLION)
                       TABLE 126 SOUTH AMERICA: MARKET, BY POWER RATING,  2024–2029 (USD MILLION)
                       TABLE 127 SOUTH AMERICA: MARKET, BY SPEED,  2020–2023 (USD MILLION)
                       TABLE 128 SOUTH AMERICA: MARKET, BY SPEED,  2024–2029 (USD MILLION)
                       TABLE 129 SOUTH AMERICA: MARKET, BY END USER,  2020–2023 (USD MILLION)
                       TABLE 130 SOUTH AMERICA: MARKET, BY END USER,  2024–2029 (USD MILLION)
                       TABLE 131 SOUTH AMERICA: MARKET, BY COUNTRY,  2020–2023 (USD MILLION)
                       TABLE 132 SOUTH AMERICA: MARKET, BY COUNTRY,  2024–2029 (USD MILLION)
             10.4.2 BRAZIL
                       10.4.2.1 Rising demand for backup power supply and increased construction and mining projects to drive market
                                   TABLE 133 BRAZIL: MARKET, BY OPERATION, 2020–2023 (USD MILLION)
                                   TABLE 134 BRAZIL: MARKET, BY OPERATION, 2024–2029 (USD MILLION)
                                   TABLE 135 BRAZIL: MARKET, BY END USER, 2020–2023 (USD MILLION)
                                   TABLE 136 BRAZIL: MARKET, BY END USER, 2024–2029 (USD MILLION)
             10.4.3 ARGENTINA
                       10.4.3.1 Rising power generation and unreliable power supply to accelerate market growth
                                   TABLE 137 ARGENTINA: MARKET, BY OPERATION,  2020–2023 (USD MILLION)
                                   TABLE 138 ARGENTINA: MARKET, BY OPERATION,  2024–2029 (USD MILLION)
                                   TABLE 139 ARGENTINA: MARKET, BY END USER, 2020–2023 (USD MILLION)
                                   TABLE 140 ARGENTINA: MARKET, BY END USER, 2024–2029 (USD MILLION)
             10.4.4 CHILE
                       10.4.4.1 Increased infrastructure expenditure and unreliable power supply to fuel market growth
                                   TABLE 141 CHILE: MARKET, BY OPERATION, 2020–2023 (USD MILLION)
                                   TABLE 142 CHILE: MARKET, BY OPERATION, 2024–2029 (USD MILLION)
                                   TABLE 143 CHILE: MARKET, BY END USER, 2020–2023 (USD MILLION)
                                   TABLE 144 CHILE: MARKET, BY END USER, 2024–2029 (USD MILLION)
             10.4.5 REST OF SOUTH AMERICA
                       TABLE 145 REST OF SOUTH AMERICA: MARKET, BY OPERATION,  2020–2023 (USD MILLION)
                       TABLE 146 REST OF SOUTH AMERICA: MARKET, BY OPERATION,  2024–2029 (USD MILLION)
                       TABLE 147 REST OF SOUTH AMERICA: MARKET, BY END USER, 2020–2023 (USD MILLION)
                       TABLE 148 REST OF SOUTH AMERICA: MARKET, BY END USER,  2024–2029 (USD MILLION)
     10.5 MIDDLE EAST & AFRICA 
             10.5.1 IMPACT OF RECESSION ON MARKET IN MIDDLE EAST & AFRICA
                       TABLE 149 MIDDLE EAST & AFRICA: MARKET, BY OPERATION,  2020–2023 (USD MILLION)
                       TABLE 150 MIDDLE EAST & AFRICA: MARKET, BY OPERATION,  2024–2029 (USD MILLION)
                       TABLE 151 MIDDLE EAST & AFRICA: MARKET, BY POWER RATING,  2020–2023 (USD MILLION)
                       TABLE 152 MIDDLE EAST & AFRICA: MARKET, BY POWER RATING,  2024–2029 (USD MILLION)
                       TABLE 153 MIDDLE EAST & AFRICA: MARKET, BY SPEED,  2020–2023 (USD MILLION)
                       TABLE 154 MIDDLE EAST & AFRICA: MARKET, BY SPEED,  2024–2029 (USD MILLION)
                       TABLE 155 MIDDLE EAST & AFRICA: MARKET, BY END USER,  2020–2023 (USD MILLION)
                       TABLE 156 MIDDLE EAST & AFRICA: MARKET, BY END USER,  2024–2029 (USD MILLION)
                       TABLE 157 MIDDLE EAST & AFRICA: MARKET, BY COUNTRY,  2020–2023 (USD MILLION)
                       TABLE 158 MIDDLE EAST & AFRICA: MARKET, BY COUNTRY,  2024–2029 (USD MILLION)
             10.5.2 GCC COUNTRIES
                       TABLE 159 GCC COUNTRIES: MARKET, BY OPERATION,  2020–2023 (USD MILLION)
                       TABLE 160 GCC COUNTRIES: MARKET, BY OPERATION,  2024–2029 (USD MILLION)
                       TABLE 161 GCC COUNTRIES: MARKET, BY END USER,  2020–2023 (USD MILLION)
                       TABLE 162 GCC COUNTRIES: MARKET, BY END USER,  2024–2029 (USD MILLION)
                       TABLE 163 GCC COUNTRIES: MARKET, BY COUNTRY,  2020–2023 (USD MILLION)
                       TABLE 164 GCC COUNTRIES: MARKET, BY COUNTRY,  2024–2029 (USD MILLION)
                       10.5.2.1 Saudi Arabia
                                   10.5.2.1.1 Government-led initiatives to reduce emissions and promote cleaner energy solutions to propel market
                                   TABLE 165 SAUDI ARABIA: MARKET, BY OPERATION,  2020–2023 (USD MILLION)
                                   TABLE 166 SAUDI ARABIA: MARKET, BY OPERATION,  2024–2029 (USD MILLION)
                                   TABLE 167 SAUDI ARABIA: MARKET, BY END USER,  2020–2023 (USD MILLION)
                                   TABLE 168 SAUDI ARABIA: MARKET, BY END USER,  2024–2029 (USD MILLION)
                       10.5.2.2 UAE
                                   10.5.2.2.1 Rising infrastructure development and expanding industrial sector to fuel demand
                                   TABLE 169 UAE: MARKET, BY OPERATION, 2020–2023 (USD MILLION)
                                   TABLE 170 UAE: MARKET, BY OPERATION, 2024–2029 (USD MILLION)
                                   TABLE 171 UAE: MARKET, BY END USER, 2020–2023 (USD MILLION)
                                   TABLE 172 UAE: MARKET, BY END USER, 2024–2029 (USD MILLION)
                       10.5.2.3 KUWAIT
                                   10.5.2.3.1 Rapid industrialization and increasing energy demand to drive market
                                   TABLE 173 KUWAIT: MARKET, BY OPERATION, 2020–2023 (USD MILLION)
                                   TABLE 174 KUWAIT: MARKET, BY OPERATION, 2024–2029 (USD MILLION)
                                   TABLE 175 KUWAIT: MARKET, BY END USER, 2020–2023 (USD MILLION)
                                   TABLE 176 KUWAIT: MARKET, BY END USER, 2024–2029 (USD MILLION)
                       10.5.2.4 Rest of GCC Countries
                                   TABLE 177 REST OF GCC COUNTRIES: MARKET, BY OPERATION,  2020–2023 (USD MILLION)
                                   TABLE 178 REST OF GCC COUNTRIES: MARKET, BY OPERATION,  2024–2029 (USD MILLION)
                                   TABLE 179 REST OF GCC COUNTRIES: MARKET, BY END USER,  2020–2023 (USD MILLION)
                                   TABLE 180 REST OF GCC COUNTRIES: MARKET, BY END USER,  2024–2029 (USD MILLION)
             10.5.3 NIGERIA
                       10.5.3.1 Rising urbanization and industrialization to drive market
                                   TABLE 181 NIGERIA: MARKET, BY OPERATION, 2020–2023 (USD MILLION)
                                   TABLE 182 NIGERIA: MARKET, BY OPERATION, 2024–2029 (USD MILLION)
                                   TABLE 183 NIGERIA: MARKET, BY END USER, 2020–2023 (USD MILLION)
                                   TABLE 184 NIGERIA: MARKET, BY END USER, 2024–2029 (USD MILLION)
             10.5.4 ALGERIA
                       10.5.4.1 Increasing infrastructure development to boost demand
                                   TABLE 185 ALGERIA: MARKET, BY OPERATION, 2020–2023 (USD MILLION)
                                   TABLE 186 ALGERIA: MARKET, BY OPERATION, 2024–2029 (USD MILLION)
                                   TABLE 187 ALGERIA: MARKET, BY END USER, 2020–2023 (USD MILLION)
                                   TABLE 188 ALGERIA: MARKET, BY END USER, 2024–2029 (USD MILLION)
             10.5.5 IRAN
                       10.5.5.1 Rising demand for reliable power supply to propel market
            TABLE 189 IRAN: MARKET, BY OPERATION, 2020–2023 (USD MILLION)
                                   TABLE 190 IRAN: MARKET, BY OPERATION, 2024–2029 (USD MILLION)
                                   TABLE 191 IRAN: MARKET, BY END USER, 2020–2023 (USD MILLION)
                                   TABLE 192 IRAN: MARKET, BY END USER, 2024–2029 (USD MILLION)
             10.5.6 REST OF MIDDLE EAST & AFRICA
                       TABLE 193 REST OF MIDDLE EAST & AFRICA: MARKET, BY OPERATION, 2020–2023 (USD MILLION)
                       TABLE 194 REST OF MIDDLE EAST & AFRICA: MARKET, BY OPERATION, 2024–2029 (USD MILLION)
                       TABLE 195 REST OF MIDDLE EAST & AFRICA: MARKET, BY END USER,  2020–2023 (USD MILLION)
                       TABLE 196 REST OF MIDDLE EAST & AFRICA: MARKET, BY END USER,  2024–2029 (USD MILLION)
     10.6 NORTH AMERICA 
             10.6.1 IMPACT OF RECESSION ON MARKET IN NORTH AMERICA
                       FIGURE 53 NORTH AMERICA: MARKET SNAPSHOT
                       TABLE 197 NORTH AMERICA: MARKET, BY OPERATION,  2020–2023 (USD MILLION)
                       TABLE 198 NORTH AMERICA: MARKET, BY OPERATION,  2024–2029 (USD MILLION)
                       TABLE 199 NORTH AMERICA: MARKET, BY POWER RATING,  2020–2023 (USD MILLION)
                       TABLE 200 NORTH AMERICA: MARKET, BY POWER RATING,  2024–2029 (USD MILLION)
                       TABLE 201 NORTH AMERICA: MARKET, BY SPEED,  2020–2023 (USD MILLION)
                       TABLE 202 NORTH AMERICA: MARKET, BY SPEED,  2024–2029 (USD MILLION)
                       TABLE 203 NORTH AMERICA: MARKET, BY END USER,  2020–2023 (USD MILLION)
                       TABLE 204 NORTH AMERICA: MARKET, BY END USER,  2024–2029 (USD MILLION)
                       TABLE 205 NORTH AMERICA: MARKET, BY COUNTRY,  2020–2023 (USD MILLION)
                       TABLE 206 NORTH AMERICA: MARKET, BY COUNTRY,  2024–2029 (USD MILLION)
             10.6.2 US
             10.6.3 HIGH DEMAND FOR DIESEL POWER ENGINES IN INDUSTRIAL SECTOR TO DRIVE MARKET
                       TABLE 207 US: MARKET, BY OPERATION, 2020–2023 (USD MILLION)
                       TABLE 208 US: MARKET, BY OPERATION, 2024–2029 (USD MILLION)
                       TABLE 209 US: MARKET, BY END USER, 2020–2023 (USD MILLION)
                       TABLE 210 US: MARKET, BY END USER, 2024–2029 (USD MILLION)
             10.6.4 CANADA
                       10.6.4.1 Increasing remote operations and economic development to drive demand
                                   TABLE 211 CANADA: MARKET, BY OPERATION, 2020–2023 (USD MILLION)
                                   TABLE 212 CANADA: MARKET, BY OPERATION, 2024–2029 (USD MILLION)
                                   TABLE 213 CANADA: MARKET, BY END USER, 2020–2023 (USD MILLION)
                                   TABLE 214 CANADA: MARKET, BY END USER, 2024–2029 (USD MILLION)
             10.6.5 MEXICO
                       10.6.5.1 Infrastructure development and economic growth to fuel demand
                                   TABLE 215 MEXICO: MARKET, BY OPERATION, 2020–2023 (USD MILLION)
                                   TABLE 216 MEXICO: MARKET, BY OPERATION, 2024–2029 (USD MILLION)
                                   TABLE 217 MEXICO: MARKET, BY END USER, 2020–2023 (USD MILLION)
                                   TABLE 218 MEXICO: MARKET, BY END USER, 2024–2029 (USD MILLION)
 
11 COMPETITIVE LANDSCAPE (Page No. - 205)
     11.1 OVERVIEW 
     11.2 KEY PLAYER STRATEGIES/RIGHT TO WIN, 2020–2024 
               TABLE 219 MARKET: OVERVIEW OF STRATEGIES ADOPTED BY KEY PLAYERS, 2020–2024
     11.3 MARKET SHARE ANALYSIS, 2023 
               TABLE 220 MARKET: DEGREE OF COMPETITION, 2023
               FIGURE 54 MARKET SHARE ANALYSIS, 2023
     11.4 REVENUE ANALYSIS OF FIVE KEY PLAYERS, 2019–2023 
               FIGURE 55 MARKET: REVENUE ANALYSIS OF FIVE KEY PLAYERS, 2019–2023
     11.5 COMPANY EVALUATION MATRIX: KEY PLAYERS, 2023 
             11.5.1 STARS
             11.5.2 PERVASIVE PLAYERS
             11.5.3 EMERGING LEADERS
             11.5.4 PARTICIPANTS
                       FIGURE 56 MARKET: COMPANY EVALUATION MATRIX  (KEY PLAYERS), 2023
             11.5.5 COMPANY FOOTPRINT: KEY PLAYERS, 2023
                       11.5.5.1 Company footprint
                                   FIGURE 57 MARKET: COMPANY FOOTPRINT
                       11.5.5.2 Operation footprint
                                   TABLE 221 MARKET: OPERATION FOOTPRINT
             11.5.6 POWER RATING FOOTPRINT
                       TABLE 222 MARKET: POWER RATING FOOTPRINT
                       11.5.6.1 Speed footprint
                                   TABLE 223 MARKET: SPEED FOOTPRINT
                       11.5.6.2 End user footprint
                                   TABLE 224 MARKET: END USER FOOTPRINT
                       11.5.6.3 Region footprint
                                   TABLE 225 MARKET: REGION FOOTPRINT
     11.6 COMPANY EVALUATION MATRIX: START-UPS/SMES, 2023 
             11.6.1 DYNAMIC COMPANIES
             11.6.2 PROGRESSIVE COMPANIES
             11.6.3 RESPONSIVE COMPANIES
             11.6.4 STARTING BLOCKS
                       FIGURE 58 MARKET: COMPANY EVALUATION MATRIX (START-UPS/SMES), 2023
             11.6.5 COMPETITIVE BENCHMARKING: START-UPS/SMES, 2023
                       11.6.5.1 Detailed list of key start-ups/SMEs
                                   TABLE 226 MARKET: DETAILED LIST OF KEY START-UPS/SMES
                       11.6.5.2 Competitive benchmarking of key start-ups/SMEs
                                   TABLE 227 MARKET: COMPETITIVE BENCHMARKING OF KEY START-UPS/SMES
     11.7 COMPANY VALUATION AND FINANCIAL METRICS 
               FIGURE 59 COMPANY VALUATION
               FIGURE 60 FINANCIAL METRICS
     11.8 BRAND/PRODUCT COMPARISON 
               FIGURE 61 BRAND/PRODUCT COMPARISON
     11.9 COMPETITIVE SCENARIOS AND TRENDS 
             11.9.1 PRODUCT LAUNCHES
                       TABLE 228 MARKET: PRODUCT LAUNCHES, JUNE 2020–MAY 2024
             11.9.2 DEALS
                       TABLE 229 MARKET: DEALS, JUNE 2020–MAY 2024
             11.9.3 OTHERS
                       TABLE 230 MARKET: OTHERS, JUNE 2020–MAY 2024
             11.9.4 EXPANSIONS
                       TABLE 231 MARKET: EXPANSIONS, JUNE 2020–MAY 2024
 
12 COMPANY PROFILES (Page No. - 228)
(Business overview, Products/Services/Solutions offered, Recent Developments, MNM view)*
     12.1 KEY PLAYERS 
             12.1.1 CATERPILLAR
                       TABLE 232 CATERPILLAR: COMPANY OVERVIEW
                       FIGURE 62 CATERPILLAR: COMPANY SNAPSHOT
                       TABLE 233 CATERPILLAR: PRODUCTS/SOLUTIONS/SERVICES OFFERED
                       TABLE 234 CATERPILLAR: PRODUCT LAUNCHES
                       TABLE 235 CATERPILLAR: DEALS
             12.1.2 CUMMINS INC.
                       TABLE 236 CUMMINS INC.: COMPANY OVERVIEW
                       FIGURE 63 CUMMINS INC.: COMPANY SNAPSHOT
                       TABLE 237 CUMMINS INC.: PRODUCTS/SOLUTIONS/SERVICES OFFERED
                       TABLE 238 CUMMINS INC.: DEALS
                       TABLE 239 CUMMINS INC.: OTHERS
             12.1.3 ROLLS-ROYCE PLC
                       TABLE 240 ROLLS-ROYCE PLC: COMPANY OVERVIEW
                       FIGURE 64 ROLLS-ROYCE PLC: COMPANY SNAPSHOT
                       TABLE 241 ROLLS-ROYCE PLC: PRODUCTS/SOLUTIONS/SERVICES OFFERED
                       TABLE 242 ROLLS-ROYCE PLC: PRODUCT LAUNCHES
                       TABLE 243 ROLLS-ROYCE PLC: DEALS
             12.1.4 MAN
                       TABLE 244 MAN: COMPANY OVERVIEW
                       FIGURE 65 MAN: COMPANY SNAPSHOT
                       TABLE 245 MAN: PRODUCTS/SOLUTIONS/SERVICES OFFERED
                       TABLE 246 MAN: EXPANSIONS
             12.1.5 WEICHAI POWER CO.,LTD
                       TABLE 247 WEICHAI POWER CO.,LTD: COMPANY OVERVIEW
                       FIGURE 66 WEICHAI POWER CO.,LTD: COMPANY SNAPSHOT
                       TABLE 248 WEICHAI POWER CO.,LTD: PRODUCTS/SOLUTIONS/SERVICES OFFERED
                       TABLE 249 WEICHAI POWER CO.,LTD: DEALS
             12.1.6 WÄRTSILÄ
                       TABLE 250 WÄRTSILÄ: COMPANY OVERVIEW
                       FIGURE 67 WÄRTSILÄ: COMPANY SNAPSHOT
                       TABLE 251 WÄRTSILÄ: PRODUCTS/SOLUTIONS/SERVICES OFFERED
                       TABLE 252 WÄRTSILÄ: DEALS
                       TABLE 253 WÄRTSILÄ: OTHERS
             12.1.7 AB VOLVO PENTA
                       TABLE 254 AB VOLVO PENTA: COMPANY OVERVIEW
                       FIGURE 68 AB VOLVO PENTA: COMPANY SNAPSHOT
                       TABLE 255 AB VOLVO PENTA: PRODUCTS/SOLUTIONS/SERVICES OFFERED
                       TABLE 256 AB VOLVO PENTA: PRODUCT LAUNCHES
                       TABLE 257 AB VOLVO PENTA: DEALS
             12.1.8 MITSUBISHI HEAVY INDUSTRIES, LTD.
                       TABLE 258 MITSUBISHI HEAVY INDUSTRIES, LTD.: COMPANY OVERVIEW
                       FIGURE 69 MITSUBISHI HEAVY INDUSTRIES, LTD.: COMPANY SNAPSHOT
                       TABLE 259 MITSUBISHI HEAVY INDUSTRIES, LTD.: PRODUCTS/SOLUTIONS/SERVICES OFFERED
                       TABLE 260 MITSUBISHI HEAVY INDUSTRIES, LTD.: DEALS
                       TABLE 261 MITSUBISHI HEAVY INDUSTRIES, LTD.: OTHERS
             12.1.9 HD HYUNDAI INFRACORE
                       TABLE 262 HD HYUNDAI INFRACORE: COMPANY OVERVIEW
                       FIGURE 70 HD HYUNDAI INFRACORE: COMPANY SNAPSHOT
                       TABLE 263 HD HYUNDAI INFRACORE: PRODUCTS/SOLUTIONS/SERVICES OFFERED
                       TABLE 264 HD HYUNDAI INFRACORE: OTHERS
             12.1.10 DAIHATSU DIESEL MFG. CO., LTD.
                                   TABLE 265 DAIHATSU DIESEL MFG. CO., LTD.: COMPANY OVERVIEW
                                   FIGURE 71 DAIHATSU DIESEL MFG. CO., LTD.: COMPANY SNAPSHOT
                                   TABLE 266 DAIHATSU DIESEL MFG., CO. LTD.: PRODUCTS/SOLUTIONS/SERVICES OFFERED
                                   TABLE 267 DAIHATSU DIESEL MFG. CO., LTD.: DEALS
             12.1.11 YANMAR HOLDINGS CO., LTD.
                                   TABLE 268 YANMAR HOLDINGS CO., LTD.: COMPANY OVERVIEW
                                   TABLE 269 YANMAR HOLDINGS CO., LTD.: PRODUCTS/SOLUTIONS/SERVICES OFFERED
                                   TABLE 270 YANMAR HOLDINGS CO., LTD.: DEALS
             12.1.12 KUBOTA CORPORATION
                                   TABLE 271 KUBOTA CORPORATION: COMPANY OVERVIEW
                                   FIGURE 72 KUBOTA CORPORATION: COMPANY SNAPSHOT
                                   TABLE 272 KUBOTA CORPORATION: PRODUCTS/SOLUTIONS/SERVICES OFFERED
             12.1.13 KOHLER ENERGY
                                   TABLE 273 KOHLER ENERGY: COMPANY OVERVIEW
                                   TABLE 274 KOHLER ENERGY: PRODUCTS/SOLUTIONS/SERVICES OFFERED
                                   TABLE 275 KOHLER ENERGY: DEALS
             12.1.14 DEUTZ AG
                                   TABLE 276 DEUTZ AG: COMPANY OVERVIEW
                                   FIGURE 73 DEUTZ AG: COMPANY SNAPSHOT
                                   TABLE 277 DEUTZ AG: PRODUCTS/SOLUTIONS/SERVICES OFFERED
                                   TABLE 278 DEUTZ AG: DEALS
                                   TABLE 279 DEUTZ AG: EXPANSIONS
             12.1.15 MAHINDRA & MAHINDRA LTD.
                                   TABLE 280 MAHINDRA & MAHINDRA LTD.: COMPANY OVERVIEW
                                   TABLE 281 MAHINDRA & MAHINDRA LTD.: PRODUCTS/SOLUTIONS/SERVICES OFFERED
             12.1.16 IHI POWER SYSTEMS CO., LTD.
                                   TABLE 282 IHI POWER SYSTEMS CO., LTD.: COMPANY OVERVIEW
                                   TABLE 283 IHI POWER SYSTEMS CO., LTD.: PRODUCTS/SOLUTIONS/SERVICES OFFERED
             12.1.17 GUANGZHOU DIESEL ENGINE FACTORY LIMITED
                                   TABLE 284 GUANGZHOU DIESEL ENGINE FACTORY LIMITED: COMPANY OVERVIEW
                                   TABLE 285 GUANGZHOU DIESEL ENGINE FACTORY LIMITED: PRODUCTS/SOLUTIONS/ SERVICES OFFERED
             12.1.18 WABTEC CORPORATION
                                   TABLE 286 WABTEC CORPORATION: COMPANY OVERVIEW
                                   FIGURE 74 WABTEC CORPORATION: COMPANY SNAPSHOT
                                   TABLE 287 WABTEC CORPORATION: PRODUCTS/SOLUTIONS/SERVICES OFFERED
             12.1.19 ISOTTA FRASCHINI MOTORI S.P.A.
                                   ABLE 288 ISOTTA FRASCHINI MOTORI S.P.A.: COMPANY OVERVIEW
                                   TABLE 289 ISOTTA FRASCHINI MOTORI S.P.A.: PRODUCTS/SOLUTIONS/SERVICES OFFERED
             12.1.20 ANGLO BELGIAN CORPORATION
                                   TABLE 290 ANGLO BELGIAN CORPORATION: COMPANY OVERVIEW
                                   TABLE 291 ANGLO BELGIAN CORPORATION: PRODUCTS/SOLUTIONS/SERVICES OFFERED
     12.2 OTHER PLAYERS 
             12.2.1 CNPC JICHAI POWERCOMPANY LIMITED
             12.2.2 FPT INDUSTRIAL S.P.A.
             12.2.3 SCANIA
             12.2.4 LIEBHERR
             12.2.5 MOTORENFABRIK HATZ GMBH & CO. KG
*Details on Business overview, Products/Services/Solutions offered, Recent Developments, MNM view might not be captured in case of unlisted companies.
 
13 APPENDIX (Page No. - 284)
     13.1 INSIGHTS FROM INDUSTRY EXPERTS 
     13.2 DISCUSSION GUIDE 
     13.3 KNOWLEDGESTORE: MARKETSANDMARKETS’  SUBSCRIPTION PORTAL 
     13.4 CUSTOMIZATION OPTIONS 
     13.5 RELATED REPORTS 
     13.6 AUTHOR DETAILS 

This study encompassed significant efforts in determining the present size of the diesel power engine market. It commenced with a thorough secondary research process to gather data related to the market, similar markets, and the overarching industry. Subsequently, these findings, assumptions, and market size calculations were rigorously validated by consulting industry experts across the entire supply chain through primary research. The total market size was assessed by conducting an analysis specific to each country. Following that, the market was further dissected, and the data was cross-referenced to estimate the size of various segments and sub-segments within the market.

Secondary Research

In this research study, a wide range of secondary sources were utilized, including directories, databases, and reputable references such as Hoover's, Bloomberg BusinessWeek, Factiva, World Bank, International Monetary Fund (IMF), the US Department of Energy (DOE), and the International Energy Agency (IEA). These sources played a crucial role in gathering valuable data for a comprehensive analysis of the global diesel power engine market, covering technical, market-oriented, and commercial aspects. Additional secondary sources included annual reports, press releases, investor presentations, whitepapers, authoritative publications, articles authored by well-respected experts, information from industry associations, trade directories, and various database resources.

Primary Research

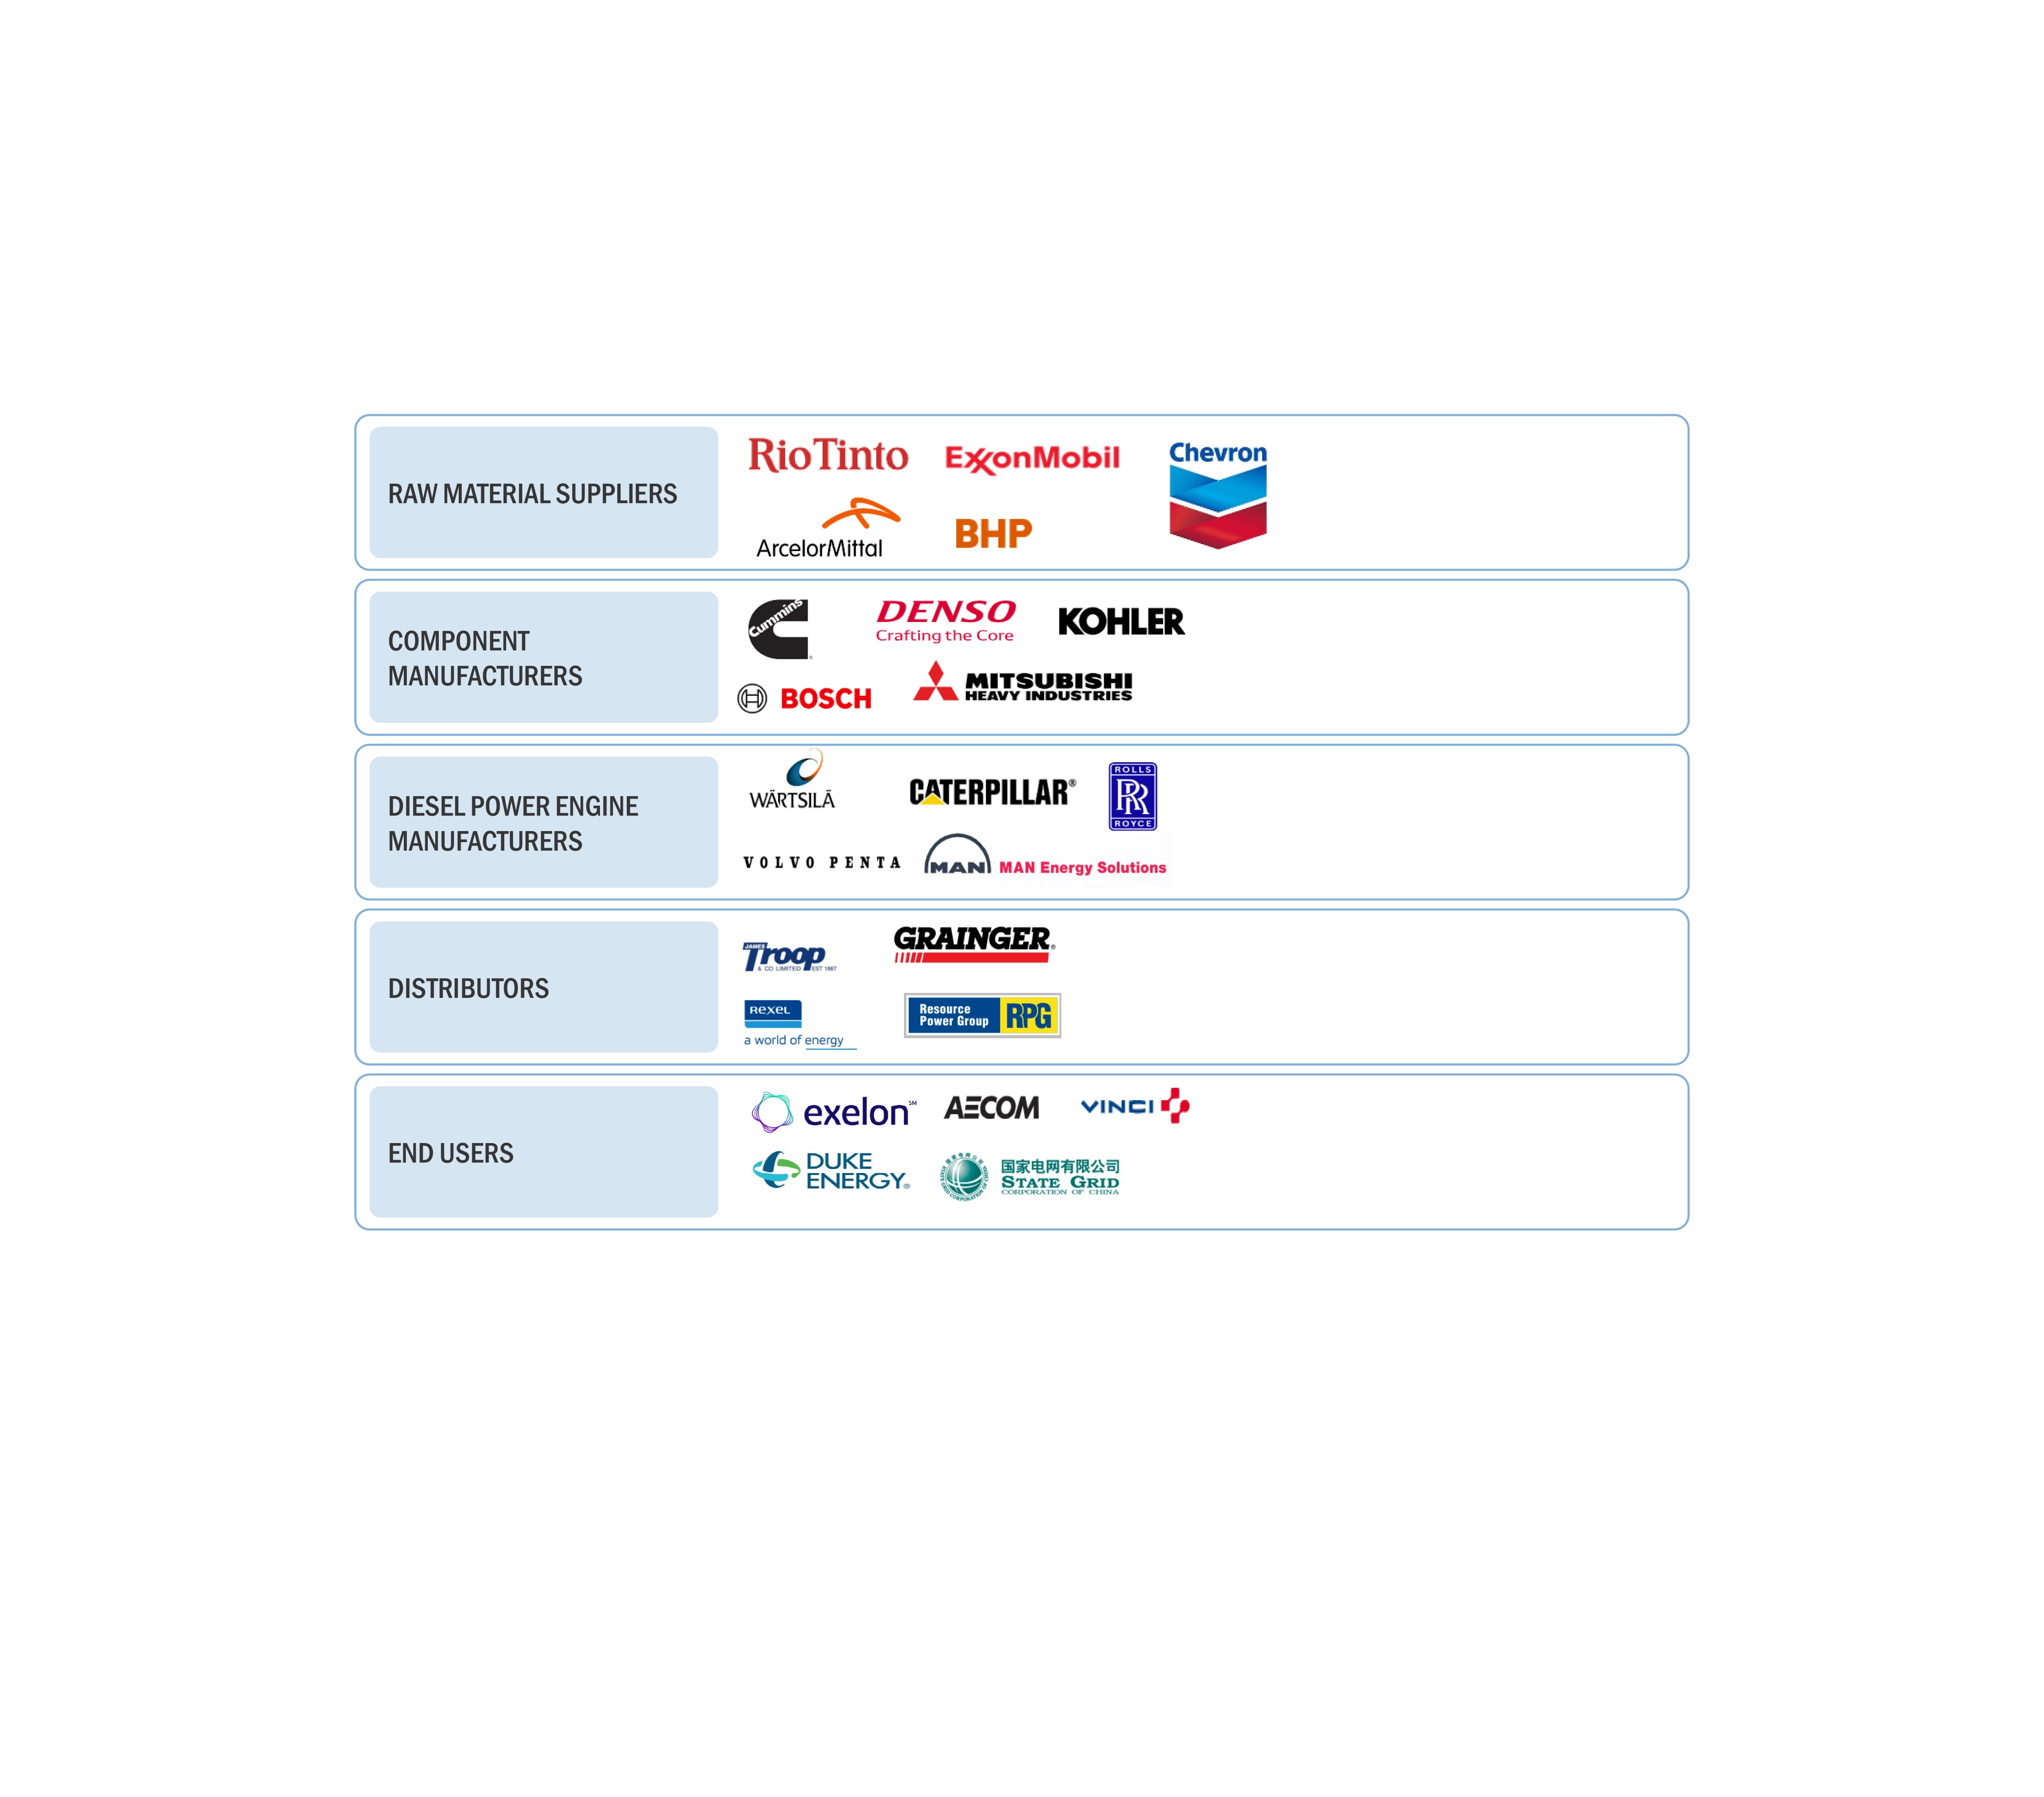
The diesel power engine market involves a range of stakeholders, including raw material suppliers, component manufacturers, diesel power engine manufacturers/assemblers, distributors, end users, and post-sale services within the supply chain. The demand for this market is primarily driven by end users such as power utilities, residential & commercial. On the supply side, there is a notable trend of heightened demand for contracts from the industrial sector and a significant presence of investments and expansions among major players.

To gather qualitative and quantitative insights, various primary sources from both the supply and demand sides of the market were interviewed. The following breakdown presents the primary respondents involved in the research study.

Diesel Power Engine Market Size, and Share

To know about the assumptions considered for the study, download the pdf brochure

Market Size Estimation

The estimation and validation of the diesel power engine market size have been conducted using a bottom-up approach. This approach was rigorously employed to ascertain the dimensions of multiple subsegments within the market. The research process comprises the following key stages.

In this method, the production statistics for each type of diesel power engine have been examined at both the country and regional levels.

Thorough secondary and primary research has been conducted to gain a comprehensive understanding of the global market landscape for various segments of diesel power engines.

Numerous primary interviews have been undertaken with key experts in the field of diesel power engine development, encompassing important OEMs and Tier I suppliers.

When calculating and forecasting the market size, qualitative factors such as market drivers, limitations, opportunities, and challenges have been taken into account.

Global Diesel Power Engine Market Size: Bottom-Up Approach

Diesel Power Engine Market Bottom Up Approach

To know about the assumptions considered for the study, Request for Free Sample Report

Data Triangulation

The process of determining the overall market size involved the methodologies described earlier, followed by segmenting the market into multiple segments and subsegments. To finalize the comprehensive market analysis and obtain precise statistics for each market segment and subsegment, data triangulation and market segmentation techniques were applied, as appropriate. Data triangulation was accomplished by examining various factors and trends from both the demand and supply perspectives within the ecosystem of the diesel power engine market.

Market Definition

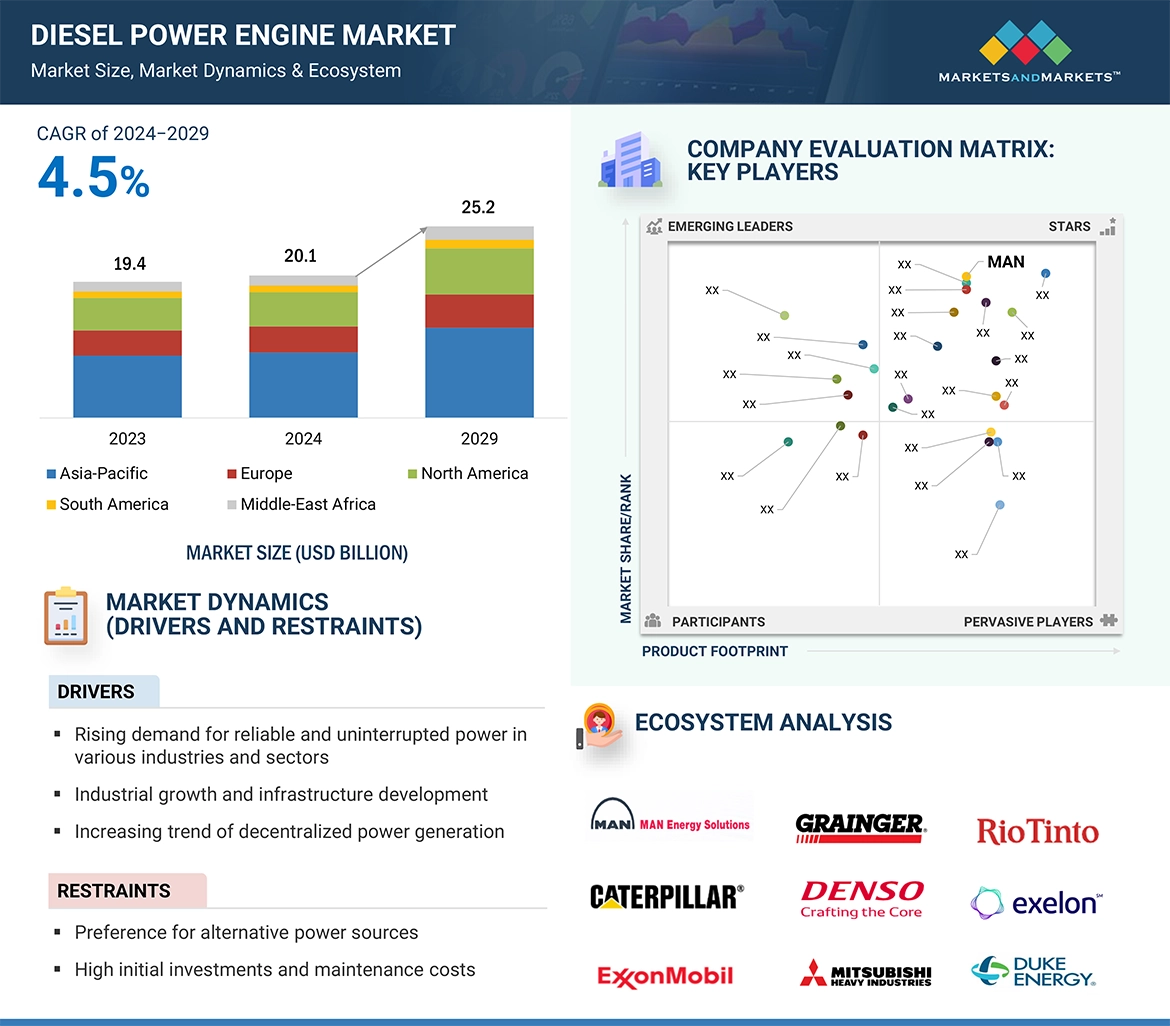
A diesel power engine is an internal combustion engine that operates on the principle of compression ignition. It uses diesel fuel, a type of petroleum-derived liquid fuel, as its primary source of energy. In a diesel engine, air is compressed within the combustion chamber to a high temperature, causing the diesel fuel to ignite spontaneously upon injection into the chamber. This combustion process generates mechanical energy, which is harnessed to drive various applications such as vehicles, generators, construction equipment, marine vessels, and industrial machinery. Diesel engines are renowned for their fuel efficiency, durability, and high torque output, making them widely used across diverse industries for both stationary and mobile power generation.

Key Stakeholders

  • Government & research organizations
  • Institutional investors
  • Investors/shareholders
  • Environmental research institutes
  • Manufacturers’ associations
  • Diesel power engine raw material and component manufacturers
  • Diesel power engine manufacturers, dealers, and suppliers
  • State and national regulatory authorities
  • Manufacturing industry
  • Energy efficiency consultancies
  • Smart grid project developers
  • Public & private power generation, transmission & distribution companies (utilities)
  • Sub-station equipment manufacturing companies

Objectives of the Study

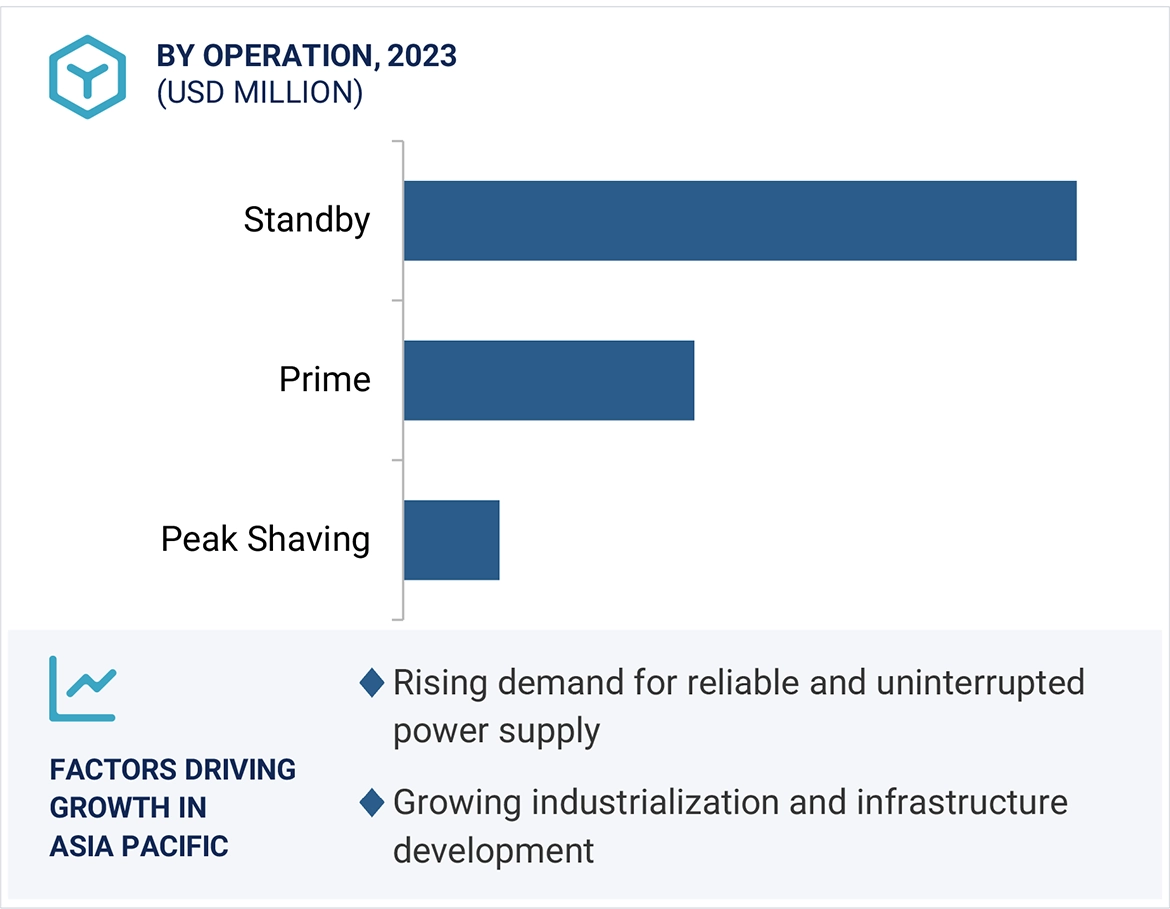
  • To describe and forecast the diesel power engine market, in terms of value, by operation, power rating, speed, end user, and region
  • To forecast the market for various segments, in terms of value, with regard to five regions: North America, South America, Europe, Asia Pacific, and the Middle East & Africa, along with their key countries
  • To provide detailed information about the key factors, such as drivers, restraints, opportunities, and challenges, influencing the market’s growth
  • To strategically analyze the subsegments with respect to individual growth trends, prospects, and contributions of each segment to the overall market size
  • To study the complete supply chain and allied industry segments and perform a supply chain analysis of the diesel power engine landscape
  • To strategically analyze the regulatory landscape, tariff, standards, patents, Porter’s five forces, import and export scenarios, trade values, and case studies pertaining to the market under study
  • To analyze the opportunities in the market for various stakeholders by identifying the high-growth segments of the diesel power engine market
  • To profile the key players and comprehensively analyze their market position in terms of ranking and core competencies1, along with detailing the competitive landscape for the market leaders
  • To analyze competitive developments such as agreements, partnerships, product launches, acquisitions, contracts, expansions, and investments in the diesel power engine market

Available Customization

With the given market data, MarketsandMarkets offers customizations based on the company’s specific needs. The following customization options are available for the report:

Product Analysis

  • Product Matrix, which provides a detailed comparison of the product portfolio of each company

Company Information

  • Detailed analyses and profiling of additional market players (up to 5)
Custom Market Research Services

We will customize the research for you, in case the report listed above does not meet with your exact requirements. Our custom research will comprehensively cover the business information you require to help you arrive at strategic and profitable business decisions.

Request Customization
Report Code
EP 5925
Published ON
Jun, 2024
Choose License Type
BUY NOW
  • SHARE
X
Request Customization
Speak to Analyst
Speak to Analyst
OR FACE-TO-FACE MEETING
PERSONALIZE THIS RESEARCH
  • Triangulate with your Own Data
  • Get Data as per your Format and Definition
  • Gain a Deeper Dive on a Specific Application, Geography, Customer or Competitor
  • Any level of Personalization
REQUEST A FREE CUSTOMIZATION
LET US HELP YOU!
  • What are the Known and Unknown Adjacencies Impacting the Diesel Power Engine Market
  • What will your New Revenue Sources be?
  • Who will be your Top Customer; what will make them switch?
  • Defend your Market Share or Win Competitors
  • Get a Scorecard for Target Partners
CUSTOMIZED WORKSHOP REQUEST
  • Call Us
  • +1-888-600-6441 (Corporate office hours)
  • +1-888-600-6441 (US/Can toll free)
  • +44-800-368-9399 (UK office hours)
CONNECT WITH US
ABOUT TRUST ONLINE
©2024 MarketsandMarkets Research Private Ltd. All rights reserved
DMCA.com Protection Status Website Feedback