This study undertook extensive efforts to determine the current size of the gas engine market. It began with a thorough secondary research phase aimed at gathering data on the market, related markets, and the broader industry landscape. Subsequently, the collected data, assumptions, and calculations underwent meticulous validation through primary research, which involved consultations with industry experts across the entire value chain. The assessment of the overall market size was conducted through a tailored analysis for each country. Following this, a detailed examination of the market occurred, and the data was cross-referenced to estimate the sizes of various segments and sub-segments within the market. This two-phased approach, incorporating both secondary and primary research methodologies, enhances the reliability and accuracy of the study's findings.
Secondary Research
Throughout this research study, an extensive range of secondary sources was utilized, comprising directories, databases, and respected references such as Hoover's, Bloomberg BusinessWeek, Factiva, World Bank, the US Department of Energy (DOE), and the International Energy Agency (IEA). These sources played a crucial role in gathering valuable data essential for conducting a thorough analysis of the global gas engine market. Covering technical, market-oriented, and commercial aspects, these secondary sources significantly contributed to the breadth and depth of the study. Furthermore, additional secondary sources included annual reports, press releases, investor presentations, whitepapers, authoritative publications, articles authored by reputable experts, information from industry associations, trade directories, and various database resources. The wide array of secondary sources utilized ensures a robust and well-informed foundation for the research study.
Primary Research
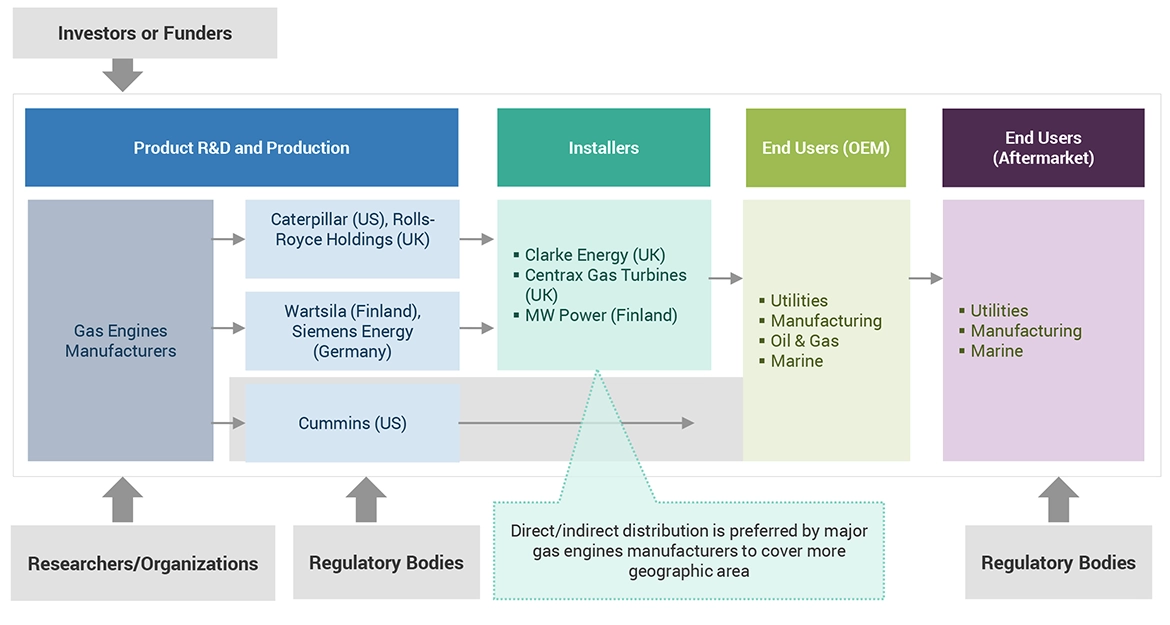
The gas engine market involves multiple stakeholders throughout its supply chain, including component manufacturers, product manufacturers/assemblers, service providers, distributors, and end-users. Industrial end-users primarily drive market demand, with increasing requirements from transmission and distribution utilities also contributing significantly to market growth. On the supply side, a noticeable trend is the heightened demand for contracts from the industrial sector, alongside a notable prevalence of mergers and acquisitions among major industry players. To gain a comprehensive understanding of the market, both qualitatively and quantitatively, a variety of primary sources from both the supply and demand sides were interviewed. The breakdown below outlines the primary respondents who played a crucial role in providing insights for the research study.

To know about the assumptions considered for the study, download the pdf brochure
Market Size Estimation
The gas engine market size was meticulously estimated and validated using a bottom-up approach. This method was rigorously used to determine the dimensions of various market subsegments. The research process includes the following key stages.
-
This approach looked at national and regional production figures for all types of gas engines.
-
Extensive secondary and primary research was conducted to gain a comprehensive understanding of the global market environment for various types of engines.
-
Several primary interviews were conducted with leading gas engine system development experts, including major OEMs and Tier I suppliers.
-
When estimating and projecting market size, qualitative factors such as market drivers, constraints, opportunities, and challenges are taken into account.
Global Gas Engine Market Size: Bottom-Up Approach

To know about the assumptions considered for the study, Request for Free Sample Report
Global Gas Engine Market Size: Top-Down Approach

Data Triangulation
The process of establishing the overall market size involved employing the methodologies described earlier, which included segmenting the market into various segments and subsegments. To conclude the comprehensive market analysis and obtain accurate statistics for each market segment and subsegment, data triangulation and market segmentation techniques were applied as deemed suitable. Data triangulation entailed a thorough assessment of diverse factors and trends from both the demand and supply perspectives within the ecosystem of the gas engines market.
Market Definition
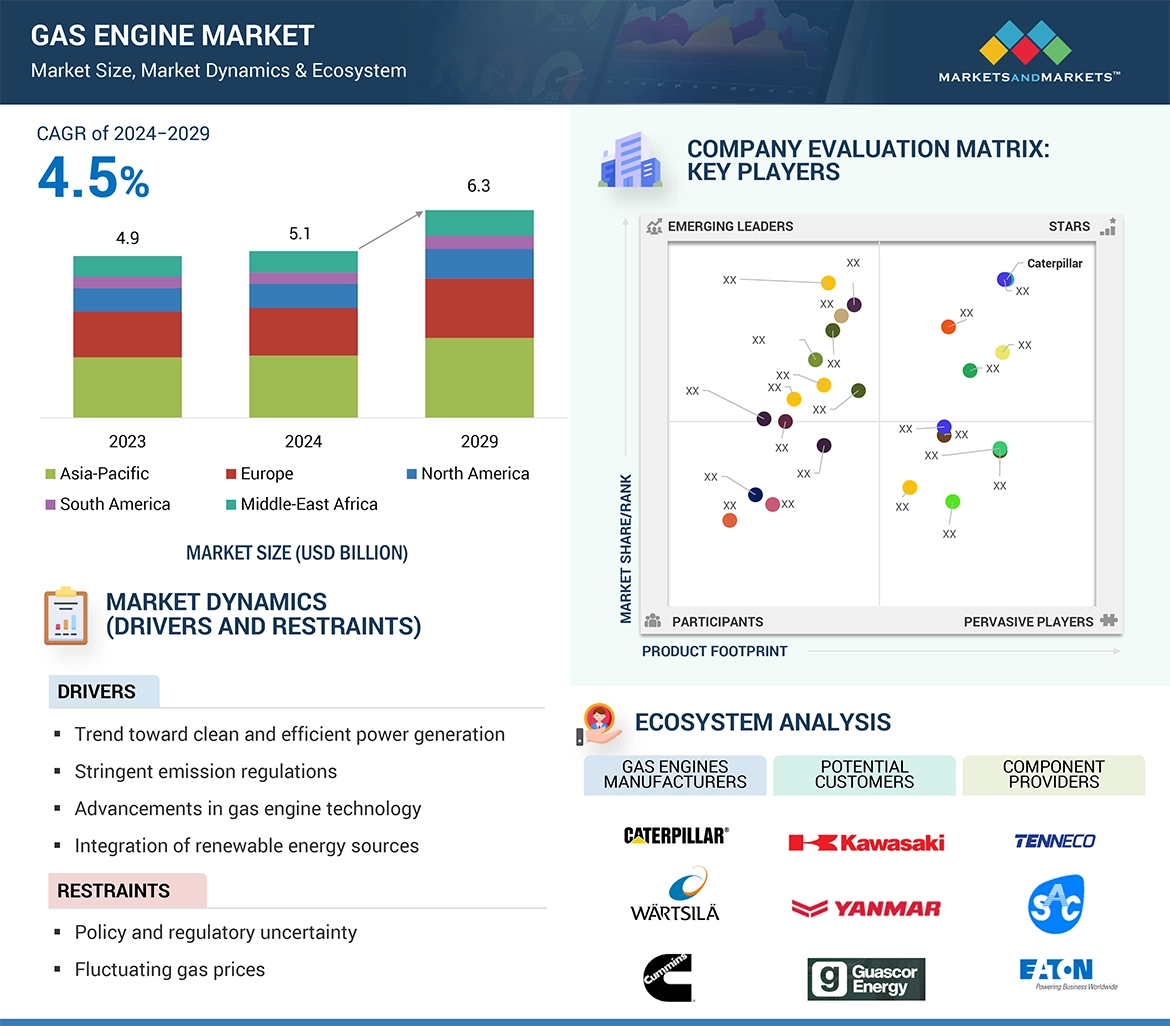
A gas engine, also known as a combustion engine or reciprocating engine, is a type of internal combustion engine that operates on a gaseous fuel, such as natural gas, propane, or biogas. Gas engines convert the chemical energy of the fuel into mechanical energy through a series of controlled explosions within cylinders. This mechanical energy is then utilized to power various applications, including electricity generation, mechanical drive systems, and transportation. Gas engines are renowned for their versatility, reliability, and efficiency, making them widely utilized in industries ranging from power generation and manufacturing to transportation and agriculture. They offer advantages such as lower emissions, reduced fuel costs, and greater fuel flexibility compared to traditional diesel engines, making them an attractive choice for applications requiring clean and efficient power solutions.
Key Stakeholders
-
Government Utility Providers
-
Independent Power Producers
-
Engine manufacturers
-
Power equipment and garden tool manufacturers
-
Consulting companies in the energy & power sector
-
Distribution utilities
-
Government and research organizations
-
Organizations, forums, and associations
-
Raw material suppliers
-
State and national regulatory authorities
-
Engine manufacturers, distributors, and suppliers
-
Engines original equipment manufacturers (OEMs)
Objectives of the Study
-
The gas engine market will be defined, characterised, segmented, and projected using parameters such as fuel type, power output, application, and end user.
-
To forecast market sizes in North America, South America, Europe, Asia Pacific, the Middle East, and Africa, as well as the major countries in each of these five regions.
-
To provide comprehensive insights into the factors driving market drivers, restraints, opportunities, and challenges unique to the industry.
-
To strategically examine each subsegment's growth trends, future potential, and overall market share.
-
To evaluate market prospects for potential buyers and the competitive landscape for industry leaders.
-
To thoroughly examine the market shares and core competencies of the major players and create strategic profiles for them.
-
To monitor and evaluate competitive developments in the gas engines market, such as partnerships, agreements, sales contracts, new product launches, acquisitions, joint ventures, contracts, expansions, and investments.
-
The market for gas engines is evaluated in this report.
Available Customization
With the given market data, MarketsandMarkets offers customizations based on the company’s specific needs. The following customization options are available for the report:
Product Analysis
-
Product Matrix, which provides a detailed comparison of the product portfolio of each company
Company Information
-
Detailed analyses and profiling of additional market players (up to 5)


Growth opportunities and latent adjacency in Gas Engine Market