Holographic Display Market by Technology (Electro holographic, Touchable, Laser), Product (Camera, Digital Signage, Medical scanners, Smart TV), Application (Consumer, Commercial, Medical, Industrial ), Geography - Global Forecast to 2013 - 2020


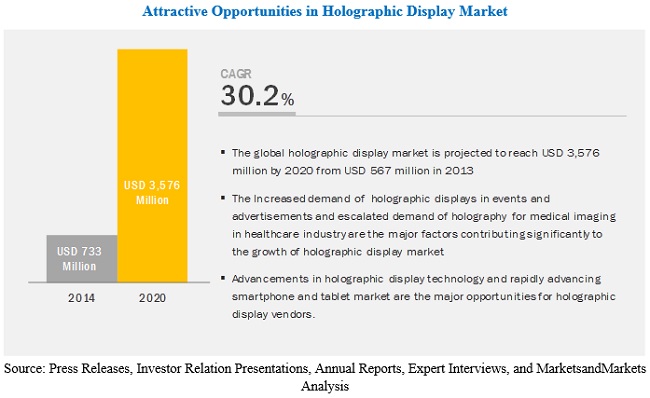
The holographic display market is projected to reach USD 3,576 million by 2020 from USD 567 million in 2013, at a CAGR of 30.2%. The major drivers for the market�s growth are increased demand of holographic displays in events and advertisements and escalated demand of holography for medical imaging in healthcare industry. Opportunities for the holographic display market include advancements in holographic display technology; and rapidly advancing smartphone and tablet market.
�Semitransparent technology to dominate the holographic display market during the forecast period�
The holographic display market is segmented on the basis on technology into semitransparent/electro holographic, touchable, laser/plasma, and piston. In 2013, the electro or semitransparent holographic display technology accounted for the largest share and expected to dominate the market during the forecast period. The electro holographic display technology uses electro holography to record and reconstruct 3D images. This technology can reconstruct 3D images with full parallax. Moreover, electro holographic display not only projects the hologram at video rate but also adds hologram frames in real-time to permit user interaction.
�Smart TV/Holo TV segment to grow at the fastest CAGR during the forecast period�
The holographic display market is segmented on the basis on product into cameras, digital signage screens, kiosks, medical scanners/imaging, notebooks and laptops, smart/Holo TVs, and others. TV�s have advanced over the years and the commercialization of smart 3D TV is the latest development. A holographic TV is a new technological trend in this industry, these TVs are also called as Holo-TVs. The market for holo TV�s is expected to grow at the higher CAGR during the forecast period owing to advancements in holographic technology and increasing usage in medical applications.
�Medical applications held the largest share of the holographic display market in 2013�
Medical imaging has witnessed a rapid technological advancement over the years, which has created a need for advanced imaging equipment. In the current market scenario, 3D and 4D technologies are widely used in medical imaging, where 3D technology is used to generate the 3D image of affected body parts. The advancement in the technology has brought an advantage to the medical imaging field. The use of holographic imaging and projection has led to drastic changes in the field of medical and health care. The use of holography in medical and healthcare helps doctors diagnose and treat the affected body part or disease in an easy and timely manner.
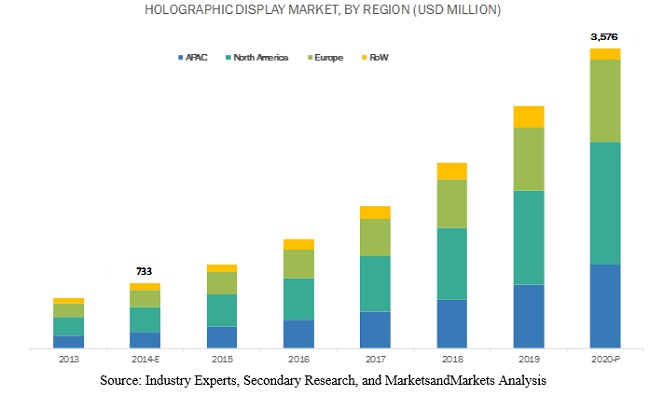
�North America to hold the largest share of the holographic display market during the forecast period�
The holographic display market has been segmented based on geography into four major regions�North America, Europe, Asia Pacific (APAC), and Rest of the World (RoW). North America accounts for the largest share in the global market and this is attributed to continuous research and development in this region followed by APAC and Europe. The North American market is in a state of rapid growth, where this technology has been implemented in applications such as medical, commercial, consumer, and industrial. Manufacturers with the ability to consign significant resources for research and development can overcome technical challenges such as bandwidth requirement and computation, which is associated with the holographic technology. The size of the region, the affluence of its consumers, and the competitiveness of products make it a good market for holographic display product manufacturer. In North America, leading companies in the market are AV Concepts (U.S.), Eon Reality Inc. (U.S.), Qualcomm (U.S.), Zebra Imaging (U.S.), Holoxica (U.K.), Provision Holdings Inc. (U.S.), ViewSonic Corp. (U.S.), among others.
Key Market Players
AV Concepts (US), Eon Reality Inc. (US), Konica Minolta Inc. (Japan), Qualcomm (US), Zebra Imaging (U.S.), Holoxica Ltd (UK), Musion Das Hologram Ltd. (UK), Provision Holdings Inc. (US), Realview Imaging Ltd. (Israel), and ViewSonic Corp. (US) are some of the major players in holographic display market.
Scope of the Report:
|
Report Metric |
Details |
|
Report Name |
Holographic display market |
|
Base year |
2013 |
|
Forecast period |
2014�2020 |
|
Units |
Value (USD) |
|
Segments covered |
Type, End User, Offerings, and Region |
|
Geographic regions covered |
North America, APAC, Europe, and RoW |
|
Companies covered |
AV Concepts (U.S.), Eon Reality Inc. (U.S.), Konica Minolta Inc. (Japan), Qualcomm (U.S.), Zebra Imaging (U.S.), Holoxica Ltd (U.K.), Musion Das Hologram Ltd. (U.K.), Provision Holdings Inc. (U.S.), Realview Imaging Ltd. (Israel), and ViewSonic Corp. (U.S.) |
Holographic display market segmentation:
In this report, the holographic display market is segmented into the following categories:
Holographic display market, by Technology:
- Semi Transparent/Electro Holographic Display
- Touchable
- Laser Piston
Holographic display market, by Product Type:
- Camera
- Digital Signage
- Kiosks
- Medical Imaging/Scanners
- Notebook and Laptop
- Smart Tv�s/Holo Tv�s
- Others
Holographic display market, by Application:
- Commercial applications
- Consumer applicaitons
- Industrial applications
- Medical
- Defense
- Other
Holographic display market, by Region:
- North America
- Europe
- Asia Pacific (APAC)
- Rest of the World (RoW)
Recent Developments
- In July 2014, Eon Reality (US) released a new version of Eon Creator and Eon Experience Player. This new version can access 7,000 3D assets of the EON Experience Portal Library. It has a new user interface for best possible user experience and for knowledge transfer and classroom functionality.
- In June 2014, Konica Minolta, (Japan) acquired Ergo Asia Pty Limited (Australia). Ergo is a marketing production management services provider in Asia. Konica Minolta acquired all shares of Ergo. Ergo has its global headquarters in Sydney, Australia.
- In October 2014, AV concepts (US) partnered with Oracle Corporation (US) and Salesforce.com (U.S.). Oracle and Salesforce selected AV concepts as their audio-visual staging partner. Under this partnership, AV Concepts delivered both Oracle and Salesforce breakout sessions at their conference.
Critical Questions the Report Answers:
- Where will all these developments take the industry in the mid to long term?
- What are the emerging application areas that are expected to adopt holographic displays?
- Which product type is expected to penetrate significantly in the market?
- Which region is the most opportunistic for display manufacturers in the market?
To speak to our analyst for a discussion on the above findings, click Speak to Analyst
 Exclusive indicates content/data unique to MarketsandMarkets and not available with any competitors.
Table of Contents
1 Introduction (Page No-14)
1.1 Objectives of The Study
1.2 Market Definition
1.3 Study Scope
1.3.1 Markets Covered
1.3.2 Geographic Scope
1.3.3 Years Considered For The Study
1.4 Currency
1.5 Limitations
1.6 Stakeholders
2 Research Methodology (Page No-18)
2.1 Holographic Displays Demand Model
2.2 Market Size Estimation
2.3 Market Breakdown and Data Trangulation
2.4 Market Share Estimation
2.4.1 Key Points From Secondary Sources
2.4.2 Key Data From Primary Sources
2.4.2.1 Key Industry Insights
2.5 Assumptions
3 Executive Summary (Page No-25)
4 Premium Insights (Page No-28)
4.1 Attractive Market Opportunities For Holographic Display
4.2 The Holographic Display Market � Top Three Product Segments
4.3 The Market in The Asia-Pacific Region
4.4 Asia-Pacific is Expected To Emerge As The Fastest Growing Market At A Cagr of 31.26%
4.5 The Market : Application (2020)
4.6 Market: Developed Vs Developing Nations
4.7 Global Market: Industrial and Commercial Sectors (2020)
4.8 Life Cycle Analysis of The Market, by Geography
5 Market Overview (Page No-35)
5.1 Introduction
5.2 Market Definition
5.3 Evolution
5.4 Market Segmentation
5.4.1 Market by Technology
5.4.2 Market by Product Type
5.4.3 Market by Application
5.4.4 Market by Geography
5.5 Market Dynamics
5.5.1 Drivers
5.5.1.1 Adoption of Holographic Displays In Multiple Industries
5.5.1.2 Increased Demand of Holographic Displays in Events and Advertisements
5.5.1.3 Holography For Medical Imaging in The Healthcare Industry
5.5.2 Restraints
5.5.2.1 Less Effective Projection Under Sunlight
5.5.2.2 Cost Affecting The Growth of Holographic Displays in The Consumer Application
5.5.3 Opportunities
5.5.3.1 Advancements in Holographic Displays
5.5.3.2 Rapidly Advancing Smartphone and Tablet Market
5.5.4 Challenges
5.5.4.1 Technological Concerns
6 Industry Analysis (Page No-46)
6.1 Introduction
6.2 Value Chain Analysis
6.3 Supply Chain Analysis
6.3.1 Key Influencers
6.4 Industry Trends
6.5 Strategic Benchmarking
6.5.1 Inorganic Growth Strategies Such As Acquisitions, Partnerships, and Collaborations
7 Holographic Display Market, by Technology (Page No-51)
7.1 Introduction
7.1.1 Semi Transparent/Electro Holographic Display
7.1.2 Touchable
7.1.3 Laser
7.1.4 Piston
8 Market by Product Type (Page No-58)
8.1 Introduction
8.2 Camera
8.3 Digital Signage
8.4 Kiosks
8.5 Medical Imaging/Scanners
8.5.1 Computed Tomography (Ct) and Magnetic Resonance Imaging (Mri)
8.5.2 Ultrasound
8.6 Notebook and Laptop
8.7 Smart Tv�s/Holo Tv�s
8.8 Others
8.8.1 Smart Watch
8.8.2 Smart Glasses
8.8.3 Smartphones
9 Market by Application (Page No-70)
9.1 Introduction
9.2 Consumer Applications
9.3 Commercial Applications
9.4 Medical
9.5 Defense
9.6 Industrial Applications
9.7 Other Applications
9.7.1 Education
9.7.2 Automobile
10 Geographic Analysis (Page No-82)
10.1 Introduction
10.2 North America
10.2.1 The U.S.
10.2.2 Canada
10.2.3 Mexico
10.3 Europe
10.3.1 Germany
10.3.2 The U.K.
10.3.3 France
10.3.4 Spain
10.3.5 Rest of Europe
10.4 APAC
10.4.1 China
10.4.2 Japan
10.4.3 India
10.4.4 South Korea
10.4.5 Rest of Asia-Pacific
10.5 Rest of The World (ROW)
10.5.1 The Middle East & Africa
10.5.2 Israel
11 Competitive Landscape (Page No-115)
11.1 Overview
11.2 Competitive Situation and Trends
11.2.1 New Product Launches
11.2.2 Agreements, Partnerships, Collaborations, and Joint Ventures
11.2.3 Mergers and Acquisitions
11.2.4 Other Developments
12 Company Profiles (Page No-125)
(Overview, Products and Services, Financials, Strategy & Development)*
12.1 Av Concepts
12.2 Eon Reality
12.3 Holoxica Limited
12.4 Konica Minolta, INC.
12.5 Musion Das Hologram LTD.
12.6 Qualcomm Incorporated
12.7 Provision Holding, INC.
12.8 Realview Imaging LTD.
12.9 Viewsonic Corporation
12.1 Zebra Imaging
*Details On Overview, Products and Services, Financials, Strategy & Development Might Not Be Captured in Case of Unlisted Companies.
13 Appendix (Page No-146)
13.1 Insights of Industry Experts
13.2 Discussion Guide
13.3 Introducing Rt: Real Time Market Intelligence
13.4 Available Customizations
13.5 Related Reports
List of Tables (81 Tables)
Table 1 Medical Imaging is Expected To Drive The Growth of The Market
Table 2 High Cost May Obstruct The Growth of The Market
Table 3 The Advancement in The Hologrpahic Display Technoloy is Expected To Increase The Demand in The Future
Table 4 Global Market Size, by Technology, 2013-2020 ($Million)
Table 5 Global Semi�Transparent Market Size, by Product Type, 2013-2020, ($Million)
Table 6 Global Touchable Market Size by Product Type, 2013-2020 ($Million)
Table 7 Global Laser/Plasma Holographic Display Size by Product Type, 2013-2020 ($Million)
Table 8 Gobal Piston Market Size by Product Type, 2013-2020 ($Thousand)
Table 9 Camera Market Size , by Technology, 2013 � 2020 ($Thousand)
Table 10 Camera Market Size , by Application 2013 � 2020 ($Thousand)
Table 11 Digital Signage Market Size, by Technology, 2013 � 2020 ($Million)
Table 12 Digital Signage Market Size, by Application, 2013 � 2020 ($Million)
Table 13 Kiosk Holographic Display Size, by Technology,2013 � 2020 ($Million)
Table 14 Kiosk Market Size, by Application,2013� 2020 ($Million)
Table 15 Medical Scanner Holographic Display Size, by Technology, 2013 � 2020 ($Million)
Table 16 Medical Scanner Market Size by Application, 2013 � 2020 ($Million)
Table 17 Notebook Market Size, by Technology, 2013 � 2020 ($Million)
Table 18 Notebook Market Size, by Application, 2013 � 2020 ($Million)
Table 19 Smart Tv Market Size, by Technology, 2013 � 2020 ($Thousand)
Table 20 Smart Tv Market Size, by Application, 2013 � 2020 ($Thousand)
Table 21 Other Product Market Size, by Technology, 2013 � 2020 ($Thousand)
Table 22 Other Product Market Size, by Application, 2013 � 2020 ($Thousand)
Table 23 Market Size For The Consumer Application, by Product Type, 2013 � 2020 ($Million)
Table 24 Global Market Size For Consumer Application,by Geography, 2013 � 2020 ($Million)
Table 25 Market Size For The Commercial Application, by Product Type, 2013 � 2020 ($Million)
Table 26 Global Market Size For Commercial Application, by Geography, 2013 � 2020 ($Million)
Table 27 Market Size For The Medical Application,by Product Type, 2013 � 2020 ($Million)
Table 28 Global Market Size For The Medical Application, by Geography, 2013 � 2020 ($Million)
Table 29 Market Size For Defence Application, by Product Type, 2013 � 2020 ($Million)
Table 30 Global Market Size For The Defense Application, by Geography, 2013 � 2020 ($Million)
Table 31 Market Size For The Industrial Application, by Product Type, 2013 � 2020 ($Million)
Table 32 Global Market Size For Industrial Application, by Geography, 2013 � 2020 ($Million)
Table 33 Market Size For The Others Application,by Product Type, 2013 � 2020 ($Million)
Table 34 Global Market Size For The Others Application, by Geography, 2013 � 2020 ($Million)
Table 35 North America Market Size, by Application, 2013�2020 ($Million)
Table 36 North America Market Size, by Country, 2013 � 2020 ($Million)
Table 37 North America Market Size For Consumer Application, by Country, 2013 � 2020 ($Million)
Table 38 North America Market Size For Commercial Application, by Geography, 2013 � 2020 ($Million)
Table 39 North America Market Size For Medical Application, by Country, 2013 � 2020 ($Million)
Table 40 North America Market Size For The Defense Application, by Country, 2013 � 2020 ($Million)
Table 41 North America Market Size For The Industrial Application, by Country, 2013 � 2020 ($Million)
Table 42 The U.S. Market Size, by Application, 2013 � 2020 ($Million)
Table 43 Canada Market Size, by Application, 2013 � 2020 ($Million)
Table 44 Mexico Market Size, by Application, 2013 � 2020 ($Thousand)
Table 45 Europe Market Size, by Application, 2013 � 2020 ($Million)
Table 46 Europe Market Size, by Country, 2013 � 2020 ($Million)
Table 47 Europe Market Size For Consumer Application, by Country, 2013 � 2020 ($Thousand)
Table 48 Europe Market Size For Commercial Application, by Country, 2013 � 2020 ($Thousand)
Table 49 Europe Market Size For Medical Application, by Country, 2013 � 2020 ($Thousand)
Table 50 Europe Market Size For Defense, by Country, 2013 � 2020 ($Thousand)
Table 51 Europe Market Size For The Industrial Application, by Country, 2013 � 2020 ($Thousand)
Table 52 Germany Market Size, by Application, 2013 � 2020 ($Million)
Table 53 The U.K. Market Size, by Application, 2013 � 2020 ($Million)
Table 54 France Market Size, by Application, 2013 � 2020 ($Thousand)
Table 55 Spain Market Size, by Application, 2013 � 2020 ($Thousand)
Table 56 Rest of Europe Market Size, by Application, 2013 � 2020 ($Thousand)
Table 57 APAC Market Size, by Application, 2013 � 2020 ($Million)
Table 58 APAC Market Size For Consumer Application,by Country, 2013 � 2020 ($Million)
Table 59 APAC Market Size For Commercial Application, by Country, 2013 � 2020 ($Million)
Table 60 APAC Market Size For Medical Application, by Country, 2013 � 2020 ($Million)
Table 61 APAC Market Size For Defense Application, by Country, 2013 � 2020 ($Million)
Table 62 APAC Market Size For Industrial Application, by Country, 2013 � 2020 ($Million)
Table 63 China Market Size, by Application, 2013 � 2020 ($Million)
Table 64 Japan Market Size, by Application, 2013 � 2020 ($Million)
Table 65 India Market Size, by Application, 2013 � 2020 ($Million)
Table 66 South Korea Market Size, by Application, 2013 � 2020 ($Million)
Table 67 Rest of Asia Pacific Market Size, by Application, 2013 � 2020 ($Million)
Table 68 ROW Market Size, by Application, 2013 � 2020 ($Million)
Table 69 ROW Market Size, by Country, 2013 � 2020 ($Million)
Table 70 ROW Market Size For Consumer Application, by Country, 2013 � 2020 ($Thousand)
Table 71 ROW Market Size For Commercial Application, by Country, 2013 � 2020 ($Thousand)
Table 72 ROW Market Size For The Medical Application, by Country, 2013 � 2020 ($Thousand)
Table 73 ROW Market Size For Defense Application, by Country, 2013 � 2020 ($Thousand)
Table 74 ROW Market Size For Industrial Application, by Country, 2013 � 2020 ($Thousand)
Table 75 Middle East & Africa Market Size, by Application, 2013 � 2020 ($Million)
Table 76 Israel Market Size, by Application, 2013 � 2020 ($Million)
Table 77 Some of The Prominent Companies In The Market
Table 78 New Product Launches, 2013 - 2014
Table 79 Agreements, Partnerships, Collaborations, and Joint Ventures, 2013 - 2014
Table 80 Mergers and Acquisitions, 2014
Table 81 Other Developments, 2014
List of Figures (43 Figures)
Figure 1 Markets Covered
Figure 2 Holographic Display Market : Research Methodology
Figure 3 Market Size Estimation Methodology: Bottom-Up Approach
Figure 4 Market Size Estimation Methodology: Top-Down Approach
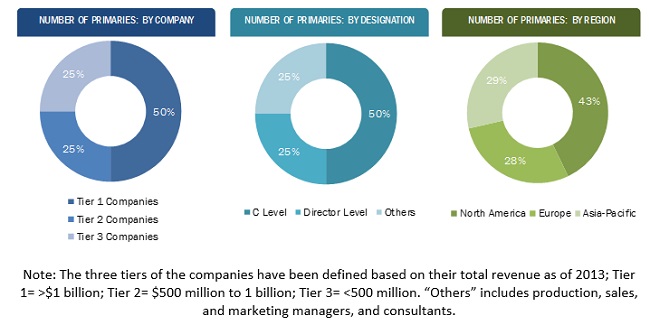
Figure 5 Breakdown of Primary Interviews: by Company Type, Designation, and Region
Figure 6 The Medical Application is Expected To Grow At The Highest Cagr With The Highest Market Size
Figure 7 Holographic Displays, by Product Type: Snapshot
Figure 8 Market, by Geography: Snapshot
Figure 9 Touchable and Laser Holographic Display Are Expected To Grow At The Higher Rate
Figure 10 Medical Scanners Are Expected To Grow At The Fastest Rate Among The Top Three Products in The Market
Figure 11 Medical Scanners Accounted For The Maximum Share in The Emerging APAC Market
Figure 12 In APAC, China and Japan Are Estimated To Emerge As The Fastest Growing Market
Figure 13 Medical and Commercial Sectors May Continue To Dominate The North American Market From 2014 To 2020
Figure 14 Developing Markets Expected To Grow Faster Than The Developed Ones
Figure 15 The Industrial Segment Has A Promising Future in Emerging Economies of APAC
Figure 16 Evolution: Holographic Display Technology
Figure 17 Market Segmentation: by Technology
Figure 18 Market Segmentations: by Product
Figure 19 Market Segmentation: by Application
Figure 20 Market Segmentation: by Geography
Figure 21 Increased R&D and Application in The Healthcare Industry Will Increase The Demand For The Market
Figure 22 Value Chain Analysis (2013): Major Value Addition is Done During Manufacturing and Assembling Phases
Figure 23 Supply Chain of Major Players in The Market
Figure 24 Key Industry Trends in The Market
Figure 25 Strategic Benchmarking: Av Concepts Partnered With Magnetic Collaborative, Hologramica
Figure 26 Market Segmentation, by Technology
Figure 27 Semi Transparent Technology Accounted For The Highest Market Share in 2014
Figure 28 Holographic Display Market, by Product Type
Figure 29 Medical Imaging Accounted For The Largest Share For The Market in 2014
Figure 30 Market Segmentation, by Application
Figure 31 The Holographic Display Was Dominated by Medical Applications in 2013
Figure 32 Geographic Snapshot (2014) - The Rapidly Growing Markets Are Emerging As New Hot Spots
Figure 33 Country - Wise Growth For The Holographic Display Applications Segment
Figure 34 The North American Market Snapshot: Demand Will Be Driven by The Requirement of Advanced Medical Equipment
Figure 35 Asia-Pacific Market Snapshot � China is The Most Lucrative Market
Figure 36 APAC Market Size, by Country, 2013 � 2020 ($Million)
Figure 37 Companies Adopted Partnerships and Agreements As Key Growth Strategies (2012 - 2014)
Figure 38 Market Evaluation Framework - A Significant Product Development Through Partnerships Has Fueled Growth and Innovation, 2014
Figure 39 Battle For The Market Share: New Product Launches Was The Key Strategy
Figure 40 Eon Reality: SWOT Analysis
Figure 41 Konica Minolta: Business Overview
Figure 42 Qualcomm Incorporated: Business Overview
Figure 43 Zebra Imaging: SWOT Analysis
The study involved 4 major activities to estimate the current size of the holographic display market. Exhaustive secondary research was done to collect information on the market, the peer markets, and the parent market. The next step was to validate these findings, assumptions, and sizing with industry experts across the value chain through primary research. Both top-down and bottom-up approaches were employed to estimate the complete market size. Thereafter, market breakdown and data triangulation were used to estimate the market size of segments and subsegments.
Secondary Research
Secondary research has been conducted to obtain key information about the industry�s supply chain, market�s monetary chain, total pool of key players, and market segmentation according to industry trends to the bottom-most level, geographic markets, and key developments from both market- and technology-oriented perspectives. The secondary data has been collected and analyzed to arrive at the overall market size, which has further been validated by primary research.
Primary Research
In the primary research process, various primary sources from both the supply and demand sides have been interviewed to obtain the qualitative and quantitative information relevant to this report. Primary sources from the supply side include key industry participants, subject matter experts (SMEs), C-level executives of key companies, and consultants from various key companies and organizations operating in the ecosystem of the holographic display market. Several primary interviews have been conducted with key opinion leaders from both demand- and supply-side vendors across 4 regions: North America, Europe, and Asia Pacific (APAC). After the complete market engineering (including calculations for market statistics, market breakdown, market size estimations, market forecasting, and data triangulation), extensive primary research has been conducted to verify and validate the critical market numbers.
To know about the assumptions considered for the study, download the pdf brochure
Market Size Estimation
Both top-down and bottom-up approaches were implemented to estimate and validate the total size of the holographic display market. These methods were also used extensively to estimate the size of the markets based on various subsegments. The research methodology used to estimate the market size includes the following steps:
- The key players in the industry and markets have been identified through extensive secondary research.
- The industry�s supply chain and market size, in terms of value, have been determined through primary and secondary research.
- All percentage shares, splits, and breakdowns have been determined using secondary sources and verified through primary sources.
Data Triangulation
After arriving at the overall market size from the market size estimation process explained above, the total market has been split into several segments and subsegments. To complete the overall market engineering process and arrive at the exact statistics for all segments and subsegments, data triangulation and market breakdown procedures have been employed, wherever applicable. The data has been triangulated by studying various factors and trends in both demand and supply sides. Along with this, the market has been validated using both top-down and bottom-up approaches.
Study Objectives
- To define, describe, and forecast the global holographic display market on the basis of technology, product type, component, and application
- To forecast the market size in terms of value for various segments, with regards to four main regions- North America, Europe, Asia-Pacific, and RoW
- To provide detailed information regarding major factors influencing the growth of the market (drivers, restraints, opportunities, industry specific challenges, winning imperatives, and burning issues)
- To strategically analyze micro-markets with respect to individual growth trends, future prospects, and contribution to the total market
- To analyze opportunities in the market for stakeholders, by identifying high growth segments of the global holographic display market
- To strategically profile key players and comprehensively analyze their market share and core competencies along with, detailing the competitive landscape for market leaders
- To track and analyze competitive developments such as joint ventures, mergers and acquisitions, new product developments, and research and development in the global holographic display market
Available Customizations
With the given market data, MarketsandMarkets offers customizations according to the company's specific needs. The following customization options are available for this report:
Product Analysis
- Product matrix, which gives a detailed comparison of the product portfolio of each company
Geographic Analysis
- Further breakdown of the Rest of Asia-Pacific holographic display market into Australia, New Zealand, and others
- Further breakdown of the South American holographic display market into Brazil, Argentina, and Rest of South America
Company Information
- Detailed analysis and profiling of additional market players (Up to five).


Growth opportunities and latent adjacency in Holographic Display Market