Hyperspectral Imaging System Market by Product (Camera, Accessories), Technology (Snapshot, Push broom), Application (Military, Remote Sensing (Agriculture, Mining, Environmental), Machine Vision, Life Sciences & Diagnostic) - Global Forecast to 2027
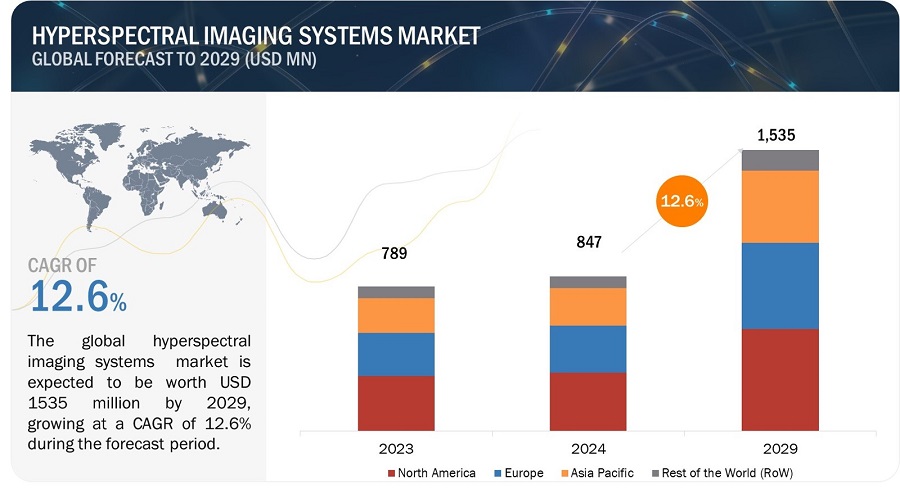
[245 Pages Report] The global hyperspectral imaging system market is projected to reach USD 42.3 billion by 2027 from USD 18.1 billion in 2022, at a CAGR of 18.5%. The growing industrial applications of hyperspectral imaging and increasing funding and investments are the major factors driving the growth of the global hyperspectral imaging systems market. However, data storage challenges and the high costs associated with the use of hyperspectral imaging are expected to restrain the growth of this market during the forecast period.
To know about the assumptions considered for the study, Request for Free Sample Report
Global Hyperspectral Imaging System Market Dynamics
DRIVER: Growing industrial applications of hyperspectral imaging
Over the years, there have been significant advancements in spectrographs and detector designs, which have resulted in decreased costs and improved instrumentation capabilities. As a result, HSI is increasingly being used in various application areas. Unlike conventional cameras, hyperspectral cameras acquire a 3D image cube and spectral information, which is appropriate for any situation where images have to encompass a large area and encode a great deal of information within a single view. Initially, HSI was developed for remote sensing applications such as satellite imaging of the earth. However, with technological advancements, HSI has become compact, economically priced, and better suited for use in diverse fields, such as agriculture, pharmaceuticals, food testing, medical diagnostics, art research, and waste management.
RESTRAINTS: Data storage challenges and high costs
HSI is a complex process that involves a huge amount of data and thus requires large storage space and enhanced software technologies to analyze data in a shorter time frame. Although HSI has immense potential for various applications, the high cost of the equipment and manufacturing processes and the requirement of large volumes of data for acquisition and processing are limiting its adoption for real-time commercial purposes. For example, the OCI-2000 Snapshot Handheld Hyperspectral Imager and OCI UAV Airborne Hyperspectral Camera by BaySpec cost around USD 23,000 and USD 25,000, respectively.
OPPORTUNITY: Untapped market opportunities in emerging markets
Emerging economies in Asia and Latin America are expected to offer significant growth opportunities for players in the HSI systems market. For instance, in China, a number of hyperspectral sensors were designed and launched to meet the rising demand for precise and fast mapping of natural resources using remote sensing applications. In September 2019, China launched five new remote sensing satellites under the project Zhuhai-1, which comprises 34 micro-nano satellites, including video, HSI, and high-resolution optical satellites, as well as radar and infrared satellites. Furthermore, in May 2018, China launched Gaofen-5 (GF-5), a remote sensing HSI satellite for atmospheric research.
India has also opened up opportunities for collaborations with other countries. For instance, Bharat Rohan Airborne Innovations is aimed to promote scientific research in India for various applications of HSI and remote sensing. Bharat Rohan, in partnership with BaySpec, offers hyperspectral/multispectral imagers that are ultra-compact, easily deployable, and offer high-performance. Moreover, in November 2018, the Indian Space Research Organisation (ISRO) launched the first Indian Hyperspectral Imaging Satellite (HySIS). This satellite will be used for Earth observation in applications related to agriculture, forestry, geology, assessment of coastal zones, and environmental studies.
CHALLENGE: Attaining super-resolution in a cost effective manner
HSI is an emerging technique used by researchers for broad application areas, such as aerial and space imagery, agriculture, ecology, geology, medicine, and industrial inspection. Although the resolution of a hyperspectral image is high in the spectral domain, it has a limited resolution in the spatial domain. Hyperspectral image quality is affected by various factors, such as atmospheric scattering, secondary illumination, and sensor noise. Therefore, it is essential to improve spatial resolution for the better utilization of this technique for various applications. Since changes in hardware (hyperspectral camera units) prove to be expensive, bringing in improvements in spatial resolution through software is a major challenge currently faced by market players.
The agriculture segment dominated the hyperspectral imaging system market for remote sensing in 2020.
Remote sensing applications are categorized as agriculture, mining/mineral mapping, environmental monitoring, and other remote sensing applications. The agriculture segment accounted for the largest share of the hyperspectral imaging systems market for remote sensing in 2020. The large share of the agriculture segment is due to the fact that crop monitoring with hyperspectral data can help in the detection of invasive plant species, plant diseases, and insect infestations, which further aids the decision-making process of herbicide/pesticide application, thereby maximizing the cost-benefit ratio.
The snapshot segment to witness the highest CAGR during the forecast period.
Based on technology, the hyperspectral imaging system market is segmented into pushbroom (line-scanning), snapshot (single shot), and other technologies [whiskbroom (point scanning), tunable filters (wavelength scanning), and imaging FTIR (time scanning)]. The snapshot segment is projected to register the highest growth rate in the hyperspectral imaging systems market during the forecast period. This can be attributed to the advantages offered by snapshot hyperspectral imaging systems, which make this technology most suitable for real-time analysis situations. Moreover, government funding and a growing number of product launches are further supporting the growth of this market.
To know about the assumptions considered for the study, download the pdf brochure
Japan is anticipated to account the largest share of APAC Hyperspectral Imaging System Market
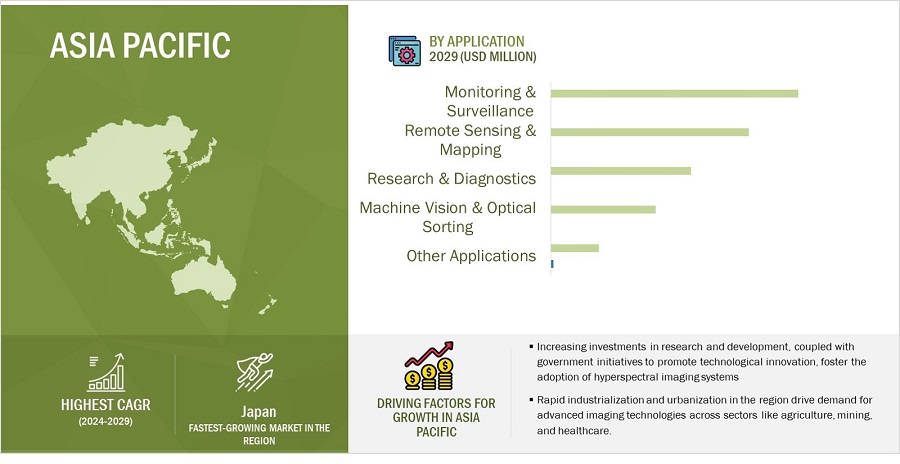
Based on the APAC region, the Hyperspectral Imaging Systems Market is divided into Japan, China, India and ROAPAC. Japan is expected to account the largest share of Market. The increasing adoption of hyperspectral imaging systems in research, defence, and commercial industries (remote sensing, healthcare, and life sciences, among others) is contributing to the growth of this market. The country is expected to launch its HISUI (Hyperspectral Imager Suite), developed by the Japanese Ministry of Economy, Trade, and Industry, in January 2020, which is indicative of Japans efforts in this market space.
North America dominates the global Hyperspectral Imaging System Market
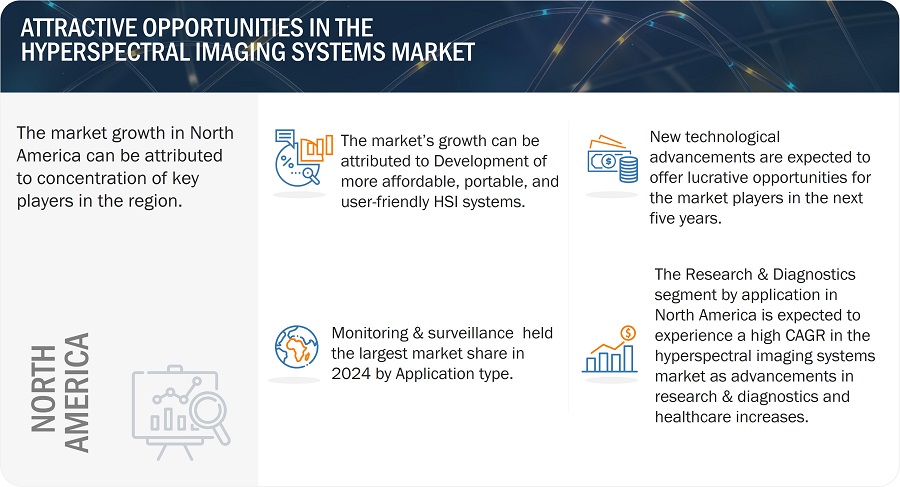
Based on the region, the Hyperspectral Imaging Systems Market is segmented into North America, Europe, Asia Pacific, and Rest of the World (RoW). North America is expected to dominate the Market. Growth in the North American market is mainly driven by, growth in research funding, technological advancements, and increasing awareness of the benefits of hyperspectral imaging in commercial industries across the region
Key Market Players
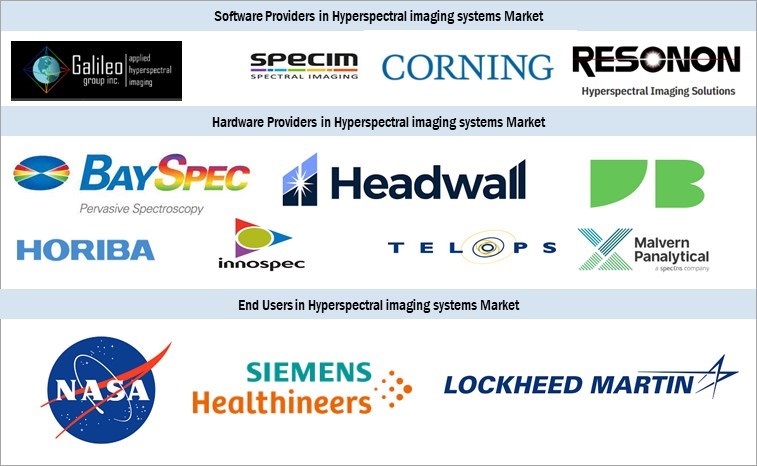
The prominent players operating in this market include Headwall Photonics, Inc. (US), Specim, Spectral Imaging Ltd. (Finland), Norsk Elektro Optikk AS (Norway), Resonon, Inc. (US), and Corning Incorporated (US).
Get online access to the report on the World's First Market Intelligence Cloud
- Easy to Download Historical Data & Forecast Numbers
- Company Analysis Dashboard for high growth potential opportunities
- Research Analyst Access for customization & queries
- Competitor Analysis with Interactive dashboard
- Latest News, Updates & Trend analysis
Request Sample Scope of the Report
Get online access to the report on the World's First Market Intelligence Cloud
- Easy to Download Historical Data & Forecast Numbers
- Company Analysis Dashboard for high growth potential opportunities
- Research Analyst Access for customization & queries
- Competitor Analysis with Interactive dashboard
- Latest News, Updates & Trend analysis
Report Metric |
Details |
Market size available for years |
20162027 |
Base year considered |
2020 |
Forecast period |
20212027 |
Forecast units |
Value (USD) |
Segments covered |
Product, Technology, Application, and Region |
Geographies covered |
North America, Europe, Asia Pacific, and the Rest of the World |
Companies covered |
Headwall Photonics, Inc. (US), Specim, Spectral Imaging Ltd. (Finland), Corning Incorporated (US), Norsk Elektro Optikk AS (Norway), Resonon Inc. (US), Telops (Canada), Surface Optics Corporation (US), CytoViva, Inc. (US), Applied Spectral Imaging Ltd. (US), Raytheon Company (US), ChemImage Corporation (US), Cubert GmbH (Germany), BaySpec, Inc. (US), Glana Sensors AB (Sweden), Inno-Spec GmbH (Germany), Clyde HSI (Scotland), Imec (Belgium), Brandywine Photonics (US), XIMEA (Germany), Photon etc. (Canada), Gamaya (Switzerland), Hinalea Imaging (US), Diaspective Vision GmbH (Germany), Orbital Sidekick (US), and HyperMed Imaging, Inc. (US) |
This report categorizes the hyperspectral imaging system market into the following segments and subsegments:
By Product
- Cameras
- Accessories
By Technology
- Push broom
- Snapshot
- Other Technologies [whiskbroom (point scanning), tunable filters (wavelength scanning), and imaging FTIR (time scanning)]
By Application
- Military Surveillance
- Remote Sensing
- Agriculture
- Mining/mineral mapping
- Environmental monitoring
- Other remote sensing applications (Forensics, cosmetics, document preservation, and infrastructure evaluation)
- Life Sciences & Medical Diagnostics
- Machine Vision & Optical sorting
- Other Applications (Colorimetry, meteorology, thin-film manufacturing, and night vision)
By Region
- North America
- US
- Canada
- Europe
- Germany
- France
- UK
- Italy
- Spain
- RoE
- Asia Pacific
- Japan
- China
- India
- Rest of Asia Pacific
- Rest of the World
- Latin America
- Middle East & Africa
Recent Developments
- In 2021, Resonon, Inc. (US) introduced Pika NUV2 Camera, which covers a spectral range of 330-800 nm and is the only commercially available hyperspectral imager that scans ultraviolet light.
- In 2021, Headwell Photonics (US) collaborated with NSF Engineering Research Center (US), which aids in enhancing sensor development and deployment in the field of precision agriculture.
- In 2021, Resonon, Inc. (US) partnered with National Aeronautics and Space Administration (NASA, US), which is aimed to create a new lunar calibration standard. Resonon will collaborate on the design, build, calibration, and validation of the spaceflight instrument.
Frequently Asked Questions (FAQs):
What is the impact of COVID-19 on the hyperspectral imaging system market?
The pandemic is expected to have a short-term impact on the global hyperspectral imaging systems market. With several countries across the globe announcing nationwide lockdowns and temporary closure of various industries, production and manufacturing were severely affected. The pandemic is not expected to have a very severe, long-term impact on the market. The short-term negative impact is mainly caused due to mobility restrictions or staff safety restrictions. However, businesses will return to normalcy once restrictions are lifted.
Who are the key players in the hyperspectral imaging systems market?
The prominent players operating in this market include Headwall Photonics, Inc. (US), Applied Spectral Imaging, Inc. (US), Corning Incorporated (US), Surface Optics Corporation (US), Norsk Elektro Optikk AS (Norway), Resonon, Inc. (US), Specim, Spectral Imaging Ltd. (Finland), Telops, Inc. (Canada), BaySpec, Inc. (US), Cubert GmbH (Germany), Inno-Spec GmbH (Germany), XIMEA GmbH (Germany), Imec (Belgium), and ChemImage Corporation (US).
Which product dominates in the hyperspectral imaging system market?
Cameras commanded the largest share of the hyperspectral imaging systems market in 2020, and this trend is expected to continue during the forecast period. Technological advancements, the development of affordable hyperspectral imaging cameras, and the increasing adoption of hyperspectral technology for defense and industrial applications are driving the growth of the hyperspectral cameras segment.
What factors are driving the hyperspectral imaging system market?
Market growth can largely be attributed to factors such as increasing funding and investments in this field and the growing industrial applications of hyperspectral imaging.
What is the market for global hyperspectral imaging systems?
The global hyperspectral imaging system market is projected to reach USD 42.3 billion by 2027 from USD 18.1 billion in 2022, at a CAGR of 18.5% during the forecast period. .
To speak to our analyst for a discussion on the above findings, click Speak to Analyst
TABLE OF CONTENTS
1 INTRODUCTION (Page No. - 36)
1.1 OBJECTIVES OF THE STUDY
1.2 MARKET DEFINITION
1.2.1 INCLUSIONS & EXCLUSIONS OF THE STUDY
1.2.2 MARKET SCOPE
FIGURE 1 HYPERSPECTRAL IMAGING SYSTEM MARKET SEGMENTATION
1.2.3 YEARS CONSIDERED FOR THE STUDY
1.3 CURRENCY
1.4 LIMITATIONS
1.5 STAKEHOLDERS
1.6 SUMMARY OF CHANGES
2 RESEARCH METHODOLOGY (Page No. - 40)
2.1 RESEARCH DATA
FIGURE 2 RESEARCH DESIGN
2.1.1 SECONDARY DATA
2.1.1.1 Secondary sources
2.1.2 PRIMARY DATA
FIGURE 3 PRIMARY SOURCES
2.1.2.1 Key data from primary sources
2.1.2.2 Key industry insights
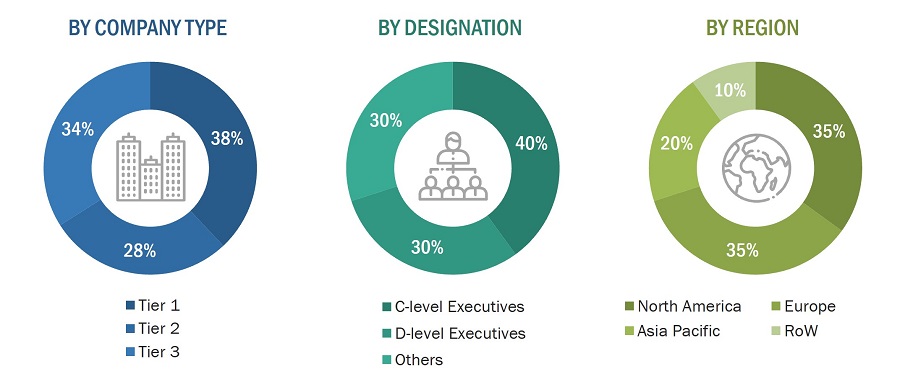
FIGURE 4 BREAKDOWN OF PRIMARY INTERVIEWS: BY COMPANY TYPE, DESIGNATION, AND REGION
2.2 MARKET SIZE ESTIMATION AND METHODOLOGY
FIGURE 5 RESEARCH METHODOLOGY: HYPOTHESIS BUILDING
2.2.1 PRIMARY-BASED MARKET ESTIMATION
FIGURE 6 MARKET SIZE ESTIMATION: TOP-DOWN APPROACH
2.2.2 GROWTH FORECAST
FIGURE 7 CAGR PROJECTIONS: SUPPLY-SIDE ANALYSIS
2.3 MARKET BREAKDOWN AND DATA TRIANGULATION
FIGURE 8 DATA TRIANGULATION METHODOLOGY
2.4 ASSUMPTIONS FOR THE STUDY
2.4.1 COVID-19-SPECIFIC ASSUMPTIONS
2.5 RISK ASSESSMENT
2.6 GROWTH RATE ASSUMPTIONS
2.7 COVID-19 ECONOMIC ASSESSMENT
2.8 ASSESSMENT OF THE IMPACT OF COVID-19 ON THE ECONOMIC SCENARIO
FIGURE 9 CRITERIA IMPACTING THE GLOBAL ECONOMY
FIGURE 10 RECOVERY SCENARIO OF THE GLOBAL ECONOMY
3 EXECUTIVE SUMMARY (Page No. - 53)
FIGURE 11 HYPERSPECTRAL IMAGING SYSTEM MARKET, BY PRODUCT, 2021 VS. 2026 (USD BILLION)
FIGURE 12 HYPERSPECTRAL IMAGING SYSTEMS MARKET, BY TECHNOLOGY, 2021 VS. 2026 (USD BILLION)
FIGURE 13 GLOBAL MARKET, BY APPLICATION, 2021 VS. 2026 (USD BILLION)
FIGURE 14 GLOBAL MARKET FOR REMOTE SENSING APPLICATIONS, BY TYPE, 20212026 (USD BILLION)
FIGURE 15 GEOGRAPHICAL SNAPSHOT OF THE GLOBAL MARKET
4 PREMIUM INSIGHTS (Page No. - 57)
4.1 HYPERSPECTRAL IMAGING SYSTEM MARKET OVERVIEW
FIGURE 16 GROWING INDUSTRIAL APPLICATIONS OF HYPERSPECTRAL IMAGING TO DRIVE MARKET GROWTH DURING THE FORECAST PERIOD
4.2 ASIA PACIFIC: HYPERSPECTRAL IMAGING SYSTEMS MARKET, BY APPLICATION AND COUNTRY (2021)
FIGURE 17 MILITARY SURVEILLANCE SEGMENT IS ESTIMATED TO ACCOUNT FOR THE LARGEST MARKET SHARE IN 2021
4.3 GLOBAL MARKET FOR REMOTE SENSING APPLICATIONS, BY TYPE, 20212026
FIGURE 18 AGRICULTURE SEGMENT TO WITNESS THE HIGHEST GROWTH DURING THE FORECAST PERIOD
4.4 GLOBAL MARKET: GEOGRAPHIC GROWTH OPPORTUNITIES
FIGURE 19 CHINA TO REGISTER THE HIGHEST GROWTH DURING THE FORECAST PERIOD
5 MARKET OVERVIEW (Page No. - 60)
5.1 INTRODUCTION
5.2 MARKET DYNAMICS
FIGURE 20 HYPERSPECTRAL IMAGING SYSTEM MARKET: DRIVERS, RESTRAINTS, OPPORTUNITIES, AND CHALLENGES
5.2.1 DRIVERS
5.2.1.1 Increasing funding and investments
TABLE 1 RECENT FUNDING INITIATIVES IN THE HYPERSPECTRAL IMAGING SYSTEMS MARKET
5.2.1.2 Growing industrial applications of hyperspectral imaging
5.2.1.3 Increasing need for remote sensing data in a wide range of defense/homeland security operations and commercial applications
5.2.2 RESTRAINTS
5.2.2.1 Data storage challenges and high costs
5.2.3 OPPORTUNITIES
5.2.3.1 Untapped market opportunities in emerging countries
5.2.4 CHALLENGES
5.2.4.1 Attaining super-resolution in a cost-effective manner
5.3 REGULATORY LANDSCAPE
5.3.1 US
TABLE 2 US: CLASSIFICATION OF IMAGING INSTRUMENTS
TABLE 3 US: TIME, COST, AND COMPLEXITY OF THE REGISTRATION PROCESS
5.3.2 EUROPE
TABLE 4 EUROPE: LEVEL OF RISK, TIME, COST, AND COMPLEXITY OF THE REGISTRATION PROCESS
TABLE 5 EUROPE: CLASSIFICATION OF IMAGING INSTRUMENTS
5.4 COVID-19 IMPACT ON THE GLOBAL MARKET
5.5 RANGES/SCENARIOS
5.5.1 GLOBAL MARKET
FIGURE 21 PESSIMISTIC SCENARIO
FIGURE 22 OPTIMISTIC SCENARIO
FIGURE 23 REALISTIC SCENARIO
5.6 TECHNOLOGY ANALYSIS
5.7 PRICING ANALYSIS
TABLE 6 PRICE RANGE OF HYPERSPECTRAL IMAGING SYSTEMS, BY PRODUCT
5.8 TRADE ANALYSIS
TABLE 7 IMPORT DATA FOR SPECTROMETERS, SPECTROPHOTOMETERS, AND SPECTROGRAPHS USING OPTICAL RADIATIONS, BY COUNTRY, 2016-2020 (USD MILLION)
TABLE 8 EXPORT DATA FOR SPECTROMETERS, SPECTROPHOTOMETERS, AND SPECTROGRAPHS USING OPTICAL RADIATIONS, BY COUNTRY, 2016-2020 (USD MILLION)
5.9 PATENT ANALYSIS
5.10 VALUE CHAIN ANALYSIS
FIGURE 24 VALUE CHAIN ANALYSIS: MAJOR VALUE IS ADDED DURING THE MANUFACTURING AND ASSEMBLY PHASE
5.11 SUPPLY CHAIN ANALYSIS
FIGURE 25 DISTRIBUTION: A STRATEGY PREFERRED BY PROMINENT COMPANIES
5.12 HYPERSPECTRAL IMAGING SYSTEMS ECOSYSTEM
FIGURE 26 HYPERSPECTRAL IMAGING SYSTEM ECOSYSTEM ANALYSIS
5.12.1 ROLE IN THE ECOSYSTEM
TABLE 9 ROLE OF KEY PLAYERS IN THE ECOSYSTEM
FIGURE 27 KEY PLAYERS IN THE HYPERSPECTRAL IMAGING SYSTEMS REPORT
5.13 TRENDS/DISRUPTIONS IMPACTING CUSTOMER BUSINESS
5.13.1 REVENUE SHIFT AND REVENUE POCKETS FOR HYPERSPECTRAL IMAGING SYSTEM MANUFACTURERS
FIGURE 28 REVENUE SHIFT FOR THE GLOBAL MARKET
5.14 PORTERS FIVE FORCES ANALYSIS
TABLE 10 PORTERS FIVE FORCES ANALYSIS: HYPERSPECTRAL IMAGING SYSTEMS MARKET
5.14.1 DEGREE OF COMPETITION
5.14.2 BARGAINING POWER OF SUPPLIERS
5.14.3 BARGAINING POWER OF BUYERS
5.14.4 THREAT OF SUBSTITUTES
5.14.5 THREAT OF NEW ENTRANTS
6 HYPERSPECTRAL IMAGING SYSTEM MARKET, BY PRODUCT (Page No. - 80)
6.1 INTRODUCTION
TABLE 11 GLOBAL MARKET, BY PRODUCT, 20162020 (USD MILLION)
TABLE 12 GLOBAL MARKET, BY PRODUCT, 20212026 (USD MILLION)
6.2 CAMERAS
6.2.1 HYPERSPECTRAL IMAGING CAMERAS TO WITNESS THE HIGHEST GROWTH OWING TO THEIR INCREASING APPLICATIONS IN DEFENSE & INDUSTRIAL APPLICATIONS
TABLE 13 HYPERSPECTRAL IMAGING CAMERAS MARKET, BY REGION, 20162020 (USD MILLION)
TABLE 14 HYPERSPECTRAL IMAGING CAMERAS MARKET, BY REGION, 20212026 (USD MILLION)
TABLE 15 NORTH AMERICA: HYPERSPECTRAL IMAGING CAMERAS MARKET, BY COUNTRY, 20162020 (USD MILLION)
TABLE 16 NORTH AMERICA: HYPERSPECTRAL IMAGING CAMERAS MARKET, BY COUNTRY, 20212026 (USD MILLION)
TABLE 17 EUROPE: HYPERSPECTRAL IMAGING CAMERAS MARKET, BY COUNTRY, 20162020 (USD MILLION)
TABLE 18 EUROPE: HYPERSPECTRAL IMAGING CAMERAS MARKET, BY COUNTRY, 20212026 (USD MILLION)
TABLE 19 ASIA PACIFIC: HYPERSPECTRAL IMAGING CAMERAS MARKET, BY COUNTRY, 20162020 (USD MILLION)
TABLE 20 ASIA PACIFIC: HYPERSPECTRAL IMAGING CAMERAS MARKET, BY COUNTRY, 20212026 (USD MILLION)
6.3 ACCESSORIES
6.3.1 INCREASING ADOPTION OF HYPERSPECTRAL IMAGING SYSTEMS TO SUPPORT THE ADOPTION OF ASSOCIATED ACCESSORIES
TABLE 21 HYPERSPECTRAL IMAGING ACCESSORIES MARKET, BY REGION, 20162020 (USD MILLION)
TABLE 22 HYPERSPECTRAL IMAGING ACCESSORIES MARKET, BY REGION, 20212026 (USD MILLION)
TABLE 23 NORTH AMERICA: HYPERSPECTRAL IMAGING ACCESSORIES MARKET, BY COUNTRY, 20162020 (USD MILLION)
TABLE 24 NORTH AMERICA: HYPERSPECTRAL IMAGING ACCESSORIES MARKET, BY COUNTRY, 20212026 (USD MILLION)
TABLE 25 EUROPE: HYPERSPECTRAL IMAGING ACCESSORIES MARKET, BY COUNTRY, 20162020 (USD MILLION)
TABLE 26 EUROPE: HYPERSPECTRAL IMAGING ACCESSORIES MARKET, BY COUNTRY, 20212026 (USD MILLION)
TABLE 27 ASIA PACIFIC: HYPERSPECTRAL IMAGING ACCESSORIES MARKET, BY COUNTRY, 20162020 (USD MILLION)
TABLE 28 ASIA PACIFIC: HYPERSPECTRAL IMAGING ACCESSORIES MARKET, BY COUNTRY, 20212026 (USD MILLION)
7 HYPERSPECTRAL IMAGING SYSTEM MARKET, BY TECHNOLOGY (Page No. - 88)
7.1 INTRODUCTION
TABLE 29 HYPERSPECTRAL IMAGING SYSTEMS MARKET, BY TECHNOLOGY, 20162020 (USD MILLION)
TABLE 30 GLOBAL MARKET, BY TECHNOLOGY, 20212026 (USD MILLION)
7.2 PUSHBROOM
7.2.1 PUSHBROOM TECHNOLOGY SEGMENT DOMINATES THE GLOBAL MARKET
TABLE 31 PUSHBROOM HYPERSPECTRAL IMAGING SYSTEMS MARKET, BY REGION, 20162020 (USD MILLION)
TABLE 32 PUSHBROOM MARKET, BY REGION, 20212026 (USD MILLION)
TABLE 33 NORTH AMERICA: PUSHBROOM MARKET, BY COUNTRY, 20162020 (USD MILLION)
TABLE 34 NORTH AMERICA: PUSHBROOM MARKET, BY COUNTRY, 20212026 (USD MILLION)
TABLE 35 EUROPE: PUSHBROOM MARKET, BY COUNTRY, 20162020 (USD MILLION)
TABLE 36 EUROPE: PUSHBROOM MARKET, BY COUNTRY, 20212026 (USD MILLION)
TABLE 37 ASIA PACIFIC: PUSHBROOM MARKET, BY COUNTRY, 20162020 (USD MILLION)
TABLE 38 ASIA PACIFIC: PUSHBROOM MARKET, BY COUNTRY, 20212026 (USD MILLION)
7.3 SNAPSHOT
7.3.1 SNAPSHOT SEGMENT TO WITNESS THE HIGHEST GROWTH DURING THE FORECAST PERIOD
TABLE 39 SNAPSHOT HYPERSPECTRAL IMAGING SYSTEMS MARKET, BY REGION, 20162020 (USD MILLION)
TABLE 40 SNAPSHOT MARKET, BY REGION, 20212026 (USD MILLION)
TABLE 41 NORTH AMERICA: SNAPSHOT MARKET, BY COUNTRY, 20162020 (USD MILLION)
TABLE 42 NORTH AMERICA: SNAPSHOT MARKET, BY COUNTRY, 20212026 (USD MILLION)
TABLE 43 EUROPE: SNAPSHOT MARKET, BY COUNTRY, 20162020 (USD MILLION)
TABLE 44 EUROPE: SNAPSHOT MARKET, BY COUNTRY, 20212026 (USD MILLION)
TABLE 45 ASIA PACIFIC: SNAPSHOT MARKET, BY COUNTRY, 20162020 (USD MILLION)
TABLE 46 ASIA PACIFIC: SNAPSHOT MARKET, BY COUNTRY, 20212026 (USD MILLION)
7.4 OTHER TECHNOLOGIES
TABLE 47 HYPERSPECTRAL IMAGING SYSTEMS MARKET FOR OTHER TECHNOLOGIES, BY REGION, 20162020 (USD MILLION)
TABLE 48 GLOBAL MARKET FOR OTHER TECHNOLOGIES, BY REGION, 20212026 (USD MILLION)
TABLE 49 NORTH AMERICA: MARKET FOR OTHER TECHNOLOGIES, BY COUNTRY, 20162020 (USD MILLION)
TABLE 50 NORTH AMERICA: MARKET FOR OTHER TECHNOLOGIES, BY COUNTRY, 20212026 (USD MILLION)
TABLE 51 EUROPE: MARKET FOR OTHER TECHNOLOGIES, BY COUNTRY, 20162020 (USD MILLION)
TABLE 52 EUROPE: MARKET FOR OTHER TECHNOLOGIES, BY COUNTRY, 20212026 (USD MILLION)
TABLE 53 ASIA PACIFIC: MARKET FOR OTHER TECHNOLOGIES, BY COUNTRY, 20162020 (USD MILLION)
TABLE 54 ASIA PACIFIC: MARKET FOR OTHER TECHNOLOGIES, BY COUNTRY, 20212026 (USD MILLION)
8 HYPERSPECTRAL IMAGING SYSTEM MARKET, BY APPLICATION (Page No. - 100)
8.1 INTRODUCTION
TABLE 55 HYPERSPECTRAL IMAGING SYSTEMS MARKET, BY APPLICATION, 20162020 (USD MILLION)
TABLE 56 GLOBAL MARKET, BY APPLICATION, 20212026 (USD MILLION)
8.2 MILITARY SURVEILLANCE
8.2.1 MILITARY SURVEILLANCE IS THE LARGEST APPLICATION SEGMENT OF THE GLOBAL MARKET
TABLE 57 MILITARY EXPENDITURE, BY REGION (2020)
TABLE 58 HIGHEST MILITARY EXPENDITURE, BY COUNTRY (2020)
TABLE 59 GLOBAL MARKET FOR MILITARY SURVEILLANCE, BY REGION, 20162020 (USD MILLION)
TABLE 60 GLOBAL MARKET FOR MILITARY SURVEILLANCE, BY REGION, 20212026 (USD MILLION)
TABLE 61 NORTH AMERICA: MARKET FOR MILITARY SURVEILLANCE, BY COUNTRY, 20162020 (USD MILLION)
TABLE 62 NORTH AMERICA: MARKET FOR MILITARY SURVEILLANCE, BY COUNTRY, 20212026 (USD MILLION)
TABLE 63 EUROPE: MARKET FOR MILITARY SURVEILLANCE, BY COUNTRY, 20162020 (USD MILLION)
TABLE 64 EUROPE: MARKET FOR MILITARY SURVEILLANCE, BY COUNTRY, 20212026 (USD MILLION)
TABLE 65 ASIA PACIFIC: MARKET FOR MILITARY SURVEILLANCE, BY COUNTRY, 20162020 (USD MILLION)
TABLE 66 ASIA PACIFIC: MARKET FOR MILITARY SURVEILLANCE, BY COUNTRY, 20212026 (USD MILLION)
8.3 REMOTE SENSING
TABLE 67 HYPERSPECTRAL IMAGING SYSTEMS MARKET FOR REMOTE SENSING, BY TYPE, 20162020 (USD MILLION)
TABLE 68 MARKET FOR REMOTE SENSING, BY TYPE, 20212026 (USD MILLION)
TABLE 69 MARKET FOR REMOTE SENSING, BY REGION, 20162020 (USD MILLION)
TABLE 70 MARKET FOR REMOTE SENSING, BY REGION, 20212026 (USD MILLION)
TABLE 71 NORTH AMERICA: MARKET FOR REMOTE SENSING, BY COUNTRY, 20162020 (USD MILLION)
TABLE 72 NORTH AMERICA: MARKET FOR REMOTE SENSING, BY COUNTRY, 20212026 (USD MILLION)
TABLE 73 EUROPE: MARKET FOR REMOTE SENSING, BY COUNTRY, 20162020 (USD MILLION)
TABLE 74 EUROPE: MARKET FOR REMOTE SENSING, BY COUNTRY, 20212026 (USD MILLION)
TABLE 75 ASIA PACIFIC: MARKET FOR REMOTE SENSING, BY COUNTRY, 20162020 (USD MILLION)
TABLE 76 ASIA PACIFIC: MARKET FOR REMOTE SENSING, BY COUNTRY, 20212026 (USD MILLION)
8.3.1 AGRICULTURE
8.3.1.1 Agriculture is the largest & fastest-growing segment of the remote sensing applications market
TABLE 77 HYPERSPECTRAL IMAGING SYSTEMS MARKET FOR AGRICULTURE, BY REGION, 20162020 (USD MILLION)
TABLE 78 GLOBAL MARKET FOR AGRICULTURE, BY REGION, 20212026 (USD MILLION)
8.3.2 MINING/MINERAL MAPPING
8.3.2.1 Hyperspectral imaging systems can accurately map areas that are spectrally unique at the surface to produce comprehensive mineral maps
TABLE 79 GLOBAL MARKET FOR MINING/MINERAL MAPPING, BY REGION, 20162020 (USD MILLION)
TABLE 80 GLOBAL MARKET FOR MINING/MINERAL MAPPING, BY REGION, 20212026 (USD MILLION)
8.3.3 ENVIRONMENTAL MONITORING
8.3.3.1 Hyperspectral imaging systems in environmental monitoring are used to monitor natural disasters
TABLE 81 GLOBAL MARKET FOR ENVIRONMENTAL MONITORING, BY REGION, 20162020 (USD MILLION)
TABLE 82 GLOBAL MARKET FOR ENVIRONMENTAL MONITORING, BY REGION, 20212026 (USD MILLION)
8.3.4 OTHER REMOTE SENSING APPLICATIONS
TABLE 83 GLOBAL MARKET FOR OTHER REMOTE SENSING APPLICATIONS, BY REGION, 20162020 (USD MILLION)
TABLE 84 GLOBAL MARKET FOR OTHER REMOTE SENSING APPLICATIONS, BY REGION, 20212026 (USD MILLION)
8.4 LIFE SCIENCES & MEDICAL DIAGNOSTICS
8.4.1 LIFE SCIENCES & MEDICAL DIAGNOSTICS SEGMENT TO REGISTER THE HIGHEST GROWTH DURING THE FORECAST PERIOD
TABLE 85 GLOBAL MARKET FOR LIFE SCIENCES & MEDICAL DIAGNOSTICS, BY REGION, 20162020 (USD MILLION)
TABLE 86 HYPERSPECTRAL IMAGING SYSTEMS MARKET FOR LIFE SCIENCES & MEDICAL DIAGNOSTICS, BY REGION, 20212026 (USD MILLION)
TABLE 87 NORTH AMERICA: MARKET FOR LIFE SCIENCES & MEDICAL DIAGNOSTICS, BY COUNTRY, 20162020 (USD MILLION)
TABLE 88 NORTH AMERICA: MARKET FOR LIFE SCIENCES & MEDICAL DIAGNOSTICS, BY COUNTRY, 20212026 (USD MILLION)
TABLE 89 EUROPE: MARKET FOR LIFE SCIENCES & MEDICAL DIAGNOSTICS, BY COUNTRY, 20162020 (USD MILLION)
TABLE 90 EUROPE: MARKET FOR LIFE SCIENCES & MEDICAL DIAGNOSTICS, BY COUNTRY, 20212026 (USD MILLION)
TABLE 91 ASIA PACIFIC: MARKET FOR LIFE SCIENCES & MEDICAL DIAGNOSTICS, BY COUNTRY, 20162020 (USD MILLION)
TABLE 92 ASIA PACIFIC: MARKET FOR LIFE SCIENCES & MEDICAL DIAGNOSTICS, BY COUNTRY, 20212026 (USD MILLION)
8.5 MACHINE VISION & OPTICAL SORTING
8.5.1 GROWING FOCUS ON AUTOMATION TO INCREASE PRODUCTIVITY IN VARIOUS INDUSTRIES WILL DRIVE THE MARKET FOR MACHINE VISION AND OPTICAL SORTING
TABLE 93 GLOBAL MARKET FOR MACHINE VISION & OPTICAL SORTING, BY REGION, 20162020 (USD MILLION)
TABLE 94 GLOBAL MARKET FOR MACHINE VISION & OPTICAL SORTING, BY REGION, 20212026 (USD MILLION)
TABLE 95 NORTH AMERICA: MARKET FOR MACHINE VISION & OPTICAL SORTING, BY COUNTRY, 20162020 (USD MILLION)
TABLE 96 NORTH AMERICA: MARKET FOR MACHINE VISION & OPTICAL SORTING, BY COUNTRY, 20212026 (USD MILLION)
TABLE 97 EUROPE: MARKET FOR MACHINE VISION & OPTICAL SORTING, BY COUNTRY, 20162020 (USD MILLION)
TABLE 98 EUROPE: MARKET FOR MACHINE VISION & OPTICAL SORTING, BY COUNTRY, 20212026 (USD MILLION)
TABLE 99 ASIA PACIFIC: MARKET FOR MACHINE VISION & OPTICAL SORTING, BY COUNTRY, 20162020 (USD MILLION)
TABLE 100 ASIA PACIFIC: MARKET FOR MACHINE VISION & OPTICAL SORTING, BY COUNTRY, 20212026 (USD MILLION)
8.6 OTHER APPLICATIONS
TABLE 101 HYPERSPECTRAL IMAGING SYSTEMS MARKET FOR OTHER APPLICATIONS, BY REGION, 20162020 (USD MILLION)
TABLE 102 MARKET FOR OTHER APPLICATIONS, BY REGION, 20212026 (USD MILLION)
TABLE 103 NORTH AMERICA: MARKET FOR OTHER APPLICATIONS, BY COUNTRY, 20162020 (USD MILLION)
TABLE 104 NORTH AMERICA: MARKET FOR OTHER APPLICATIONS, BY COUNTRY, 20212026 (USD MILLION)
TABLE 105 EUROPE: MARKET FOR OTHER APPLICATIONS, BY COUNTRY, 20162020 (USD MILLION)
TABLE 106 EUROPE: MARKET FOR OTHER APPLICATIONS, BY COUNTRY, 20212026 (USD MILLION)
TABLE 107 ASIA PACIFIC: MARKET FOR OTHER APPLICATIONS, BY COUNTRY, 20162020 (USD MILLION)
TABLE 108 ASIA PACIFIC: MARKET FOR OTHER APPLICATIONS, BY COUNTRY, 20212026 (USD MILLION)
9 HYPERSPECTRAL IMAGING SYSTEM MARKET, BY REGION (Page No. - 123)
9.1 INTRODUCTION
TABLE 109 HYPERSPECTRAL IMAGING SYSTEMS MARKET, BY REGION, 20162020 (USD MILLION)
TABLE 110 GLOBAL MARKET, BY REGION, 20212026 (USD MILLION)
9.2 NORTH AMERICA
FIGURE 29 NORTH AMERICA: HYPERSPECTRAL IMAGING SYSTEM MARKET SNAPSHOT
TABLE 111 NORTH AMERICA: HYPERSPECTRAL IMAGING SYSTEMS MARKET, BY COUNTRY, 20162020 (USD MILLION)
TABLE 112 NORTH AMERICA: MARKET, BY COUNTRY, 20212026 (USD MILLION)
TABLE 113 NORTH AMERICA: MARKET, BY PRODUCT, 20162020 (USD MILLION)
TABLE 114 NORTH AMERICA: MARKET, BY PRODUCT, 20212026 (USD MILLION)
TABLE 115 NORTH AMERICA: MARKET, BY APPLICATION, 20162020 (USD MILLION)
TABLE 116 NORTH AMERICA: MARKET, BY APPLICATION, 20212026 (USD MILLION)
TABLE 117 NORTH AMERICA: MARKET FOR REMOTE SENSING, BY TYPE, 20162020 (USD MILLION)
TABLE 118 NORTH AMERICA: MARKET FOR REMOTE SENSING, BY TYPE, 20212026 (USD MILLION)
TABLE 119 NORTH AMERICA: MARKET, BY TECHNOLOGY, 20162020 (USD MILLION)
TABLE 120 NORTH AMERICA: MARKET, BY TECHNOLOGY, 20212026 (USD MILLION)
9.2.1 US
9.2.1.1 The US dominates the North American hyperspectral imaging systems market
TABLE 121 US: HYPERSPECTRAL IMAGING SYSTEM MARKET, BY PRODUCT, 20162020 (USD MILLION)
TABLE 122 US: HYPERSPECTRAL IMAGING SYSTEMS MARKET, BY PRODUCT, 20212026 (USD MILLION)
TABLE 123 US: MARKET, BY APPLICATION, 20162020 (USD MILLION)
TABLE 124 US: MARKET, BY APPLICATION, 20212026 (USD MILLION)
TABLE 125 US: MARKET FOR REMOTE SENSING, BY TYPE, 20162020 (USD MILLION)
TABLE 126 US: MARKET FOR REMOTE SENSING, BY TYPE, 20212026 (USD MILLION)
TABLE 127 US: MARKET, BY TECHNOLOGY, 20162020 (USD MILLION)
TABLE 128 US: MARKET, BY TECHNOLOGY, 20212026 (USD MILLION)
9.2.2 CANADA
9.2.2.1 Rising government investments and continuous technological developments will drive the market in the country
TABLE 129 CANADA: HYPERSPECTRAL IMAGING SYSTEM MARKET, BY PRODUCT, 20162020 (USD MILLION)
TABLE 130 CANADA: HYPERSPECTRAL IMAGING SYSTEMS MARKET, BY PRODUCT, 20212026 (USD MILLION)
TABLE 131 CANADA: MARKET, BY APPLICATION, 20162020 (USD MILLION)
TABLE 132 CANADA: MARKET, BY APPLICATION, 20212026 (USD MILLION)
TABLE 133 CANADA: MARKET FOR REMOTE SENSING, BY TYPE, 20162020 (USD MILLION)
TABLE 134 CANADA: MARKET FOR REMOTE SENSING, BY TYPE, 20212026 (USD MILLION)
TABLE 135 CANADA: MARKET, BY TECHNOLOGY, 20162020 (USD MILLION)
TABLE 136 CANADA: MARKET, BY TECHNOLOGY, 20212026 (USD MILLION)
9.3 EUROPE
TABLE 137 EUROPE: HYPERSPECTRAL IMAGING SYSTEM MARKET, BY COUNTRY, 20162020 (USD MILLION)
TABLE 138 EUROPE: HYPERSPECTRAL IMAGING SYSTEMS MARKET, BY COUNTRY, 20212026 (USD MILLION)
TABLE 139 EUROPE: MARKET, BY PRODUCT, 20162020 (USD MILLION)
TABLE 140 EUROPE: MARKET, BY PRODUCT, 20212026 (USD MILLION)
TABLE 141 EUROPE: MARKET, BY APPLICATION, 20162020 (USD MILLION)
TABLE 142 EUROPE: MARKET, BY APPLICATION, 20212026 (USD MILLION)
TABLE 143 EUROPE: MARKET FOR REMOTE SENSING, BY TYPE, 20162020 (USD MILLION)
TABLE 144 EUROPE: MARKET FOR REMOTE SENSING, BY TYPE, 20212026 (USD MILLION)
TABLE 145 EUROPE: MARKET, BY TECHNOLOGY, 20162020 (USD MILLION)
TABLE 146 EUROPE: MARKET, BY TECHNOLOGY, 20212026 (USD MILLION)
9.3.1 GERMANY
9.3.1.1 Germany dominates the European market for hyperspectral imaging systems
TABLE 147 GERMANY: HYPERSPECTRAL IMAGING SYSTEM MARKET, BY PRODUCT, 20162020 (USD MILLION)
TABLE 148 GERMANY: HYPERSPECTRAL IMAGING SYSTEMS MARKET, BY PRODUCT, 20212026 (USD MILLION)
TABLE 149 GERMANY: MARKET, BY APPLICATION, 20162020 (USD MILLION)
TABLE 150 GERMANY: MARKET, BY APPLICATION, 20212026 (USD MILLION)
TABLE 151 GERMANY: MARKET FOR REMOTE SENSING, BY TYPE, 20162020 (USD MILLION)
TABLE 152 GERMANY: MARKET FOR REMOTE SENSING, BY TYPE, 20212026 (USD MILLION)
TABLE 153 GERMANY: MARKET, BY TECHNOLOGY, 20162020 (USD MILLION)
TABLE 154 GERMANY: MARKET, BY TECHNOLOGY, 20212026 (USD MILLION)
9.3.2 FRANCE
9.3.2.1 Rising interest in expanding the applications of hyperspectral imaging is driving market growth
TABLE 155 FRANCE: HYPERSPECTRAL IMAGING SYSTEM MARKET, BY PRODUCT, 20162020 (USD MILLION)
TABLE 156 FRANCE: HYPERSPECTRAL IMAGING SYSTEMS MARKET, BY PRODUCT, 20212026 (USD MILLION)
TABLE 157 FRANCE: MARKET, BY APPLICATION, 20162020 (USD MILLION)
TABLE 158 FRANCE: MARKET, BY APPLICATION, 20212026 (USD MILLION)
TABLE 159 FRANCE: MARKET FOR REMOTE SENSING, BY TYPE, 20162020 (USD MILLION)
TABLE 160 FRANCE: MARKET FOR REMOTE SENSING, BY TYPE, 20212026 (USD MILLION)
TABLE 161 FRANCE: MARKET, BY TECHNOLOGY, 20162020 (USD MILLION)
TABLE 162 FRANCE: MARKET, BY TECHNOLOGY, 20212026 (USD MILLION)
9.3.3 UK
9.3.3.1 Growing interest in deploying hyperspectral imaging in research applications to drive market growth in the UK
TABLE 163 UK: HYPERSPECTRAL IMAGING SYSTEM MARKET, BY PRODUCT, 20162020 (USD MILLION)
TABLE 164 UK: HYPERSPECTRAL IMAGING SYSTEMS MARKET, BY PRODUCT, 20212026 (USD MILLION)
TABLE 165 UK: MARKET, BY APPLICATION, 20162020 (USD MILLION)
TABLE 166 UK: MARKET, BY APPLICATION, 20212026 (USD MILLION)
TABLE 167 UK: MARKET FOR REMOTE SENSING, BY TYPE, 20162020 (USD MILLION)
TABLE 168 UK: MARKET FOR REMOTE SENSING, BY TYPE, 20212026 (USD MILLION)
TABLE 169 UK: MARKET, BY TECHNOLOGY, 20162020 (USD MILLION)
TABLE 170 UK: MARKET, BY TECHNOLOGY, 20212026 (USD MILLION)
9.3.4 ITALY
9.3.4.1 Implementation of hyperspectral imaging technology in new application areas will drive the Italian market
TABLE 171 ITALY: HYPERSPECTRAL IMAGING SYSTEM MARKET, BY PRODUCT, 20162020 (USD MILLION)
TABLE 172 ITALY: HYPERSPECTRAL IMAGING SYSTEMS MARKET, BY PRODUCT, 20212026 (USD MILLION)
TABLE 173 ITALY: MARKET, BY APPLICATION, 20162020 (USD MILLION)
TABLE 174 ITALY: MARKET, BY APPLICATION, 20212026 (USD MILLION)
TABLE 175 ITALY: MARKET FOR REMOTE SENSING, BY TYPE, 20162020 (USD MILLION)
TABLE 176 ITALY: MARKET FOR REMOTE SENSING, BY TYPE, 20212026 (USD MILLION)
TABLE 177 ITALY: MARKET, BY TECHNOLOGY, 20162020 (USD MILLION)
TABLE 178 ITALY: MARKET, BY TECHNOLOGY, 20212026 (USD MILLION)
9.3.5 SPAIN
9.3.5.1 Advancements in research are supporting the growth of the Spanish market
TABLE 179 SPAIN: HYPERSPECTRAL IMAGING SYSTEM MARKET, BY PRODUCT, 20162020 (USD MILLION)
TABLE 180 SPAIN: HYPERSPECTRAL IMAGING SYSTEMS MARKET, BY PRODUCT, 20212026 (USD MILLION)
TABLE 181 SPAIN: MARKET, BY APPLICATION, 20162020 (USD MILLION)
TABLE 182 SPAIN: MARKET, BY APPLICATION, 20212026 (USD MILLION)
TABLE 183 SPAIN: MARKET FOR REMOTE SENSING, BY TYPE, 20162020 (USD MILLION)
TABLE 184 SPAIN: MARKET FOR REMOTE SENSING, BY TYPE, 20212026 (USD MILLION)
TABLE 185 SPAIN: MARKET, BY TECHNOLOGY, 20162020 (USD MILLION)
TABLE 186 SPAIN: MARKET, BY TECHNOLOGY, 20212026 (USD MILLION)
9.3.6 REST OF EUROPE
TABLE 187 ROE: HYPERSPECTRAL IMAGING SYSTEM MARKET, BY PRODUCT, 20162020 (USD MILLION)
TABLE 188 ROE: HYPERSPECTRAL IMAGING SYSTEMS MARKET, BY PRODUCT, 20212026 (USD MILLION)
TABLE 189 ROE: MARKET, BY APPLICATION, 20162020 (USD MILLION)
TABLE 190 ROE: MARKET, BY APPLICATION, 20212026 (USD MILLION)
TABLE 191 ROE: MARKET FOR REMOTE SENSING, BY TYPE, 20162020 (USD MILLION)
TABLE 192 ROE: MARKET FOR REMOTE SENSING, BY TYPE, 20212026 (USD MILLION)
TABLE 193 ROE: MARKET, BY TECHNOLOGY, 20162020 (USD MILLION)
TABLE 194 ROE: MARKET, BY TECHNOLOGY, 20212026 (USD MILLION)
9.4 ASIA PACIFIC
FIGURE 30 ASIA PACIFIC: HYPERSPECTRAL IMAGING SYSTEM MARKET SNAPSHOT
TABLE 195 ASIA PACIFIC: HYPERSPECTRAL IMAGING SYSTEMS MARKET, BY COUNTRY, 20162020 (USD MILLION)
TABLE 196 ASIA PACIFIC: MARKET, BY COUNTRY, 20212026 (USD MILLION)
TABLE 197 ASIA PACIFIC: MARKET, BY PRODUCT, 20162020 (USD MILLION)
TABLE 198 ASIA PACIFIC: MARKET, BY PRODUCT, 20212026 (USD MILLION)
TABLE 199 ASIA PACIFIC: MARKET, BY APPLICATION, 20162020 (USD MILLION)
TABLE 200 ASIA PACIFIC: MARKET, BY APPLICATION, 20212026 (USD MILLION)
TABLE 201 ASIA PACIFIC: MARKET FOR REMOTE SENSING, BY TYPE, 20162020 (USD MILLION)
TABLE 202 ASIA PACIFIC: MARKET FOR REMOTE SENSING, BY TYPE, 20212026 (USD MILLION)
TABLE 203 ASIA PACIFIC: MARKET, BY TECHNOLOGY, 20162020 (USD MILLION)
TABLE 204 ASIA PACIFIC: MARKET, BY TECHNOLOGY, 20212026 (USD MILLION)
9.4.1 JAPAN
9.4.1.1 Japan holds the largest share of the Asia Pacific market
TABLE 205 JAPAN: HYPERSPECTRAL IMAGING SYSTEM MARKET, BY PRODUCT, 20162020 (USD MILLION)
TABLE 206 JAPAN: HYPERSPECTRAL IMAGING SYSTEMS MARKET, BY PRODUCT, 20212026 (USD MILLION)
TABLE 207 JAPAN: MARKET, BY APPLICATION, 20162020 (USD MILLION)
TABLE 208 JAPAN: MARKET, BY APPLICATION, 20212026 (USD MILLION)
TABLE 209 JAPAN: MARKET FOR REMOTE SENSING, BY TYPE, 20162020 (USD MILLION)
TABLE 210 JAPAN: MARKET FOR REMOTE SENSING, BY TYPE, 20212026 (USD MILLION)
TABLE 211 JAPAN: MARKET, BY TECHNOLOGY, 20162020 (USD MILLION)
TABLE 212 JAPAN: MARKET, BY TECHNOLOGY, 20212026 (USD MILLION)
9.4.2 CHINA
9.4.2.1 China to register the highest CAGR during the forecast period in the Asia Pacific hyperspectral imaging systems market
TABLE 213 CHINA: HYPERSPECTRAL IMAGING SYSTEM MARKET, BY PRODUCT, 20162020 (USD MILLION)
TABLE 214 CHINA: HYPERSPECTRAL IMAGING SYSTEMS MARKET, BY PRODUCT, 20212026 (USD MILLION)
TABLE 215 CHINA: MARKET, BY APPLICATION, 20162020 (USD MILLION)
TABLE 216 CHINA: MARKET, BY APPLICATION, 20212026 (USD MILLION)
TABLE 217 CHINA: MARKET FOR REMOTE SENSING, BY TYPE, 20162020 (USD MILLION)
TABLE 218 CHINA: MARKET FOR REMOTE SENSING, BY TYPE, 20212026 (USD MILLION)
TABLE 219 CHINA: MARKET, BY TECHNOLOGY, 20162020 (USD MILLION)
TABLE 220 CHINA: MARKET, BY TECHNOLOGY, 20212026 (USD MILLION)
9.4.3 INDIA
9.4.3.1 Increased research will drive market growth in India
TABLE 221 INDIA: HYPERSPECTRAL IMAGING SYSTEM MARKET, BY PRODUCT, 20162020 (USD MILLION)
TABLE 222 INDIA: HYPERSPECTRAL IMAGING SYSTEMS MARKET, BY PRODUCT, 20212026 (USD MILLION)
TABLE 223 INDIA: MARKET, BY APPLICATION, 20162020 (USD MILLION)
TABLE 224 INDIA: MARKET, BY APPLICATION, 20212026 (USD MILLION)
TABLE 225 INDIA: MARKET FOR REMOTE SENSING, BY TYPE, 20162020 (USD MILLION)
TABLE 226 INDIA: MARKET FOR REMOTE SENSING, BY TYPE, 20212026 (USD MILLION)
TABLE 227 INDIA: MARKET, BY TECHNOLOGY, 20162020 (USD MILLION)
TABLE 228 INDIA: MARKET, BY TECHNOLOGY, 20212026 (USD MILLION)
9.4.4 REST OF ASIA PACIFIC
TABLE 229 ROAPAC: HYPERSPECTRAL IMAGING SYSTEM MARKET, BY PRODUCT, 20162020 (USD MILLION)
TABLE 230 ROAPAC: HYPERSPECTRAL IMAGING SYSTEMS MARKET, BY PRODUCT, 20212026 (USD MILLION)
TABLE 231 ROAPAC: MARKET, BY APPLICATION, 20162020 (USD MILLION)
TABLE 232 ROAPAC: MARKET, BY APPLICATION, 20212026 (USD MILLION)
TABLE 233 ROAPAC: MARKET FOR REMOTE SENSING, BY TYPE, 20162020 (USD MILLION)
TABLE 234 ROAPAC: MARKET FOR REMOTE SENSING, BY TYPE, 20212026 (USD MILLION)
TABLE 235 ROAPAC: MARKET, BY TECHNOLOGY, 20162020 (USD MILLION)
TABLE 236 ROAPAC: MARKET, BY TECHNOLOGY, 20212026 (USD MILLION)
9.5 REST OF THE WORLD
TABLE 237 ROW: HYPERSPECTRAL IMAGING SYSTEM MARKET, BY REGION, 20162020 (USD MILLION)
TABLE 238 ROW: HYPERSPECTRAL IMAGING SYSTEMS MARKET, BY REGION, 20212026 (USD MILLION)
TABLE 239 ROW: MARKET, BY PRODUCT, 20162020 (USD MILLION)
TABLE 240 ROW: MARKET, BY PRODUCT, 20212026 (USD MILLION)
TABLE 241 ROW: MARKET, BY APPLICATION, 20162020 (USD MILLION)
TABLE 242 ROW: MARKET, BY APPLICATION, 20212026 (USD MILLION)
TABLE 243 ROW: MARKET FOR REMOTE SENSING, BY TYPE, 20162020 (USD MILLION)
TABLE 244 ROW: MARKET FOR REMOTE SENSING, BY TYPE, 20212026 (USD MILLION)
TABLE 245 ROW: MARKET, BY TECHNOLOGY, 20162020 (USD MILLION)
TABLE 246 ROW: MARKET, BY TECHNOLOGY, 20212026 (USD MILLION)
9.5.1 LATIN AMERICA
9.5.1.1 Need for remote sensing will positively impact the hyperspectral imaging system market in the region
TABLE 247 LATIN AMERICA: HYPERSPECTRAL IMAGING SYSTEMS MARKET, BY PRODUCT, 20162020 (USD MILLION)
TABLE 248 LATIN AMERICA: MARKET, BY PRODUCT, 20212026 (USD MILLION)
9.5.2 MIDDLE EAST & AFRICA
9.5.2.1 Increasing research and development to drive the market in the region
TABLE 249 MIDDLE EAST & AFRICA: MARKET, BY PRODUCT, 20162020 (USD MILLION)
TABLE 250 MIDDLE EAST & AFRICA: MARKET, BY PRODUCT, 20212026 (USD MILLION)
10 COMPETITIVE LANDSCAPE (Page No. - 182)
10.1 OVERVIEW
10.2 KEY PLAYER STRATEGIES/RIGHT TO WIN
TABLE 251 OVERVIEW OF STRATEGIES ADOPTED BY KEY MARKET PLAYERS
10.3 MARKET RANKING ANALYSIS
TABLE 252 HYPERSPECTRAL IMAGING SYSTEM MARKET RANKING ANALYSIS (2020)
10.4 COMPANY EVALUATION QUADRANT
10.4.1 STARS
10.4.2 EMERGING LEADERS
10.4.3 PERVASIVE PLAYERS
10.4.4 PARTICIPANTS
FIGURE 31 HYPERSPECTRAL IMAGING SYSTEMS MARKET: COMPANY EVALUATION QUADRANT, 2020
10.5 COMPANY EVALUATION QUADRANT FOR SMES/START-UPS
10.5.1 PROGRESSIVE COMPANIES
10.5.2 STARTING BLOCKS
10.5.3 RESPONSIVE COMPANIES
10.5.4 DYNAMIC COMPANIES
FIGURE 32 HYPERSPECTRAL IMAGING SYSTEM MARKET: COMPANY EVALUATION QUADRANT FOR SMES & START-UPS, 2020
10.6 COMPETITIVE SCENARIO
10.6.1 PRODUCT LAUNCHES
TABLE 253 PRODUCT LAUNCHES
10.6.2 DEALS
TABLE 254 DEALS
10.6.3 OTHER DEVELOPMENTS
TABLE 255 OTHER DEVELOPMENTS
10.7 COMPANY PRODUCT FOOTPRINT
TABLE 256 COMPANY FOOTPRINT
TABLE 257 COMPANY PRODUCT FOOTPRINT
TABLE 258 COMPANY REGIONAL FOOTPRINT
11 COMPANY PROFILES (Page No. - 196)
11.1 KEY PLAYERS
(Business Overview, Products/Services/Solutions Offered, MnM View, Key Strengths and Right to Win, Strategic Choices Made, Weaknesses and Competitive Threats, Recent Developments)*
11.1.1 HEADWALL PHOTONICS, INC.
TABLE 259 HEADWALL PHOTONICS, INC.: BUSINESS OVERVIEW
11.1.2 SPECIM, SPECTRAL IMAGING LTD.
TABLE 260 SPECIM, SPECTRAL IMAGING LTD.: BUSINESS OVERVIEW
11.1.3 NORSK ELEKTRO OPTIKK AS
TABLE 261 NORSK ELEKTRO OPTIKK AS: BUSINESS OVERVIEW
11.1.4 RESONON INC.
TABLE 262 RESONON INC.: BUSINESS OVERVIEW
11.1.5 CORNING INCORPORATED
TABLE 263 CORNING INCORPORATED: BUSINESS OVERVIEW
FIGURE 33 CORNING INCORPORATED: COMPANY SNAPSHOT (2020)
11.1.6 APPLIED SPECTRAL IMAGING
TABLE 264 APPLIED SPECTRAL IMAGING: BUSINESS OVERVIEW
11.1.7 BAYSPEC, INC.
TABLE 265 BAYSPEC, INC.: BUSINESS OVERVIEW
11.1.8 CHEMIMAGE CORPORATION
TABLE 266 CHEMIMAGE CORPORATION: BUSINESS OVERVIEW
11.1.9 CUBERT GMBH
TABLE 267 CUBERT GMBH: BUSINESS OVERVIEW
11.1.10 GALILEO GROUP, INC.
TABLE 268 GALILEO GROUP, INC.: BUSINESS OVERVIEW
11.1.11 HYPERMED IMAGING, INC.
TABLE 269 HYPERMED IMAGING, INC.: BUSINESS OVERVIEW
11.1.12 IMEC
TABLE 270 IMEC: BUSINESS OVERVIEW
11.1.13 INNO-SPEC GMBH
TABLE 271 INNO-SPEC GMBH: BUSINESS OVERVIEW
11.1.14 SURFACE OPTICS CORPORATION
TABLE 272 SURFACE OPTICS CORPORATION: BUSINESS OVERVIEW
11.1.15 TELOPS INC.
TABLE 273 TELOPS INC.: BUSINESS OVERVIEW
11.2 OTHER PLAYERS
11.2.1 BRANDYWINE PHOTONICS
11.2.2 CYTOVIVA, INC.
11.2.3 DIASPECTIVE VISION
11.2.4 GAMAYA
11.2.5 HINALEA IMAGING
11.2.6 ORBITAL SIDEKICK
11.2.7 PHOTON ETC.
11.2.8 XIMEA GMBH
11.2.9 CLYDE HSI
11.2.10 GLANA SENSORS AB
*Business Overview, Products/Services/Solutions Offered, MnM View, Key Strengths and Right to Win, Strategic Choices Made, Weaknesses and Competitive Threats, Recent Developments might not be captured in case of unlisted companies.
12 APPENDIX (Page No. - 238)
12.1 DISCUSSION GUIDE
12.2 KNOWLEDGE STORE: MARKETSANDMARKETS SUBSCRIPTION PORTAL
12.3 AVAILABLE CUSTOMIZATIONS
12.4 RELATED REPORTS
12.5 AUTHOR DETAILS
This study involved four major activities in estimating the current size of the hyperspectral imaging systems market. Exhaustive secondary research was carried out to collect information on the market, its peer markets, and its parent market. The next step was to validate these findings, assumptions, and sizing with industry experts across the value chain through primary research. Both top-down and bottom-up approaches were employed to estimate the complete market size. After that, market breakdown and data triangulation procedures were used to estimate the market size of segments and subsegments.
Secondary Research
Secondary research was used mainly to identify and collect information for the extensive, technical, market-oriented, and commercial study of the hyperspectral imaging systems market. The secondary sources used for this study include The Optical Society (OSA), Society of Photo-Optical Instrumentation Engineers (SPIE)
Geoscience and Remote Sensing Society (GRSS), Indian Society of Remote Sensing (ISRS), International Society of Precision Agriculture (ISPA), Annual Reports, SEC Filings, Investor Presentations, Expert Interviews, and MarketsandMarkets Analysis. These sources were also used to obtain key information about major players, market classification, and segmentation according to industry trends, regional/country-level markets, market developments, and technology perspectives.
Primary Research
In-depth interviews were conducted with various primary respondents, including key industry participants, subject-matter experts (SMEs), C-level executives of key market players, and industry consultants, among other experts, to obtain and verify the critical qualitative and quantitative information as well as assess future prospects of the market. Various primary sources from both the supply and demand sides of the market were interviewed to obtain qualitative and quantitative information. The following is a breakdown of the primary respondents:
To know about the assumptions considered for the study, download the pdf brochure
Market Size Estimation
Both top-down and bottom-up approaches were used to estimate and validate the total size of the hyperspectral imaging systems market. These methods were also used extensively to estimate the size of various subsegments in the market. The research methodology used to estimate the market size includes the following:
- The key players in the industry and market have been identified through extensive secondary research
- The revenues generated from the hyperspectral imaging systems business of leading players have been determined through primary and secondary research
- All percentage shares, splits, and breakdowns have been determined using secondary sources and verified through primary sources
Data Triangulation
After arriving at the overall market size from the market size estimation process, the total market was split into several segments and subsegments. To complete the overall market engineering process and arrive at the exact statistics for all segments and subsegments, data triangulation and market breakdown procedures were employed, wherever applicable. The data was triangulated by studying various factors and trends from both the demand and supply sides.
Report Objectives
- To define, describe, and forecast the global hyperspectral imaging systems market based on the product, technology, application and region
- To provide detailed information regarding the major factors influencing the growth of the market (such as drivers, restraints, challenges and opportunities)
- To strategically analyze micromarkets with respect to individual growth trends, future prospects, and contributions to the overall hyperspectral imaging systems market
- To analyze opportunities in the market for stakeholders and provide details of the competitive landscape for market leaders
- To forecast the size of the market segments with respect to five main regions, namely, North America, Europe, Asia Pacific, and the Rest of the World
- To strategically profile the key players and comprehensively analyze their product portfolios, market positions, and core competencies
- To track and analyze competitive developments such as acquisitions, product launches, expansions, agreements, partnerships, and R&D activities in the hyperspectral imaging systems market.
Available Customizations
With the given market data, MarketsandMarkets offers customizations as per the companys specific needs. The following customization options are available for this report:
Company Information
- An additional five company profiles
Growth opportunities and latent adjacency in Hyperspectral Imaging System Market