Immersive Analytics Market by Offering (Hardware, Solutions, Services), End-use Industry (Healthcare, Construction, Automotive & Transportation, Media & Entertainment), Application, and Region - Global Forecast to 2028
Overview
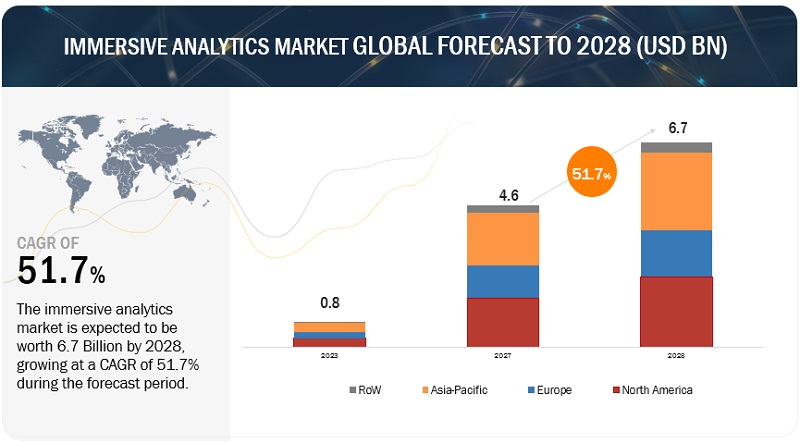
The immersive analytics market is projected to grow significantly, increasing from USD 0.8 billion in 2023 to USD 4.6 billion in 2027, with a robust CAGR of 51.7%.
The rising demand for analyzing and understanding heterogeneous data with data visualization tools will drive the growth of the immersive analytics market. Analyzing heterogeneous data with immersive analytics tools can also offer advantages as it can provide a more comprehensive understanding of a complex system or issue, leading to better decision-making and insights.
To know about the assumptions considered for the study, Request for Free Sample Report
To know about the assumptions considered for the study, download the pdf brochure
Immersive Analytics Market Dynamics
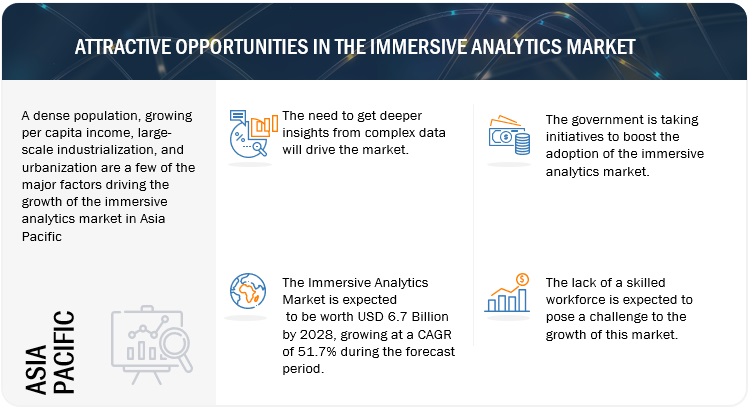
Driver: Large amount and complexity of the data available for analysis will increase the demand of the immersive analytics market.
As the volume and complexity of data being produced continue to increase, there is a rising need for sophisticated analytics tools that can provide meaningful insights. Immersive analytics is one such approach that leverages virtual and augmented reality technologies to create an immersive experience for users as they explore and analyze data. Presenting data in a 3D format allows users to gain deeper insights into patterns, trends, and relationships that may not be immediately apparent in a 2D interface, leading to better decision-making.
Restraint: High cost to deploy infrastructure required for immersive analytics
The cost associated with deploying AR, VR, and XR technology for immersive analytics can vary depending on several factors, including the complexity of the analytics, the type of hardware and software used, and the scope of the project. Deploying AR, VR, and XR technologies for immersive analytics can be expensive due to the specialized hardware, software, and content creation required. For example, A manufacturing company's large-scale project requiring real-time monitoring and analysis of complex machinery and equipment could be an example of a high deployment cost for immersive analytics.
Opportunity: Increasing demand of IoT will create huge potential for immersive analytics
The expanding reach of the Internet of Things (IoT) creates an opportunity for immersive analytics to be employed in the visualization and analysis of data generated by sensors and other IoT devices. This has the potential to provide businesses with real-time insights into their operations, which can inform better decision-making based on this data. The fusion of IoT and immersive analytics can revolutionize how businesses and organizations function.
Challenge: Lack of analytical knowledge in the workforce
Enterprises continue to grapple with the widespread adoption of futuristic technologies, seeking guidance on the most viable path forward in this disruptive landscape. According to global data scientists, a key obstacle to embracing immersive technology lies in the insufficient skillsets within the workforce, impeding the optimal utilization of these advanced pervasive technologies.
Immersive Analytics Market Ecosystem
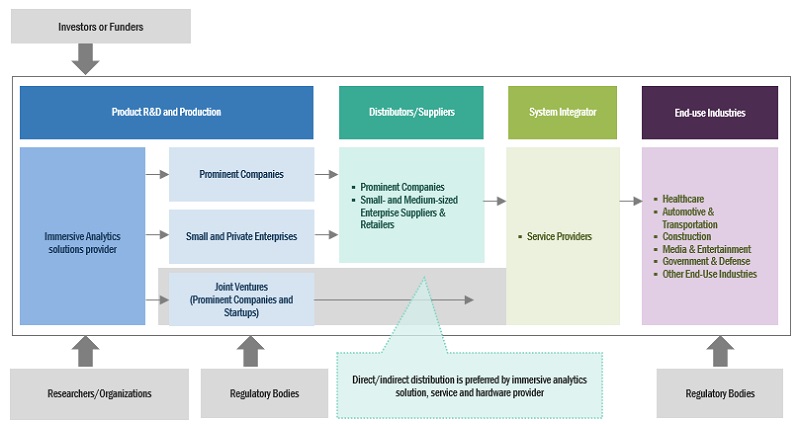
Prominent companies in this market include a well-established, financially stable provider of the immersive analytics market. These companies have been innovating their existing offerings and possess a diversified product portfolio, state-of-the-art technologies, and strong global sales and marketing networks. Prominent companies in this market include IBM (US), Google (US), Microsoft (US), HTC (Taiwan), and Meta (US).
By Hardware, the AR/VR/MR Headsets segment to hold the largest market size during the forecast period
AR/VR/MR headsets amplify the immersive experience, empowering users to interact with data in a three-dimensional environment. This enhanced capability facilitates a profound comprehension of intricate data sets, enabling the identification of complex patterns and trends that may be elusive with traditional data visualizations. By leveraging these headsets, seamless collaboration among data scientists, analysts, and stakeholders is fostered, resulting in enhanced speed, accuracy, and quality in data analysis and decision-making.
By service, the professional services segment is expected to hold the largest market size during the forecast period
Enterprises need proven professional experts to assist in implementing immersive analytics. Professionals, specialists, and experts offer professional services to support businesses. Professional services comprise design and consulting, training and education, support and maintenance, and installation and integration. Professionals use the latest techniques, comprehensive strategies, and skills to fulfill the organization's security requirements.
Based on the end-use industries segment, the media & entertainment segment is expected to grow with the highest CAGR during the forecast period
The entertainment industry is one of the most enthusiastic applications of immersive technology. This technology is expected to be the future of the entertainment industry. Immersive analytics is a novel method that leverages virtual and augmented reality technologies to enable users to engage with data in a 3D, immersive environment. Although its application in media and entertainment is still in the early stages, it is gaining interest for its potential to revolutionize the way content creators work with data, from planning to post-production analysis.
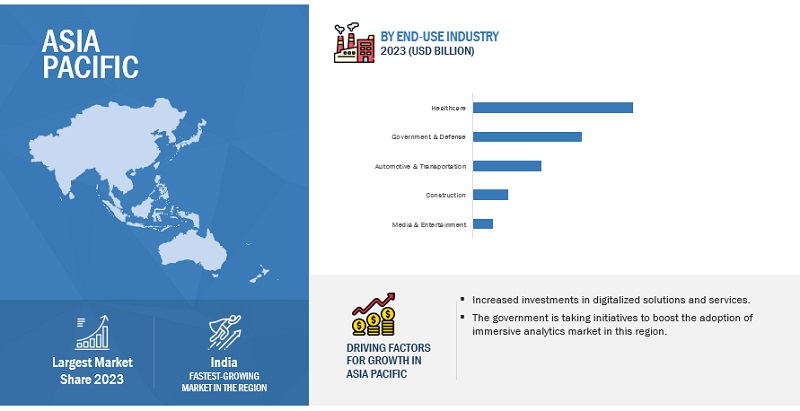
Based on region Asia Pacific is expected to hold the largest market size during the forecast period.
Companies operating in this region will benefit from flexible economic conditions, the industrialization-and globalization-motivated policies of governments, and the expanding digitalization and technological adoption, all of which are expected to have a huge impact on the business community in the region. The growth of the immersive analytics market is anticipated to be fueled by the surge in urbanization in the region. Asia Pacific has a significant technology adoption rate and is expected to record the highest growth rate in the immersive analytics market over the next few years.
Market Players:
The major players in the immersive analytics market are IBM (US), Microsoft (US), SAP (Germany), Google (US), TIBCO (US), HPE (US), Magic Leap (US), Accenture (Ireland), HTC (Taiwan), Meta (US), Tableau (US), Kognitiv Spark (Canada), Aventior (US), Immersion Analytics (US), BadVR (US), Virtualitics (US), Softcare Studios (Italy), JuJu Immersive (UK), ARSOME Technology (US), Varjo (Finland), Cognitive3D (Canada), SenseGlove (Netherlands), DPVR (China), PICO (US), Reply (Italy). These players have adopted various growth strategies, such as partnerships, agreements and collaborations, new product launches and product enhancements, and acquisitions to expand their footprint in the immersive analytics market.
Scope of the Report
|
Report Metrics |
Details |
|
Market size available for years |
2023-2028 |
|
Forecast period |
2023–2028 |
|
Forecast units |
Value (USD) Million/Billion |
|
Segments covered |
Offering, Applications, and End-Use Industry |
|
Region covered |
North America, Europe, Asia Pacific, Rest of the World |
|
Companies covered |
IBM (US), Microsoft (US), SAP (Germany), Google (US), TIBCO (US), HPE (US), Magic Leap (US), Accenture (Ireland), HTC (Taiwan), Meta (US), Tableau (US), Kognitiv Spark (Canada), Aventior (US), Immersion Analytics (US), BadVR (US), Virtualitics (US), Softcare Studios (Italy), JuJu Immersive (UK), ARSOME Technology (US), Varjo (Finland), Cognitive3D (Canada), SenseGlove (Netherlands), DPVR (China), PICO (US), Reply (Italy). |
Immersive Analytics Market Highlights
This research report categorizes the Immersive Analytics Market to forecast revenues and analyze trends in each of the following submarkets:
|
Segment |
Subsegment |
|
Based on Offering: |
|
|
Based on Application: |
|
|
Based on End-Use Industry: |
|
|
By Region: |
|
Recent Developments
- In September 2022, IBM recently unveiled Cognos 11.2.3, the latest addition to the Cognos Analytics with Watson 11.2.x stream. This update introduces several significant improvements that will enable business users to extract more value from their data and navigate it with greater ease. The release includes a complete redesign of the user interface, new integrations, and a range of features that offer exciting data exploration and analysis possibilities. Overall, this latest update represents a substantial step forward in IBM's efforts to enhance the Cognos Analytics platform and empower users to make more informed decisions based on their data.
- In January 2022, Google announced that it will launch a new augmented reality (AR) headset under Project Iris by 2024, which is in the early development stage.
- In February 2021, Microsoft introduced the HoloLens 2 Industrial Edition, an independent mixed-reality tool developed, constructed, and tested to operate in regulated industrial settings. Along with its compliance with industrial standards ratings, the HoloLens 2 Industrial Edition comes with a two-year warranty and a Rapid Replacement Program, which decreases downtime through advanced exchange and accelerated shipping.
- In March 2022, HP recently launched a new software as a service (SaaS) called ExtendXR to manage the increasing number of virtual reality (VR) headsets used in various industries, including manufacturing, industrial design, and medical training. The ExtendXR SaaS is designed to simplify the configuration of VR headsets before providing them to employees, thereby streamlining the deployment process. HP collaborated with ArborXR, an AR and VR device management company, to create the software. With ExtendXR, companies can efficiently manage their VR headsets and ensure they are configured correctly, which can ultimately enhance productivity and improve training outcomes.
- May 2022, HP has partnered with Microsoft and Valve to develop a new virtual reality (VR) headset, called the HP Reverb G2. This headset is an upgraded version of the original HP Reverb and includes several improvements such as a higher-resolution display, better audio quality, and enhanced tracking technology. The HP Reverb G2 is versatile and can be used in various applications, including gaming, industrial design, and healthcare training, and is compatible with a range of VR software and platforms.
Frequently Asked Questions (FAQ):
What is the definition of the immersive analytics market?
Immersive Analytics refers to technologies and techniques that enable users to explore and analyze complex data sets in a more intuitive and interactive way, often through the use of immersive visualization and interaction techniques. Examples of immersive analytics include data visualization tools that use VR or AR, as well as other immersive techniques like spatial computing or haptic feedback. The main goal of immersive analytics is to help users gain deeper insights and understanding from data and to support decision-making processes in a more efficient and effective way.
What is the market size of the immersive analytics market?
The immersive analytics market size is projected to grow from USD 0.8 billion in 2023 to USD 6.7 billion by 2028, at a CAGR of 51.7% during the forecast period.
What are the major drivers in the immersive analytics market?
The advancements in immersive technologies, such as virtual reality and augmented reality, have greatly improved their accessibility and affordability, thereby driving the adoption of immersive analytics solutions. The large amount and complexity of the data available for analysis will increase the demand of the immersive analytics market. The growing adoption of Head Mounted Displays (HMDs) for 3D data visualization is driving the growth of the immersive analytics market.
Who are the key players operating in the immersive analytics market?
The major players in the immersive analytics market are IBM (US), Microsoft (US), SAP (Germany), Google (US), TIBCO (US), HPE (US), Magic Leap (US), Accenture (Ireland), HTC (Taiwan), Meta (US), Tableau (US), Kognitiv Spark (Canada), Aventior (US), Immersion Analytics (US), BadVR (US), Virtualitics (US), Softcare Studios (Italy), JuJu Immersive (UK), ARSOME Technology (US), Varjo (Finland), Cognitive3D (Canada), SenseGlove (Netherlands), DPVR (China), PICO (US), Reply (Italy).
What are the opportunities for new market entrants in the immersive analytics market?
The adoption of immersive analytics will enable firms to provide a more personalized customer experience. The expanding reach of the Internet of Things (IoT) creates an opportunity for immersive analytics to be employed in visualization and analysis. The advancements in technology have had a profound impact on consumer behavior and expectations, resulting in an amplified desire for experiences that are personalized and tailored. Moreover, the trend of immersive analytics, which involves the use of augmented or virtual reality to visualize and interact with data, is gaining traction.
To speak to our analyst for a discussion on the above findings, click Speak to Analyst


- 5.1 MARKET OVERVIEW
-
5.2 MARKET DYNAMICSDRIVERS- Advancements in immersive technology and increasing digitalization- Large amount and complexity of data available for analysis to increase demand- Rising demand to analyze and understand heterogeneous data with data visualization tools- Growing adoption of head-mounted displays for 3D data visualizationRESTRAINTS- High cost to deploy infrastructure required for immersive analyticsOPPORTUNITIES- Immersive analytics to generate new revenue streams for businesses- Increasing demand for IoT to create huge potential for immersive analytics- Adoption of immersive analytics to enable firms to provide more personalized customer experienceCHALLENGES- Complex data ecosystem to lead to data breaches and security issues- Lack of analytical knowledge in workforce
- 5.3 HISTORY OF IMMERSIVE ANALYTICS
-
5.4 ECOSYSTEM ANALYSIS
- 5.5 VALUE CHAIN ANALYSIS
-
5.6 PRICING ANALYSISAVERAGE SELLING PRICE OF KEY PLAYERS, BY OFFERINGAVERAGE SELLING PRICE TREND
-
5.7 TECHNOLOGY ANALYSISRELATED TECHNOLOGIES- Virtual reality- Augmented reality- Mixed reality- Haptic technology- Machine learning and artificial intelligence- 3D modeling and animationIMPACT OF IMMERSIVE ANALYTICS ON ADJACENT TECHNOLOGIES
-
5.8 INDUSTRY USE CASESUSE CASE 1: TOYOTA COLLABORATED WITH MICROSOFT TO CREATE IMMERSIVE AND ENGAGING WORKING EXPERIENCEUSE CASE 2: AUDI TO PROVIDE NEW DRIVING EXPERIENCE TO PASSENGERS WITH IMMERSIVE TOOLSUSE CASE 3: REMOTESPARK TO HELP WORKERS TO RESOLVE REPAIR AND MAINTENANCE ISSUES REMOTELYUSE CASE 4: CANNON DESIGN SELECTED VIVE AND NVIDIA TO ENABLE REMOTE MEETINGS WITH COLLABORATIVE MULTI-USER SUPPORT
-
5.9 PATENT ANALYSISDOCUMENT OF PATENTSINNOVATION AND PATENT APPLICATIONS
-
5.10 PORTER’S FIVE FORCES ANALYSISTHREAT OF NEW ENTRANTSTHREAT OF SUBSTITUESBARGAINING POWER OF BUYERSBARGAINING POWER OF SUPPLIERSINTENSITY OF COMPETITIVE RIVALRY
-
5.11 REGULATORY LANDSCAPEISO/TC 184/SC 4ISO/ TC 184GENERAL PERSONAL DATA PROTECTION LAW (GPDP)AUSTRALIAN DIGITAL CURRENCY COMMERCE ASSOCIATION (ADCCA)DIGITAL SIGNATURE ACTGDPRFINANCIAL SERVICES MODERNIZATION ACTSOX ACTPAYMENT CARD INDUSTRY-DATA SECURITY STANDARDHEALTH INSURANCE PORTABILITY AND ACCOUNTABILITY ACTFEDERAL INFORMATION SECURITY MANAGEMENT ACT
-
5.12 KEY STAKEHOLDERS AND BUYING CRITERIAKEY STAKEHOLDERS IN BUYING PROCESSBUYING CRITERIA
- 5.13 KEY CONFERENCES AND EVENTS, 2023–2024
- 5.14 BEST PRACTICES IN IMMERSIVE ANALYTICS MARKET
-
5.15 FUTURE DIRECTIONS OF MARKET LANDSCAPEIMMERSIVE TECHNOLOGY ROADMAP TILL 2030- Short-term roadmap (2023-2025)- Mid-term roadmap (2026-2028)- Long-term roadmap (2029-2030)
-
6.1 INTRODUCTIONOFFERING: MARKET DRIVERS
-
6.2 HARDWAREORGANIZATIONS TO ADOPT NEW HARDWARE DEVICES TO IMPROVE DATA VISUALIZATION IN 3DAR/VR/MR HEADSETS- Viewing medical scans while performing surgery to drive need for MR headsetsDISPLAYS- Use of HMDs to display images in immersive environment to drive marketSENSORS & CONTROLLERS- Sensors to capture user inputs and interactions within immersive environmentOTHER HARDWARE
-
6.3 SOLUTIONSVISUALIZATION OF DATA IN 3D TO GAIN MORE COMPETITIVE ADVANTAGE AND DRIVE DEMAND FOR IMMERSIVE ANALYTICAL SOLUTIONS
-
6.4 SERVICESNEED FOR PROFESSIONAL CONSULTANT TO PROVIDE 24/7 SERVICE RESPONSEPROFESSIONAL SERVICESMANAGED SERVICES
-
7.1 INTRODUCTIONAPPLICATION: MARKET DRIVERS
-
7.2 EDUCATION & TRAININGIMMERSIVE ANALYTICS TOOLS TO ENABLE EMPLOYEES TO ENGAGE WITH SIMULATED ENVIRONMENTS AND TRAINING SCENARIOS
-
7.3 SALES & MARKETINGMARKETING STRATEGIES, SUCH AS ADJUSTING INVENTORY LEVELS AND OFFERING DISCOUNTS TO DRIVE MARKET
-
7.4 DESIGN & VISUALIZATIONREVOLUTIONIZATION OF USER INTERACTION WITH DATA TO INCREASE DEMAND FOR IMMERSIVE ANALYTICS TOOLS
-
7.5 STRATEGY PLANNINGTESTING AND ANALYZING DATA SETS AND SYSTEM BEHAVIOR IN COMPLEX SITUATIONS
- 7.6 OTHER APPLICATIONS
-
8.1 INTRODUCTIONEND-USE INDUSTRY: IMMERSIVE ANALYTICS MARKET DRIVERS
-
8.2 MEDIA & ENTERTAINMENTGROWING NEED TO IMPROVE CUSTOMER EXPERIENCEUSE CASES- Taking theme parks to next level by enriching experience of viewers- Creating engaging and immersive experiences with AR, VR, and XR technologies
-
8.3 HEALTHCAREREVOLUTIONIZATION OF MEDICAL EDUCATION, CLINICAL CARE, AND MEDICAL RESEARCH WITH IMMERSIVE ANALYTICAL TOOLSUSE CASES- Company to drive innovation in training process by leveraging power of virtual and augmented reality
-
8.4 AUTOMOTIVE & TRANSPORTATIONVISUALIZING AND ANALYZING DATA FROM SENSORS AND OTHER SOURCES TO IDENTIFY POTENTIAL ISSUESUSE CASES- Improving driving skills and preparing drivers for challenges
-
8.5 CONSTRUCTIONHELPS TO IDENTIFY POTENTIAL ISSUES BEFORE CONSTRUCTION BEGINS, REDUCING ERRORS AND IMPROVING SAFETY ON THE CONSTRUCTION SITEUSE CASES- FMT AB to use near eye-based AR technology to assist efficient construction activities
-
8.6 GOVERNMENT & DEFENSESOLUTIONS TO PROVIDE TRAINING ON USAGE OF EQUIPMENT AND PERFORM COMPLEX CONSTRUCTION TASKSUSE CASES- Use of VR technology for training on simulators in aerospace applications- Use of immersive technology such as AR for military training and development programs
- 8.7 OTHER END-USE INDUSTRIES
- 9.1 INTRODUCTION
-
9.2 NORTH AMERICANORTH AMERICA: MARKET DRIVERSNORTH AMERICA: RECESSION IMPACTUS- Strong presence of AR/VR companies to drive marketCANADA
-
9.3 EUROPEEUROPE: IMMERSIVE ANALYTICS MARKET DRIVERSEUROPE: RECESSION IMPACTUK- Continued transition toward online services due to relative ease and speed to drive marketGERMANY- Surging adoption of new technologies to drive marketFRANCE- Key focus on online advertisement and adoption of digital displayREST OF EUROPE
-
9.4 ASIA PACIFICASIA PACIFIC: IMMERSIVE ANALYTICS MARKET DRIVERSRECESSION IMPACT: ASIA PACIFICCHINA- Presence of video gaming companies and high internet penetration to impact growthSINGAPORE- Rapid adoption of innovative digital technologies to provide more intuitive and engaging data experiencesINDIA- New start-ups involved in extensive research and development of AR and VR technology to support growthJAPAN- Advancements in innovative technologies, coupled with strong IT infrastructure to drive growthAUSTRALIA AND NEW ZEALAND (ANZ)- Rising demand for immersive analytics to analyze data in e-commerce and education sectorREST OF ASIA PACIFIC
-
9.5 ROWROW: IMMERSIVE ANALYTICS MARKET DRIVERSRECESSION IMPACT: ROWMIDDLE EAST AND AFRICA- Saudi Arabia- South Africa- UAE- Rest of Middle East and AfricaLATIN AMERICA- Brazil- Mexico- Rest of Latin America

- 10.1 OVERVIEW
- 10.2 STRATEGIES ADOPTED BY KEY PLAYERS
- 10.3 COMPETITIVE SCENARIO
- 10.4 MARKET SHARE ANALYSIS OF TOP PLAYERS
- 10.5 COMPETITIVE BENCHMARKING
- 10.6 MARKET RANKING OF KEY PLAYERS IN IMMERSIVE ANALYTICS MARKET, 2023
-
10.7 COMPANY EVALUATION QUADRANTSTARSEMERGING LEADERSPERVASIVE PLAYERSPARTICIPANTS
-
10.8 STARTUP/SME EVALUATION MATRIX METHODOLOGY AND DEFINITIONSPROGRESSIVE COMPANIESRESPONSIVE COMPANIESDYNAMIC COMPANIESSTARTING BLOCKS
-
10.9 COMPETITIVE SCENARIOPRODUCT LAUNCHESDEALS
-
11.1 MAJOR PLAYERSIBM- Business overview- Products/Solutions/Services offered- Recent developments- MnM viewMICROSOFT- Business overview- Products/Solutions/Services offered- Recent developments- MnM viewGOOGLE- Business overview- Products/Solutions/Services offered- Recent developments- MnM viewHTC- Business overview- Products/Solutions/Services offered- Recent developments- MnM viewMETA- Business overview- Products/Solutions/Services offered- Recent developments- MnM viewTIBCO- Business overview- Products/Solutions/Services offered- Recent developmentsHEWLETT PACKARD ENTERPRISE(HPE)- Business overview- Products/Solutions/Services offered- Recent developmentsMAGIC LEAP- Business overview- Products/Solutions/Services offered- Recent developmentsSAP- Business overview- Products/Solutions/Services offered- Recent developmentsACCENTURE- Business overview- Products/Solutions/Services offeredTABLEAU- Business overview- Products/Solutions/Services offered- Recent developmentsREPLY
-
11.2 SMES/START-UPSKOGNITIV SPARKAVENTIORIMMERSION ANALYTICSBADVRVIRTUALITICSSOFTCARE STUDIOSJUJU IMMERSIVE LIMITEDARSOME TECHNOLOGYVARJOCOGNITIVE3DSENSEGLOVEDPVRPICO
-
12.1 ADVANCED ANALYTICS MARKETMARKET DEFINITIONMARKET OVERVIEWADVANCED ANALYTICS MARKET, BY COMPONENT
- 12.2 SOLUTION
-
12.3 SERVICESPROFESSIONAL SERVICESMANAGED SERVICES
-
12.4 AUGMENTED REALITY AND VIRTUAL REALITY MARKETMARKET DEFINITIONMARKET OVERVIEW
- 12.5 HARDWARE
-
12.6 SOFTWARESOFTWARE DEVELOPMENT KITS- Case study: Arcore for TendarCLOUD-BASED SERVICES- Case study: VR Group boosts cloud application performance and reduces costs
- 13.1 DISCUSSION GUIDE
- 13.2 KNOWLEDGESTORE: MARKETSANDMARKETS’ SUBSCRIPTION PORTAL
- 13.3 CUSTOMIZATION OPTIONS
- 13.4 RELATED REPORTS
- 13.5 AUTHOR DETAILS
- TABLE 1 USD EXCHANGE RATE, 2020–2022
- TABLE 2 FACTOR ANALYSIS
- TABLE 3 IMMERSIVE ANALYTICS MARKET: ECOSYSTEM
- TABLE 4 PRICING MODELS AND INDICATIVE PRICE POINTS, 2022–2023
- TABLE 5 PATENTS FILED, 2018–2023
- TABLE 6 TOP 10 PATENT OWNERS IN MARKET, 2018–2023
- TABLE 7 LIST OF FEW PATENTS IN MARKET, 2018–2023
- TABLE 8 MARKET: PORTER’S FIVE FORCES MODEL
- TABLE 9 NORTH AMERICA: LIST OF REGULATORY BODIES, GOVERNMENT AGENCIES, AND OTHER ORGANIZATIONS
- TABLE 10 EUROPE: LIST OF REGULATORY BODIES, GOVERNMENT AGENCIES, AND OTHER ORGANIZATIONS
- TABLE 11 ASIA PACIFIC: LIST OF REGULATORY BODIES, GOVERNMENT AGENCIES, A ND OTHER ORGANIZATIONS
- TABLE 12 MIDDLE EAST AND AFRICA: LIST OF REGULATORY BODIES, GOVERNMENT AGENCIES, AND OTHER ORGANIZATIONS
- TABLE 13 LATIN AMERICA: LIST OF REGULATORY BODIES, GOVERNMENT AGENCIES, AND OTHER ORGANIZATIONS
- TABLE 14 INFLUENCE OF STAKEHOLDERS ON BUYING PROCESS
- TABLE 15 KEY BUYING CRITERIA
- TABLE 16 IMMERSIVE ANALYTICS MARKET: DETAILED LIST OF CONFERENCES AND EVENTS
- TABLE 17 MARKET, BY OFFERING, 2023–2028 (USD MILLION)
- TABLE 18 MARKET, BY HARDWARE, 2023–2028 (USD MILLION)
- TABLE 19 AR/VR/MR HEADSETS: MARKET, BY REGION, 2023–2028 (USD MILLION)
- TABLE 20 DISPLAYS: MARKET, BY REGION, 2023–2028 (USD MILLION)
- TABLE 21 SENSORS & CONTROLLERS: MARKET, BY REGION, 2023–2028 (USD MILLION)
- TABLE 22 OTHER HARDWARE: MARKET, BY REGION, 2023–2028 (USD MILLION)
- TABLE 23 MARKET, BY SERVICE, 2023–2028 (USD MILLION)
- TABLE 24 PROFESSIONAL SERVICES: MARKET, BY REGION, 2023–2028 (USD MILLION)
- TABLE 25 MANAGED SERVICES: MARKET, BY REGION, 2023–2028 (USD MILLION)
- TABLE 26 MARKET, BY END-USE INDUSTRY, 2023–2028 (USD MILLION)
- TABLE 27 MEDIA & ENTERTAINMENT: MARKET, BY REGION, 2023–2028 (USD MILLION)
- TABLE 28 HEALTHCARE: MARKET, BY REGION, 2023–2028 (USD MILLION)
- TABLE 29 AUTOMOTIVE & TRANSPORTATION: MARKET, BY REGION, 2023–2028 (USD MILLION)
- TABLE 30 CONSTRUCTION: MARKET, BY REGION, 2023–2028 (USD MILLION)
- TABLE 31 GOVERNMENT & DEFENSE: MARKET, BY REGION, 2023–2028 (USD MILLION)
- TABLE 32 OTHER END-USE INDUSTRIES: MARKET, BY REGION, 2023–2028 (USD MILLION)
- TABLE 33 MARKET, BY REGION, 2023–2028 (USD MILLION)
- TABLE 34 NORTH AMERICA: IMMERSIVE ANALYTICS MARKET, BY OFFERING, 2023–2028 (USD MILLION)
- TABLE 35 NORTH AMERICA: MARKET, BY HARDWARE, 2023–2028 (USD MILLION)
- TABLE 36 NORTH AMERICA: MARKET, BY SERVICE, 2023–2028 (USD MILLION)
- TABLE 37 NORTH AMERICA: MARKET, BY END-USE INDUSTRY, 2023–2028 (USD MILLION)
- TABLE 38 NORTH AMERICA: MARKET, BY COUNTRY, 2023–2028 (USD MILLION)
- TABLE 39 US: MARKET, BY OFFERING, 2023–2028 (USD MILLION)
- TABLE 40 US: MARKET, BY HARDWARE, 2023–2028 (USD MILLION)
- TABLE 41 US: MARKET, BY SERVICE, 2023–2028 (USD MILLION)
- TABLE 42 US: MARKET, BY END-USE INDUSTRY, 2023–2028 (USD MILLION)
- TABLE 43 EUROPE: IMMERSIVE ANALYTICS MARKET, BY OFFERING, 2023–2028 (USD MILLION)
- TABLE 44 EUROPE: MARKET, BY HARDWARE, 2023–2028 (USD MILLION)
- TABLE 45 EUROPE: MARKET, BY SERVICE, 2023–2028 (USD MILLION)
- TABLE 46 EUROPE: MARKET, BY END-USE INDUSTRY, 2023–2028 (USD MILLION)
- TABLE 47 EUROPE: MARKET, BY COUNTRY, 2023–2028 (USD MILLION)
- TABLE 48 UK: MARKET, BY OFFERING, 2023–2028 (USD MILLION)
- TABLE 49 UK: MARKET, BY HARDWARE, 2023–2028 (USD MILLION)
- TABLE 50 UK: MARKET, BY SERVICE, 2023–2028 (USD MILLION)
- TABLE 51 UK: MARKET, BY END-USE INDUSTRY, 2023–2028 (USD MILLION)
- TABLE 52 ASIA PACIFIC: MARKET, BY OFFERING, 2023–2028 (USD MILLION)
- TABLE 53 ASIA PACIFIC: MARKET, BY HARDWARE, 2023–2028 (USD MILLION)
- TABLE 54 ASIA PACIFIC: MARKET, BY SERVICE, 2023–2028 (USD MILLION)
- TABLE 55 ASIA PACIFIC: MARKET, BY END-USE INDUSTRY, 2023–2028 (USD MILLION)
- TABLE 56 ASIA PACIFIC: MARKET, BY COUNTRY, 2023–2028 (USD MILLION)
- TABLE 57 INDIA: IMMERSIVE ANALYTICS MARKET, BY OFFERING, 2023–2028 (USD MILLION)
- TABLE 58 INDIA: MARKET, BY HARDWARE, 2023–2028 (USD MILLION)
- TABLE 59 INDIA: MARKET, BY SERVICE, 2023–2028 (USD MILLION)
- TABLE 60 INDIA: MARKET, BY END-USE INDUSTRY, 2023–2028 (USD MILLION)
- TABLE 61 ROW: MARKET, BY OFFERING, 2023–2028 (USD MILLION)
- TABLE 62 ROW: MARKET, BY HARDWARE, 2023–2028 (USD MILLION)
- TABLE 63 ROW: MARKET, BY SERVICE, 2023–2028 (USD MILLION)
- TABLE 64 ROW: MARKET, BY END-USE INDUSTRY, 2023–2028 (USD MILLION)
- TABLE 65 ROW: MARKET, BY COUNTRY, 2023–2028 (USD MILLION)
- TABLE 66 OVERVIEW OF STRATEGIES DEPLOYED BY KEY PLAYERS IN MARKET
- TABLE 67 MARKET: DEGREE OF COMPETITION
- TABLE 68 PRODUCT FOOTPRINT WEIGHTAGE
- TABLE 69 MARKET: COMPETITIVE BENCHMARKING OF PLAYERS BY OFFERING, INDUSTRY, AND REGION
- TABLE 70 IMMERSIVE ANALYTICS MARKET: DETAILED LIST OF KEY STARTUP/SME
- TABLE 71 PRODUCT LAUNCHES, JANUARY 2019–MARCH 2023
- TABLE 72 DEALS, JANUARY 2019–MARCH 2023
- TABLE 73 IBM: BUSINESS OVERVIEW
- TABLE 74 IBM: PRODUCTS/SOLUTIONS/SERVICES OFFERED
- TABLE 75 IBM: PRODUCT LAUNCHES
- TABLE 76 IBM: DEALS
- TABLE 77 MICROSOFT: BUSINESS OVERVIEW
- TABLE 78 MICROSOFT: PRODUCTS/SOLUTIONS/SERVICES OFFERED
- TABLE 79 MICROSOFT: PRODUCT LAUNCHES
- TABLE 80 GOOGLE: BUSINESS OVERVIEW
- TABLE 81 GOOGLE: PRODUCT/SOLUTIONS/SERVICES OFFERED
- TABLE 82 GOOGLE: PRODUCT LAUNCHES AND ENHANCEMENTS
- TABLE 83 GOOGLE: DEALS
- TABLE 84 HTC: BUSINESS OVERVIEW
- TABLE 85 HTC: PRODUCTS/SOLUTIONS/SERVICES OFFERED
- TABLE 86 HTC: PRODUCT LAUNCHES
- TABLE 87 HTC: DEALS
- TABLE 88 META: BUSINESS OVERVIEW
- TABLE 89 META: SOLUTIONS/SERVICES OFFERED
- TABLE 90 META: PRODUCT LAUNCHES AND ENHANCEMENTS
- TABLE 91 META: DEALS
- TABLE 92 TIBCO: BUSINESS OVERVIEW
- TABLE 93 TIBCO: PRODUCTS/SOLUTIONS/SERVICES OFFERED
- TABLE 94 TIBCO: PRODUCT LAUNCHES
- TABLE 95 TIBCO: DEALS
- TABLE 96 HPE: BUSINESS OVERVIEW
- TABLE 97 HPE: PRODUCTS/SOLUTIONS/SERVICES OFFERED
- TABLE 98 HPE: PRODUCT LAUNCHES
- TABLE 99 HPE: DEALS
- TABLE 100 MAGIC LEAP: BUSINESS OVERVIEW
- TABLE 101 MAGIC LEAP: PRODUCTS/SOLUTIONS/SERVICES OFFERED
- TABLE 102 MAGIC LEAP: PRODUCT LAUNCHES
- TABLE 103 MAGIC LEAP: DEALS
- TABLE 104 SAP: BUSINESS OVERVIEW
- TABLE 105 SAP: PRODUCTS/SOLUTIONS/SERVICES OFFERED
- TABLE 106 SAP: PRODUCT LAUNCHES
- TABLE 107 ACCENTURE: BUSINESS OVERVIEW
- TABLE 108 ACCENTURE: PRODUCTS/SOLUTIONS/SERVICES OFFERED
- TABLE 109 TABLEAU: BUSINESS OVERVIEW
- TABLE 110 TABLEAU: SOLUTIONS/SERVICES OFFERED
- TABLE 111 TABLEAU: DEALS
- TABLE 112 ADVANCED ANALYTICS MARKET, BY COMPONENT, 2016–2020 (USD MILLION)
- TABLE 113 ADVANCED ANALYTICS MARKET, BY COMPONENT, 2021–2026 (USD MILLION)
- TABLE 114 SOLUTION: ADVANCED ANALYTICS MARKET, BY REGION, 2016–2020 (USD MILLION)
- TABLE 115 SOLUTION: ADVANCED ANALYTICS MARKET, BY REGION, 2021–2026 (USD MILLION)
- TABLE 116 ADVANCED ANALYTICS MARKET, BY SERVICE, 2016–2020 (USD MILLION)
- TABLE 117 ADVANCED ANALYTICS MARKET, BY SERVICE, 2021–2026 (USD MILLION)
- TABLE 118 SERVICES: ADVANCED ANALYTICS MARKET, BY REGION, 2016–2020 (USD MILLION)
- TABLE 119 SERVICES: ADVANCED ANALYTICS MARKET, BY REGION, 2021–2026 (USD MILLION)
- TABLE 120 AUGMENTED REALITY MARKET, BY OFFERING, 2018–2021 (USD MILLION)
- TABLE 121 AUGMENTED REALITY MARKET, BY OFFERING, 2022–2027 (USD MILLION)
- TABLE 122 AUGMENTED REALITY MARKET, BY HARDWARE COMPONENT, 2018–2021 (USD MILLION)
- TABLE 123 AUGMENTED REALITY MARKET, BY HARDWARE COMPONENT, 2022–2027 (USD MILLION)
- TABLE 124 VIRTUAL REALITY MARKET, BY OFFERING, 2018–2021 (USD MILLION)
- TABLE 125 VIRTUAL REALITY MARKET, BY OFFERING, 2022–2027 (USD MILLION)
- TABLE 126 VIRTUAL REALITY MARKET, BY HARDWARE, 2018–2021 (USD MILLION)
- TABLE 127 VIRTUAL REALITY MARKET, HARDWARE, 2022–2027 (USD MILLION)
- TABLE 128 AUGMENTED REALITY MARKET FOR SOFTWARE, BY APPLICATION, 2018–2021 (USD MILLION)
- TABLE 129 AUGMENTED REALITY MARKET FOR SOFTWARE, BY APPLICATION, 2022–2027 (USD MILLION)
- FIGURE 1 MARKET SEGMENTATION
- FIGURE 2 MARKET: RESEARCH DESIGN
- FIGURE 3 APPROACH USED FOR MARKET SIZE ESTIMATION
- FIGURE 4 MARKET SIZE ESTIMATION METHODOLOGY (APPROACH 1): SUPPLY-SIDE ANALYSIS OF REVENUE FROM PLATFORMS AND SERVICES
- FIGURE 5 BOTTOM-UP APPROACH
- FIGURE 6 MARKET SIZE ESTIMATION METHODOLOGY (APPROACH 1), BOTTOM-UP (SUPPLY SIDE): COLLECTIVE REVENUE OF IMMERSIVE ANALYTICS VENDORS
- FIGURE 7 TOP-DOWN APPROACH
- FIGURE 8 MARKET SIZE ESTIMATION METHODOLOGY: DEMAND-SIDE ANALYSIS
- FIGURE 9 DATA TRIANGULATION
- FIGURE 10 LIMITATIONS
- FIGURE 11 IMMERSIVE ANALYTICS MARKET, 2023–2028 (USD MILLION)
- FIGURE 12 MARKET, BY OFFERING, 2023 VS. 2028 (USD MILLION)
- FIGURE 13 MARKET, BY END-USE INDUSTRY, 2023 VS. 2028 (USD MILLION)
- FIGURE 14 MARKET, BY REGION, 2023
- FIGURE 15 INCREASING USE OF DIGITALIZED PLATFORMS TO DRIVE MARKET GROWTH
- FIGURE 16 PROFESSIONAL SERVICES SEGMENT TO ACCOUNT FOR LARGER MARKET SIZE
- FIGURE 17 PROFESSIONAL SERVICES SEGMENT TO ACCOUNT FOR LARGER MARKET SIZE
- FIGURE 18 PROFESSIONAL SERVICES SEGMENT TO ACCOUNT FOR LARGER MARKET SIZE
- FIGURE 19 ASIA PACIFIC TO WITNESS HIGHEST GROWTH DURING FORECAST PERIOD
- FIGURE 20 DRIVERS, RESTRAINTS, OPPORTUNITIES, AND CHALLENGES: MARKET
- FIGURE 21 EVOLUTION OF IMMERSIVE ANALYTICS
- FIGURE 22 IMMERSIVE MARKET: ECOSYSTEM
- FIGURE 23 MARKET: VALUE CHAIN ANALYSIS
- FIGURE 24 TOTAL NUMBER OF PATENTS GRANTED, 2018–2023
- FIGURE 25 TOP 10 COMPANIES WITH HIGHEST NUMBER OF PATENT APPLICATIONS
- FIGURE 26 TRENDS/DISRUPTIONS IMPACTING BUYERS/CLIENTS OF MARKET
- FIGURE 27 INFLUENCE OF STAKEHOLDERS ON BUYING PROCESS
- FIGURE 28 KEY BUYING CRITERIA
- FIGURE 29 SERVICES SEGMENT TO GROW AT HIGHEST CAGR DURING FORECAST PERIOD
- FIGURE 30 MEDIA & ENTERTAINMENT SEGMENT TO GROW AT HIGHEST CAGR DURING FORECAST PERIOD
- FIGURE 31 IMMERSIVE ANALYTICS MARKET: REGIONAL SNAPSHOT (2023)
- FIGURE 32 ASIA PACIFIC TO GROW AT HIGHEST CAGR DURING FORECAST PERIOD
- FIGURE 33 NORTH AMERICA: MARKET SNAPSHOT
- FIGURE 34 ASIA PACIFIC: MARKET SNAPSHOT
- FIGURE 35 MARKET RANKING OF KEY PLAYERS, 2023
- FIGURE 36 COMPANY EVALUATION MATRIX: CRITERIA WEIGHTAGE
- FIGURE 37 MARKET COMPANY EVALUATION MATRIX, 2023
- FIGURE 38 STARTUP/SME EVALUATION MATRIX: CRITERIA WEIGHTAGE
- FIGURE 39 STARTUP/SME MARKET EVALUATION MATRIX, 2023
- FIGURE 40 IBM: COMPANY SNAPSHOT
- FIGURE 41 MICROSOFT: COMPANY SNAPSHOT
- FIGURE 42 GOOGLE: COMPANY SNAPSHOT
- FIGURE 43 HTC: COMPANY SNAPSHOT
- FIGURE 44 META: COMPANY SNAPSHOT
- FIGURE 45 HPE: COMPANY SNAPSHOT
- FIGURE 46 SAP: COMPANY SNAPSHOT
- FIGURE 47 ACCENTURE: COMPANY SNAPSHOT
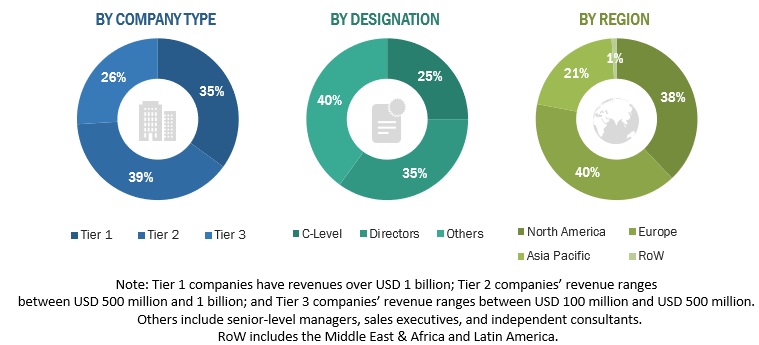
The immersive analytics market study extensively used secondary sources, directories, and databases, such as D&B Hoovers, Bloomberg Businessweek, and Factiva. Other market-related sources, such as journals and white papers from industry associations, were also considered while conducting the secondary research. Primary sources were mainly industry experts from core and related industries, preferred system developers, service providers, System Integrators (SIs), resellers, partners, and organizations related to the various segments of the industry’s value chain. In-depth interviews were conducted with various primary respondents to obtain and verify critical qualitative and quantitative information and assess the market’s prospects. These respondents included key industry participants, subject matter experts, C-level executives of key market players, and industry consultants.
Secondary Research
In the secondary research process, various secondary sources were referred to for identifying and collecting information for the study. The secondary sources included annual reports, press releases, investor presentations of companies, white papers, certified publications, and articles from recognized associations and government publishing sources. Several journals, such as the Institute of Electrical and Electronics Engineers (IEEE), ScienceDirect, ResearchGate, Academic Journals, and Scientific.Net, were also referred. Secondary research was mainly used to obtain key information about industry insights, the market’s monetary chain, the overall pool of key players, market classification, and segmentation according to industry trends to the bottom-most level, regional markets, and key developments from both markets and technology-oriented perspectives.
Primary Research
In the primary research process, various primary sources from both supply and demand sides were interviewed to obtain qualitative and quantitative information for the report. The primary sources from the supply side included industry experts, such as Chief Executive Officers (CEOs), Chief Technology Officers (CTOs), Chief Operating Officers (COOs), Vice Presidents (VPs), marketing directors, technology and innovation directors, and related key executives from various key companies and organizations operating in the immersive analytics market. The primary sources from the demand side included immersive analytics end users, network administrators/consultants/specialists, Chief Information Officers (CIOs), and subject-matter experts from enterprises and government associations.
The Breakup of Primary Research:
To know about the assumptions considered for the study, download the pdf brochure
|
Company Name |
Designation |
|
BadVR |
Senior Manager |
|
IBM |
Analytic Expert |
Market Size Estimation
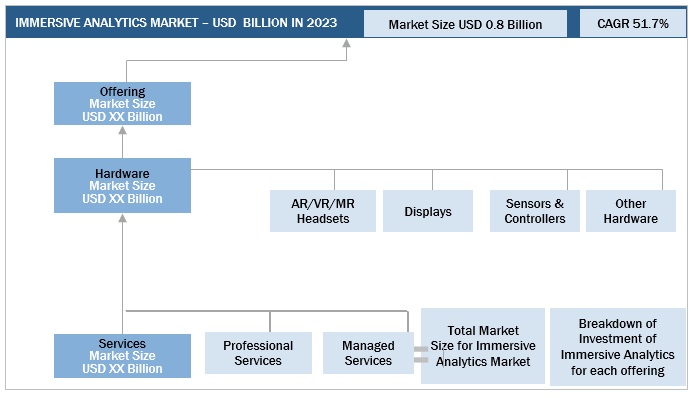
Multiple approaches were adopted to estimate and forecast the market size of the immersive analytics market. The first approach involves the estimation of market size by summing up the revenue generated by companies through the sale of immersive analytics offerings, such as hardware, solutions, and services.
Both top-down and bottom-up approaches were used to estimate and validate the total size of the market. These methods were extensively used to estimate the size of various segments in the market. The research methodology used to estimate the market size includes the following:
- Analyzing the size of the global market by identifying segment and subsegment revenue related to the market
- Estimating ASP of immersive analytics
- Estimating the size of other immersive analytics technology providers
- Estimating immersive analytics market size
Immersive Analytics Market Size: Bottom-Up Approach
To know about the assumptions considered for the study, Request for Free Sample Report
Immersive analytics Market Size: Top-Down Approach

Data Triangulation
After arriving at the overall market size, the immersive analytics market was divided into several segments and subsegments. A data triangulation procedure was used wherever applicable to complete the overall market engineering process and arrive at the exact statistics for all segments and subsegments. The data was triangulated by studying various factors and trends from the demand and supply sides. Along with data triangulation and market breakdown, the market size was validated by the top-down and bottom-up approaches.
Market Definition
Immersive Analytics refers to technologies and techniques that enable users to explore and analyze complex data sets in a more intuitive and interactive way, often through the use of immersive visualization and interaction techniques. Examples of immersive analytics include data visualization tools that use VR or AR, as well as other immersive techniques like spatial computing or haptic feedback. The main goal of immersive analytics is to help users gain deeper insights and understanding from data and to support decision-making processes in a more efficient and effective way.
Key Stakeholders
- Senior Management
- Finance/Procurement Department
- R&D Department
- IT Department
Report Objectives
- To determine, segment, and forecast the global immersive analytics market by offering, application, vertical, and region in terms of value
- To forecast the size of the market segments with respect to five main regions: North America, Europe, Asia Pacific, Rest of World (RoW)
- To provide detailed information about the major factors (drivers, opportunities, threats, and challenges) influencing the growth of the market
- To study the complete value chain and related industry segments and perform a value chain analysis of the market landscape
- To strategically analyze the macro and micromarkets1 with respect to individual growth trends, prospects, and contributions to the total market
- To analyze the industry trends, pricing data, patents, and innovations related to the market
- To analyze the opportunities for stakeholders by identifying the high-growth segments of the immersive analytics market
- To profile the key players in the market and comprehensively analyze their market share/ranking and core competencies2
- To track and analyze competitive developments, such as mergers & acquisitions, product launches & developments, partnerships, agreements, collaborations, business expansions, and research & development activities
Available Customizations
With the given market data, MarketsandMarkets offers customizations as per the company’s specific needs. The following customization options are available for the report:
Geographic Analysis
- Further breakup of the Asia Pacific market into countries contributing 75% to the regional market size
- Further breakup of the North American market into countries contributing 75% to the regional market size
- Further breakup of the European market into countries contributing 75% to the regional market size
Company Information
- Detailed analysis and profiling of additional market players (up to 5)


Growth opportunities and latent adjacency in Immersive Analytics Market