Immunoprecipitation Market by Product (Kit, Reagent (Antibodies, Magnetic Buffer)), Type (Individual IP, Coimmunoprecipitation, CHIP), End User (Academics, Research Institutes, Pharmaceutical and Biotechnology Companies) & Region - Global Forecast to 2024


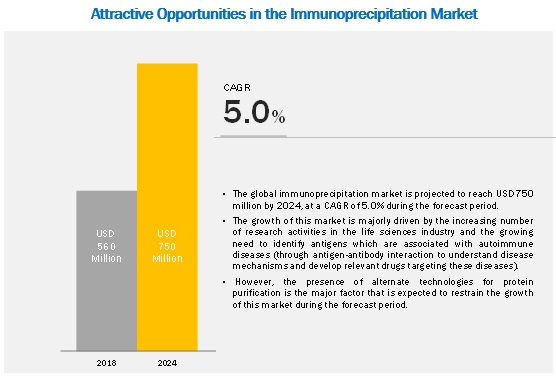
The immunoprecipitation market is projected to reach USD 750 million by 2024, at a CAGR of 5.0%. The growth of this market is majorly driven by the increasing research in the life sciences industry and the growing need to identify antigens associated with autoimmune diseases (through antigen-antibody interaction to understand disease mechanisms and develop relevant drugs targeting these diseases).
By product type, kits are expected to be the fastest-growing segment in the immunoprecipitation market during the forecast period.
The kits segment is projected to grow at the highest CAGR between 2018 and 2024. Growth in this market can be attributed to factors such as the requirement for repeat purchase of kits, coupled with the increasing number of IP assays to isolate and purify antigens.
By type, the Individual IP segment is growing at the highest rate.
The individual IP segment is projected to grow at the highest rate in the market, by type. The increasing use of IP in studying protein-protein interactions, to detect the presence of an antigen, and to determine the relative quantity of an antigen are driving the use of individual IP in various research studies during the forecast period.
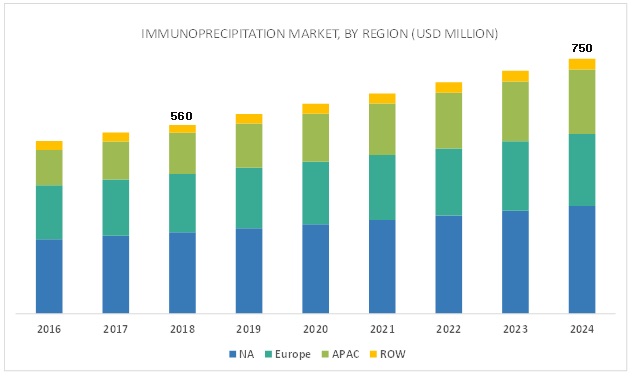
The market in the Asia Pacific is growing at the highest CAGR during the forecast period.
The Asia Pacific is estimated to grow at the highest CAGR during the forecast period. Increasing investments by governments and industries, growing biotechnology research in these regions, and rising awareness about personalized therapeutics are expected to drive the growth of these markets during the forecast period.
Major players of the immunoprecipitation market include Thermo Fisher Scientific (US), Abcam (UK), Bio-Rad Laboratories (US), Merck KGaA (Germany), GenScript. (US), and BioLegend (US), Cell Signaling Technology (US), Rockland Immunochemicals (US), Takara Bio (Japan), and Geno Technology (US).
Immunoprecipitation Market Scope
|
Report Metric |
Details |
|
Market size available for years |
2016–2024 |
|
Base year considered |
2017 |
|
Forecast period |
2018–2024 |
|
Forecast units |
Values (USD Million) |
|
Segments covered |
Product, Type, End User, and Region |
|
Geographies covered |
North America, Europe, APAC, and RoW |
|
Companies covered |
Thermo Fisher Scientific (US), Abcam (UK), and Merck KGaA (Germany). 10 major players covered, in total |
Report categorizes the market into the following segments and subsegments:
By Product
- Kits
-
Reagents, by type
-
Antibodies, by type
- Primary Antibodies
- Secondary Antibodies
-
Beads, by type
- Agarose Beads
- Magnetic Beads
- Buffers
-
Antibodies, by type
- Accessories
By Type
- Individual IP
- co-IP
- ChIP
- RIP
By End User
- Academic & Research Institutes
- Pharmaceutical and Biopharmaceutical Companies
- Contract Research Organizations
By Region
-
North America
- US
- Canada
- Europe
- Asia Pacific
- RoW
Recent Developments:
- In 2018, Thermo Fisher Scientific opened its new bioprocess design center in Shanghai to connect and collaborate with biologic developers to design optimal bioprocessing solutions.
- In 2018, Abcam entered into an agreement with Roche, a leading biotech company, under which Abcam obtained the exclusive rights to the product portfolio of Spring, which consists of 243 recombinant rabbit monoclonal antibodies and 500 additional antibody products.
- In 2018, GenScript Biotech opened a contract development and manufacturing organization (CDMO) in Zhenjiang, China. This will help the company expand its presence in the Asia Pacific region.
- In 2016, Thermo Fisher Scientific opened its new global headquarters at Waltham, Massachusetts, which helped the company connect its global hub to centers of excellence around the world for real-time collaboration serving scientific and healthcare communities.
Key questions addressed by the report:
- Who are the major market players in the immunoprecipitation market?
- What are the regional growth trends and the largest revenue-generating regions for immunoprecipitation market?
- What are the major drivers and challenges in the immunoprecipitation market?
- What are the major product segments in the immunoprecipitation market?
- What are the major type segments in the immunoprecipitation market?
- What are the major end users for immunoprecipitation products?
Frequently Asked Questions (FAQ):
What is the size of Immunoprecipitation Market ?
The immunoprecipitation market is projected to reach USD 750 million by 2024, growing at a CAGR of 5.0%
What are the major growth factors of Immunoprecipitation Market ?
The growth of this market is majorly driven by the increasing research in the life sciences industry and the growing need to identify antigens associated with autoimmune diseases (through antigen-antibody interaction to understand disease mechanisms and develop relevant drugs targeting these diseases).
Who all are the prominent players of Immunoprecipitation Market ?
Major players of the immunoprecipitation market include Thermo Fisher Scientific (US), Abcam (UK), Bio-Rad Laboratories (US), Merck KGaA (Germany), GenScript. (US), and BioLegend (US), Cell Signaling Technology (US), Rockland Immunochemicals (US), Takara Bio (Japan), and Geno Technology (US). .
To speak to our analyst for a discussion on the above findings, click Speak to Analyst
 Exclusive indicates content/data unique to MarketsandMarkets and not available with any competitors.
Table of Contents
1 Introduction (Page No. - 13)
1.1 Objectives of the Study
1.2 Market Definition
1.3 Market Scope
1.3.1 Markets Covered
1.3.2 Years Considered for the Study
1.4 Currency
1.5 Stakeholders
1.6 Limitations
2 Research Methodology (Page No. - 16)
2.1 Research Approach
2.1.1 Secondary Research
2.1.1.1 Key Data From Secondary Sources
2.1.2 Primary Research
2.1.2.1 Key Data From Primary Sources
2.1.2.2 Break Down of Primaries
2.1.2.3 Key Industry Insights
2.2 Market Size Estimation
2.3 Data Triangulation Approach
2.4 Assumptions for the Study
3 Executive Summary (Page No. - 24)
4 Premium Insights (Page No. - 27)
4.1 Immunoprecipitation: Market Overview
4.2 Immunoprecipitation Market, By Product (2018–2024)
4.3 North America: Immunoprecipitation Market, By Type (2018)
5 Market Overview (Page No. - 30)
5.1 Introduction
5.2 Market Dynamics
5.2.1 Market Drivers
5.2.1.1 Increasing Number of Life Sciences Research Activities
5.2.1.2 Growing Need to Identify Antigens That are Associated With Autoimmune Diseases
5.2.2 Restraints
5.2.2.1 Presence of Alternative Technologies
5.2.3 Opportunities
5.2.3.1 Increasing Focus on Biomarker Discovery
5.2.4 Challenges
5.2.4.1 Quality Concerns Over Research Antibodies
6 Immunoprecipitation Market, By Type (Page No. - 34)
6.1 Introduction
6.2 Individual Immunoprecipitation
6.2.1 Increasing Demand for Biologics is Driving the Growth of the Market
6.3 Co-Immunoprecipitation
6.3.1 Increasing Use of Co-Ip to Study Protein Complexes Forms A Key Market Driver
6.4 Chromatin Immunoprecipitation
6.4.1 Growing Adoption of High-Throughput Technologies Will Contribute to Adoption of Chip
6.5 Rna Immunoprecipitation
6.5.1 Availability of Government Funding Will Drive the Adoption of Rip Kits
7 Immunoprecipitation Market, By Product (Page No. - 40)
7.1 Introduction
7.2 Kits
7.2.1 Kits Segment to Account for the Largest Share of the Immunoprecipitation Market During the Forecast Period
7.3 Reagents
7.3.1 Antibodies
7.3.1.1 Antibodies, By Type
7.3.1.1.1 Primary Antibodies
7.3.1.1.1.1 Primary Antibodies to Account for the Largest Share of the Immunoprecipitation Antibodies Market During the Forecast Period
7.3.1.1.2 Secondary Antibodies
7.3.1.1.2.1 Low Cost of Production - A Major Factor Driving the Growth of the Secondary Antibodies Market
7.3.2 Beads
7.3.2.1 Beads, By Type
7.3.2.2 Agarose Beads
7.3.2.2.1 High Binding Capacity and Lower Cost – Factors Supporting the Wide Use of Agarose Beads in Research Laboratories
7.3.2.3 Magnetic Beads
7.3.2.3.1 Magnetic Bead-Based Separation Helps Increase Throughput and Reduces Hands-On Time
7.3.2.4 Buffers
7.3.2.4.1 Buffer Solutions Play an Important Role in Maintaining Ph Balance in Ip Assays
7.4 Accessories
8 Immunoprecipitation Market, By End User (Page No. - 53)
8.1 Introduction
8.2 Academic & Research Institutes
8.2.1 Academic & Research Institutes are the Largest End Users of Immunoprecipitation
8.3 Pharmaceutical & Biotechnology Companies
8.3.1 Increasing Demand for Protein-Based Drugs to Drive the Demand for Immunoprecipitation in This End-User Segment
8.4 Contract Research Organizations
8.4.1 Growth in Outsourcing of Protein Purification Activities - A Major Factor Driving the Demand for Immunoprecipitation Technologies in Contract Research Organizations
9 Immunoprecipitation Market, By Region (Page No. - 59)
9.1 Introduction
9.2 North America
9.2.1 Us
9.2.1.1 Growing Research Will Drive Market Growth
9.2.2 Canada
9.2.2.1 Increasing Genomics and Proteomics Research to Drive the Adoption of Immunoprecipitation in the Coming Years
9.3 Europe
9.3.1 Growth of the Life Sciences Sector Will Support the Demand for Immunoprecipitation
9.4 Asia Pacific
9.4.1 Increasing Demand for Novel Antibody and Protein-Based Drugs Support Market Growth in the Asia Pacific
9.5 Rest of the World
10 Competitive Landscape (Page No. - 79)
10.1 Overview
10.2 Vendor Benchmarking
10.3 Competitive Leadership Mapping
10.3.1 Visionary Leaders
10.3.2 Innovators
10.3.3 Dynamic Differentiators
10.3.4 Emerging Companies
10.4 Market Ranking Analysis, 2017
10.5 Competitive Situation and Trends
10.5.1 Expansions
10.5.2 Collaborations, Partnerships, and Agreements
10.5.3 Product Launches
10.5.4 Acquisitions
11 Company Profiles (Page No. - 85)
(Business Overview, Products Offered, Recent Developments, MnM View)*
11.1 Thermo Fisher Scientific
11.2 Abcam
11.3 Genscript
11.4 Merck KGaA
11.5 Bio-Rad Laboratories
11.6 Biolegend
11.7 Takara Bio
11.8 Rockland Immunochemicals
11.9 Cell Signaling Technology
11.10 Geno Technology
*Details on Business Overview, Products Offered, Recent Developments, MnM View Might Not Be Captured in Case of Unlisted Companies.
12 Appendix (Page No. - 107)
12.1 Discussion Guide
12.2 Knowledge Store: Marketsandmarkets’ Subscription Portal
12.3 Available Customizations
12.4 Related Reports
12.5 Author Details
List of Tables (82 Tables)
Table 1 Immunoprecipitation Market, By Type, 2016–2024 (USD Million)
Table 2 Individual Immunoprecipitation Market, By Region, 2016–2024 (USD Million)
Table 3 North America: Individual Immunoprecipitation Market, By Country, 2016–2024 (USD Million)
Table 4 Co-Immunoprecipitation Market, By Region, 2016–2024 (USD Million)
Table 5 North America: Co-Immunoprecipitation Market, By Country, 2016–2024 (USD Million)
Table 6 Chromatin Immunoprecipitation Market, By Region, 2016–2024 (USD Million)
Table 7 North America: Chromatin Immunoprecipitation Market, By Country, 2016–2024 (USD Million)
Table 8 Rna Immunoprecipitation Market, By Region, 2016–2024 (USD Million)
Table 9 North America: Rna Immunoprecipitation Market, By Country, 2016–2024 (USD Million)
Table 10 Immunoprecipitation Market, By Product, 2016–2024 (USD Million)
Table 11 Immunoprecipitation Kits Market, By Region, 2016–2024 (USD Million)
Table 12 North America: Immunoprecipitation Kits Market, By Country, 2016–2024 (USD Million)
Table 13 Immunoprecipitation Reagents Market, By Region, 2016–2024 (USD Million)
Table 14 North America: Immunoprecipitation Reagents Market, By Country, 2016–2024 (USD Million)
Table 15 Immunoprecipitation Reagents Market, By Type, 2016–2024 (USD Million)
Table 16 Immunoprecipitation Antibodies Market, By Region, 2016–2024 (USD Million)
Table 17 North America: Immunoprecipitation Antibodies Market, By Country, 2016–2024 (USD Million)
Table 18 Immunoprecipitation Antibodies Market, By Type, 2016–2024 (USD Million)
Table 19 Immunoprecipitation Market for Primary Antibodies, By Region, 2016–2024 (USD Million)
Table 20 North America: Immunoprecipitation Market for Primary Antibodies, By Country, 2016–2024 (USD Million)
Table 21 Immunoprecipitation Market for Secondary Antibodies, By Region, 2016–2024 (USD Million)
Table 22 North America: Immunoprecipitation Market for Secondary Antibodies, By Country, 2016–2024 (USD Million)
Table 23 Immunoprecipitation Beads Market, By Region, 2016–2024 (USD Million)
Table 24 North America: Immunoprecipitation Beads Market, By Country, 2016–2024 (USD Million)
Table 25 Immunoprecipitation Beads Market, By Type, 2016–2024 (USD Million)
Table 26 Immunoprecipitation Market for Agarose Beads, By Region, 2016–2024 (USD Million)
Table 27 North America: Immunoprecipitation Market for Agarose Beads, By Country, 2016–2024 (USD Million)
Table 28 Immunoprecipitation Market for Magnetic Beads, By Region, 2016–2024 (USD Million)
Table 29 North America: Immunoprecipitation Market for Magnetic Beads, By Country, 2016–2024 (USD Million)
Table 30 Immunoprecipitation Buffers Market, By Region, 2016–2024 (USD Million)
Table 31 North America: Immunoprecipitation Buffers Market, By Country, 2016–2024 (USD Million)
Table 32 Immunoprecipitation Accessories Market, By Region, 2016–2024 (USD Million)
Table 33 North America: Immunoprecipitation Accessories Market, By Country, 2016–2024 (USD Million)
Table 34 Immunoprecipitation Market, By End User, 2016–2024 (USD Million)
Table 35 Immunoprecipitation Market for Academic & Research Institutes, By Region, 2016–2024 (USD Million)
Table 36 North America: Immunoprecipitation Market for Academic & Research Institutes, By Country, 2016–2024 (USD Million)
Table 37 Immunoprecipitation Market for Pharmaceutical & Biotechnology Companies, By Region, 2016–2024 (USD Million)
Table 38 North America: Immunoprecipitation Market for Pharmaceutical & Biotechnology Companies, By Country, 2016–2024 (USD Million)
Table 39 Immunoprecipitation Market for Contract Research Organizations, By Region, 2016–2024 (USD Million)
Table 40 North America: Immunoprecipitation Market for Contract Research Organizations, By Country, 2016–2024 (USD Million)
Table 41 Market, By Region, 2016–2024 (USD Million)
Table 42 North America: Market, By Country, 2016–2024 (USD Million)
Table 43 North America: Market, By Product, 2016–2024 (USD Million)
Table 44 North America: Immunoprecipitation Reagents Market, By Type, 2016–2024 (USD Million)
Table 45 North America: Immunoprecipitation Antibodies Market, By Type, 2016–2024 (USD Million)
Table 46 North America: Immunoprecipitation Beads Market, By Type, 2016–2024 (USD Million)
Table 47 North America: Market, By Type, 2016–2024 (USD Million)
Table 48 North America: Market, By End User, 2016–2024 (USD Million)
Table 49 US: Market, By Product, 2016–2024 (USD Million)
Table 50 US: Immunoprecipitation Reagents Market, By Type, 2016–2024 (USD Million)
Table 51 US: Immunoprecipitation Antibodies Market, By Type, 2016–2024 (USD Million)
Table 52 US: Immunoprecipitation Beads Market, By Type, 2016–2024 (USD Million)
Table 53 US: Market, By Type, 2016–2024 (USD Million)
Table 54 US: Market, By End User, 2016–2024 (USD Million)
Table 55 Canada: Market, By Product, 2016–2024 (USD Million)
Table 56 Canada: Immunoprecipitation Reagents Market, By Type, 2016–2024 (USD Million)
Table 57 Canada: Immunoprecipitation Antibodies Market, By Type, 2016–2024 (USD Million)
Table 58 Canada: Immunoprecipitation Beads Market, By Type, 2016–2024 (USD Million)
Table 59 Canada: Market, By Type, 2016–2024 (USD Million)
Table 60 Canada: Market, By End User, 2016–2024 (USD Million)
Table 61 Europe: Market, By Product, 2016–2024 (USD Million)
Table 62 Europe: Immunoprecipitation Reagents Market, By Type, 2016–2024 (USD Million)
Table 63 Europe: Immunoprecipitation Antibodies Market, By Type, 2016–2024 (USD Million)
Table 64 Europe: Immunoprecipitation Beads Market, By Type, 2016–2024 (USD Million)
Table 65 Europe: Market, By Type, 2016–2024 (USD Million)
Table 66 Europe: Market, By End User, 2016–2024 (USD Million)
Table 67 Asia Pacific: Market, By Product, 2016–2024 (USD Million)
Table 68 Asia Pacific: Immunoprecipitation Reagents Market, By Type, 2016–2024 (USD Million)
Table 69 Asia Pacific: Immunoprecipitation Antibodies Market, By Type, 2016–2024 (USD Million)
Table 70 Asia Pacific: Immunoprecipitation Beads Market, By Type, 2016–2024 (USD Million)
Table 71 Asia Pacific: Market, By Type, 2016–2024 (USD Million)
Table 72 Asia Pacific: Market, By End User, 2016–2024 (USD Million)
Table 73 RoW: Market, By Product, 2016–2024 (USD Million)
Table 74 RoW: Immunoprecipitation Reagents Market, By Type, 2016–2024 (USD Million)
Table 75 RoW: Immunoprecipitation Antibodies Market, By Type, 2016–2024 (USD Million)
Table 76 RoW: Immunoprecipitation Beads Market, By Type, 2016–2024 (USD Million)
Table 77 RoW: Market, By Type, 2016–2024 (USD Million)
Table 78 RoW: Market, By End User, 2016–2024 (USD Million)
Table 79 Expansions, 2016–2018
Table 80 Collaborations, Partnerships, and Agreements, 2016–2018
Table 81 Product Launches, 2016–2018
Table 82 Acquisitions, 2016-2018
List of Figures (25 Figures)
Figure 1 Immunoprecipitation Market
Figure 2 Research Design
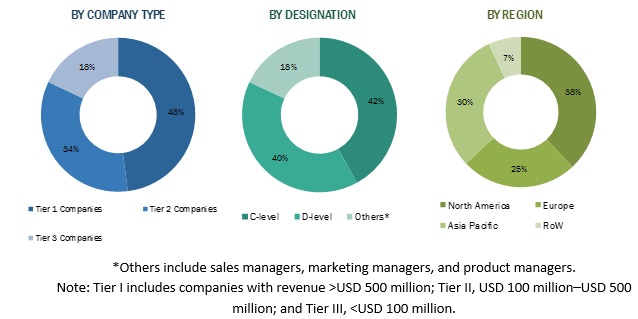
Figure 3 Breakdown of Primary Interviews: By Company Type, Designations, and Region
Figure 4 Bottom-Up Approach
Figure 5 Top-Down Approach
Figure 6 Data Triangulation Methodology
Figure 7 Market, By Product, 2018 vs 2024 (USD Million)
Figure 8 Market, By Type, 2018 vs 2024 (USD Million)
Figure 9 Market, By End User, 2018 vs 2024 (USD Million)
Figure 10 Geographical Snapshot of the Immunoprecipitation Market
Figure 11 Increasing Number of Research Activities in the Life Sciences Industry is A Key Driver for the Immunoprecipitation Market
Figure 12 Kits to Continue to Dominate the Immunoprecipitation Market in 2024
Figure 13 Individual Ip Accounted for the Largest Share of the North American Immunoprecipitation Market in 2018
Figure 14 Market: Drivers, Restraints, Opportunities, and Challenges
Figure 15 Life Sciences R&D Spending, Global vs US (USD Billion)
Figure 16 North America: Market Snapshot
Figure 17 Asia Pacific: Market Snapshot
Figure 18 Immunoprecipitation Market (Global) Competitive Leadership Mapping, 2017
Figure 19 Rank of Companies in the Global Immunoprecipitation Market, 2017
Figure 20 Thermo Fisher Scientific: Company Snapshot
Figure 21 Abcam: Company Snapshot
Figure 22 Genscript: Company Snapshot
Figure 23 Merck KGaA: Company Snapshot
Figure 24 Bio-Rad Laboratories: Company Snapshot
Figure 25 Takara Bio: Company Snapshot
The study involved four major activities for estimating the current market size for immunoprecipitation. Exhaustive research was conducted to collect information on the market as well as its peer and parent markets. The next step was to validate these findings, assumptions, and sizing with industry experts across the value chain through primary research. Both top-down and bottom-up approaches were employed to estimate the complete market size. Thereafter, market breakdown and data triangulation were used to estimate the market size of segments and subsegments.
Secondary Research
This research study involved the use of widespread secondary sources; directories; databases such as D&B, Bloomberg Business, and Factiva; white papers; annual reports; and companies’ house documents. Secondary research was used to identify and collect information for this extensive, technical, market-oriented, and commercial study of the global immunoprecipitation market. It was also used to obtain important information about the top players, market classification and segmentation according to industry trends to the bottom-most level, geographic markets, key developments related to the market, and technology perspectives. A database of the key industry leaders was also prepared using secondary research.
Primary Research
In the primary research process, various sources from both the supply and demand sides were interviewed to obtain qualitative and quantitative information for this report. The primary sources from the supply side include industry experts such as CEOs, vice presidents, marketing and sales directors, technology & innovation directors, and related key executives from various key companies and organizations operating in the global immunoprecipitation market. The primary sources from the demand side included industry experts, such as life science researchers, experts from drug manufacturers, and contract manufacturing organizations.
Primary research was conducted to validate the market segmentation, identify key players in the market, and gather insights on key industry trends, and key market dynamics. Given below is a breakdown of primary respondents:
To know about the assumptions considered for the study, download the pdf brochure
Immunoprecipitation Market Size Estimation
The report presents a detailed assessment of the global immunoprecipitation market, along with qualitative inputs and insights from MarketsandMarkets. Both top-down and bottom-up approaches were used to anticipate and validate the size of the global immunoprecipitation market and estimate the sizes of various other dependent sub-markets.
The procedure included the study of the annual and financial reports of top market players and extensive interviews with industry leaders such as CEOs, VPs, directors, and marketing executives for key insights.
- All percentage shares, splits, and breakdowns were determined using secondary sources and MarketsandMarkets repository and verified through primary sources.
- All possible parameters that affect the markets covered in this research study have been accounted for, viewed in extensive detail, verified through primary research, and analyzed to get the final quantitative and qualitative data.
- The above-mentioned data is consolidated and added with detailed inputs and analysis from MarketsandMarkets and presented in this report.
The market forecast provided in this study was arrived at after a detailed assessment of various qualitative and quantitative factors, such as historical revenue growth trend of leading players; major market growth drivers and restraints, and their impact over the forecast period; innovation trends; and relevant macro and micro-economic indicators. However, the forecast for top-level markets and subsegments does not account for the effects of inflation, economic downturns, exchange rate forecast, and any unforeseen regulatory and policy changes over the forecast period of 2018–2023.
Data Triangulation
After arriving at the overall market size using the market size estimation processes explained above the market was split into several segments and subsegments. To complete the overall market engineering process and arrive at the exact statistics of each market segment and subsegment, data triangulation and market breakdown procedures were employed, wherever applicable. The data was triangulated by studying various factors and trends from both the demand and supply sides of the immunoprecipitation industry.
Report Objectives
- To define, segment, and estimate the global market size for immunoprecipitation.
- To understand the structure of the immunoprecipitation market by identifying its subsegments
- To provide detailed information about the key factors influencing the growth of the market (drivers, restraints, opportunities, and challenges)
- To estimate the size of the market and its submarkets, in terms of value and volume, with respect to four regions (along with their respective key countries)
- To profile key players and comprehensively analyze their core competencies
- To understand the competitive landscape and identify the major growth strategies adopted by players across key regions
- To analyze competitive developments such as expansions & investments, product launches, and acquisitions in the immunoprecipitation market
Available Customizations
With the given market data, MarketsandMarkets offers customizations according to company-specific scientific needs.
The following customization options are available for the report:
Regional Analysis
- Further breakdown of the European immunoprecipitation market, by key country
- Further breakdown of the Asia Pacific immunoprecipitation market, by key country
- Further breakdown of the RoW immunoprecipitation market, by country

 Generating Response ...


Growth opportunities and latent adjacency in Immunoprecipitation Market