Indian Intelligent Building Management Systems Market (Forecast to 2016)


The best in safety, security, and comfort that was originally intended for the �technically inclined� is now reaching the general public through intelligent buildings and homes. Central to �intelligent buildings�; insights of the current Indian market scenario and its future prospects are detailed in this report.
BAS core functionality keeps the building climate within a specified range, provides lighting based on an occupancy schedule, and monitors system performance and device failures and provides email and/or text notifications to building engineering staff.
This report refers to an intelligent building as the one that integrates Building Automation Systems (BAS) with IT systems and metering platforms; thereby forming a unified system that tracks, informs, provides granular control, and monitors energy and resource usage. While this system gives a detailed picture about a building�s IQ, property stakeholders get to actively participate in energy conservation, all with a fluid exchange of information between rapidly evolving smart grids and the commercial systems.
This report covers the market on the basis of products and applications comprising general lighting controls, communication protocols, standards & data distribution, security & access controls, HVAC controls, entertainment controls, and outdoor controls and their applications across sectors such as life science; hospitality, residential and retail; office space, educational and religious centers, manufacturing centers, and energy and infrastructure. The application market is further segmented on the basis of application; each application is sub-segmented into various building types. The report also covers the market on basis of geography that entails North India, South India, East India, and West India.
The Indian IBMS market report, as the name suggests, illustrates the Indian scenario in face of intelligent buildings and building management systems over the next five years with insights into:
- The demand side of the market
- Much more interactive customers demanding intelligent eco-systems
- Responding liberalized markets in lieu of demand flexibility, controlled price volatility, and flexible & predictable government policies
- Key growth drivers and restraints of the market
- Burning issues and opportunities
- Impact analysis of the market dynamics
- Analysis of different applications of the market
- Key consumer trends shaping and influencing the market
- Identification of segments with high growth potential
- Prominent projects accomplished in this industry
- Region specific developments and peculiarities
- Key growth strategies for companies in the Indian IBMS market
- The competitive landscape of the industry
The report also captures the market roadmap with market sizes, trend lines, revenue forecasts, value chain, market & product trends, socio-economic trends and regulations, competitive landscape.
Leading players like ABB Ltd. (India), Crestron Asia (Hong Kong), Lutron (U.S.), Control4 (U.S.), Honeywell (U.S.), Schneider Electric (France), Siemens AG (Germany), Home Automation Inc. (U.S.), Sauter Race (India), Rockwell (U.S.), Johnson Control (U.S.), Carrier Air-conditioning and Refrigeration (India), and AMX (U.S.) are profiled in this report with their key developments, financial and strategies.
The key stakeholders identified for this report are:
- Housing developers
- Architects
- Interior designers
- Smart home device manufacturers
- Property and estate dealers
- Homeowners
- System integrators
- Software developers
- Real estate investors
India is undergoing a fundamental change in its design, control, and architecture with respect to adopting green and efficient technologies. Whilst fundamentally being a vital aid to save energy resources, the concept of intelligent buildings in India is witnessing a tremendous shift in demand for active and intelligent transmission, distribution, monitoring, control, communication, and upgradation of energy. This research is conducted noting the potential within these concepts and the surrounding technology that can have an impact on our living and working environments.
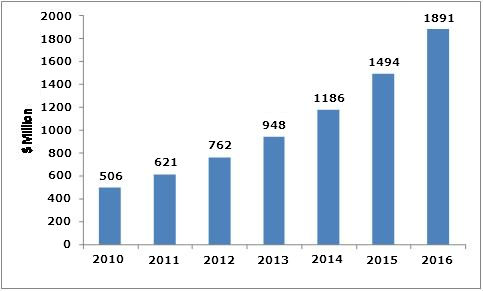
The Indian IBMS market is valued at $621 million as on 2011. The market is expected to reach $1,891 million by 2016 at a CAGR of 24.93% from 2011 to 2016.
On the basis of application, the maximum share in the Indian IBMS market is held by hospitality, residential, and retail; followed by office space- both expected to closely grow at a CAGR of approximately 25% from 2011 to 2016. HVAC controls and security controls hold the largest share in the product market and are expected to grow at a CAGR of 26.25% and 25.12% respectively from 2011 to 2016.
 Exclusive indicates content/data unique to MarketsandMarkets and not available with any competitors.
TABLE OF CONTENTS
1 INTRODUCTION
1.1 KEY TAKE-AWAYS
1.2 REPORT DESCRIPTION
1.3 MARKETS COVERED
1.4 STAKEHOLDERS
1.5 RESEARCH METHODOLOGY
1.5.1 KEY DATA POINTS TAKEN FROM SECONDARY SOURCES
1.5.2 KEY DATA POINTS TAKEN FROM PRIMARY SOURCES
1.5.3 ASSUMPTIONS MADE
1.5.4 LIST OF COMPANIES COVERED DURING PRIMARIES
2 SUMMARY
2.1 OVERVIEW OF THE MARKET
2.2 METHOD OF ANALYSIS
2.3 MARKET SIZE
3 MARKET OVERVIEW
3.1 MARKET DEFINITION & SEGMENTATION
3.2 EVOLUTION OF INTELLIGENT BUILDING MANAGEMENT SYSTEMS IN INDIA
3.3 BURNING ISSUES
3.3.1 NEED FOR SKILLED PROFESSIONALS
3.4 MARKET DYNAMICS
3.4.1 DRIVERS
3.4.1.1 Booming construction sector
3.4.1.2 Regulations and schemes to tighten building codes across key cities in India
3.4.1.3 More than 30 certified green buildings and 320 registered green buildings projects in India
3.4.1.4 Evolving consumer mindset
3.4.2 RESTRAINTS
3.4.2.1 Long pay-back period
3.4.2.2 Lack of consumer awareness and conviction
3.4.2.3 Devices� incompatibility and lack of infrastructure remodeling
3.4.3 OPPORTUNITIES
3.4.3.1 Assistance of power-line communication technology
3.4.3.2 Introduction to smart grids
3.5 MARKET SHARE ANALYSIS, BY COMPANY
4 INDIAN INTELLIGENT BUILDING MANAGEMENT SYSTEMS MARKET, BY PRODUCTS
4.1 INTRODUCTION
4.2 GENERAL LIGHTING CONTROLS
4.2.1 DRIVERS
4.2.1.1 Growth in construction sector
4.2.1.2 Energy savings factor
4.2.1.3 Rising energy costs
4.2.1.4 Higher living standard & comfort
4.3 COMMUNICATION PROTOCOLS, STANDARDS & DATA DISTRIBUTION
4.3.1 DRIVERS
4.3.1.1 High growth posed by the structured cabling solutions (SCS) market to leverage BAS prospects
4.3.1.2 Spurring business environment & IT intelligence
4.3.1.3 Convergence of the Internet Protocol version 6 (IPv6) and cloud computing
4.4 SECURITY & ACCESS CONTROLS
4.4.1 DRIVERS
4.4.1.1 Increased rate of thefts & burglaries
4.4.1.2 Exponential growth of CCTV market
4.5 HVAC CONTROLS
4.5.1 DRIVERS
4.5.1.1 Support of co-generation and tri-generation projects
4.5.1.2 Assistance of networking technologies & communication standards
4.6 ENTERTAINMENT CONTROLS
4.6.1 DRIVERS
4.6.1.1 Smart phones & PDAs offering mobile-optimized controls and features
4.6.1.2 Ability to integrate multiple entertainment systems
4.7 OUTDOOR CONTROLS
4.7.1 DRIVER
4.7.1.1 Demand for green buildings offering �Active Luxury�
5 INDIAN INTELLIGENT BUILDING MANAGEMENT SYSTEM MARKET, BY APPLICATIONS
5.1 INTRODUCTION
5.2 LIFE SCIENCE
5.2.1 COMMERCIAL HEALTHCARE BUILDINGS
5.2.2 INSTITUTIONAL HEALTHCARE BUILDINGS
5.3 OFFICE SPACE
5.3.1 GOVERNMENT BUILDINGS
5.3.2 COMMERCIAL OFFICE BUILDINGS
5.4 HOSPITALITY, RESIDENTIAL & RETAIL
5.4.1 RESIDENTIAL BUILDINGS
5.4.2 RETAIL BUILDINGS
5.4.3 LODGING
5.4.4 AMUSEMENT SPACE
5.4.5 PUBLIC RECREATION
5.4.6 OTHERS: OPEN-AIR STADIUMS, PARKS & PLAYGROUNDS
5.5 EDUCATIONAL & RELIGIOUS CENTERS
5.5.1 EDUCATIONAL BUILDING
5.5.2 RELIGIOUS BUILDING
5.6 MANUFACTURING BUILDINGS
5.6.1 INDUSTRIAL MANUFACTURING BUILDINGS
5.6.2 AUTOMOTIVE BUILDINGS
5.7 ENERGY & INFRASTRUCTURE
5.7.1 HIGHWAYS, STREETS & BRIDGES
5.7.2 TRANSPORTATION
5.7.3 COMMUNICATIONS
5.7.4 NON-MANUFACTURING WAREHOUSES
6 GEOGRAPHICAL ANALYSIS
6.1 SOUTH INDIA
6.2 WEST INDIA
6.3 NORTH INDIA
6.4 EAST INDIA
7 COMPETITIVE LANDSCAPE
7.1 KEY GROWTH STRATEGIES
8 COMPANY PROFILES
8.1 ABB LIMITED (INDIA)
8.1.1 OVERVIEW
8.1.2 PRODUCTS & SERVICES
8.1.3 FINANCIALS
8.1.4 STRATEGY
8.1.5 DEVELOPMENTS
8.2 AMX
8.2.1 OVERVIEW
8.2.2 PRODUCTS & SERVICES
8.2.3 FINANCIALS
8.2.4 STRATEGY
8.2.5 DEVELOPMENTS
8.3 CARRIER AIRCONDITIONING & REFRIGERATION LIMITED
8.3.1 OVERVIEW
8.3.2 PRODUCTS & SERVICES
8.3.3 FINANCIALS
8.3.4 STRATEGY
8.3.5 DEVELOPMENTS
8.4 CISCO SYSTEMS INC
8.4.1 OVERVIEW
8.4.2 PRODUCTS & SERVICES
8.4.3 FINANCIALS
8.4.4 STRATEGY
8.4.5 DEVELOPMENTS
8.5 CONTROL4
8.5.1 OVERVIEW
8.5.2 PRODUCT & SERVICES
8.5.3 FINANCIALS
8.5.4 STRATEGY
8.5.5 DEVELOPMENTS
8.6 CRESTRON ELECTRONICS INC
8.6.1 OVERVIEW
8.6.2 PRODUCTS & SERVICES
8.6.3 FINANCIALS
8.6.4 STRATEGY
8.6.5 DEVELOPMENTS
8.7 HONEYWELL AUTOMATION INDIA LIMITED (HAIL)
8.7.1 OVERVIEW
8.7.2 PRODUCTS & SERVICES
8.7.3 FINANCIALS
8.7.4 STRATEGY
8.7.5 DEVELOPMENTS
8.8 JOHNSON CONTROLS INC
8.8.1 OVERVIEW
8.8.2 PRODUCTS & SERVICES
8.8.3 FINANCIALS
8.8.4 STRATEGY
8.8.5 DEVELOPMENTS
8.9 LEGRAND S.A.
8.9.1 OVERVIEW
8.9.2 PRODUCTS & SERVICES
8.9.3 FINANCIALS
8.9.4 STRATEGY
8.9.5 DEVELOPMENTS
8.10 LUTRON ELECTRONICS CO. INC
8.10.1 OVERVIEW
8.10.2 PRODUCTS & SERVICES
8.10.3 FINANCIALS
8.10.4 STRATEGY
8.10.5 DEVELOPMENTS
8.11 SAUTER RACE TECHNOLOGIES PRIVATE LIMITED
8.11.1 OVERVIEW
8.11.2 PRODUCTS & SERVICES
8.11.3 FINANCIALS
8.11.4 DEVELOPMENTS
8.12 SIEMENS BUILDING TECHNOLOGIES PVT. LTD
8.12.1 OVERVIEW
8.12.2 PRODUCTS & SERVICES
8.12.3 FINANCIALS
8.12.4 STRATEGY
8.12.5 DEVELOPMENTS
8.13 SCHNEIDER ELECTRIC INDIA PVT. LTD
8.13.1 OVERVIEW
8.13.2 PRODUCTS & SERVICES
8.13.3 FINANCIALS
8.13.4 STRATEGY
8.13.5 DEVELOPMENTS
LIST OF TABLES
TABLE 1 INDIAN IBMS MARKET REVENUE, BY APPLICATIONS, 2010 � 2016 ($MILLION)
TABLE 2 INDIAN IBMS MARKET REVENUE, BY PRODUCTS, 2010 � 2016 ($MILLION)
TABLE 3 SYSTEM PREFERENCE IN INDIA DEPENDING ON AGE GROUPS
TABLE 4 AVERAGE LIFE SPAN OF APPLIANCES & DURABLES IN INDIA
TABLE 5 COMPETITIVE ANALYSIS, 2011 ($MILLION)
TABLE 6 INDIAN IBMS MARKET REVENUE, BY PRODUCTS, 2010 � 2016 ($MILLION)
TABLE 7 GENERAL LIGHTING CONTROLS: MARKET REVENUE, BY APPLICATIONS, 2010 � 2016 ($MILLION)
TABLE 8 GENERAL LIGHTING CONTROLS: MARKET REVENUE, BY MARKET TYPES, 2010 � 2016 ($MILLION)
TABLE 9 COMMUNICATION PROTOCOLS, STANDARDS & DATA DISTRIBUTION: MARKET REVENUE, BY APPLICATIONS, 2010 � 2016 ($MILLION)
TABLE 10 COMMUNICATION PROTOCOLS, STANDARDS & DATA DISTRIBUTION: MARKET REVENUE, BY MARKET TYPES, 2010 � 2016 ($MILLION)
TABLE 11 SECURITY CONTROLS: MARKET REVENUE, BY APPLICATIONS, 2010 � 2016 ($MILLION)
TABLE 12 ACCESS CONTROLS: MARKET REVENUE, BY APPLICATIONS, 2010 � 2016 ($MILLION)
TABLE 13 SECURITY CONTROLS: MARKET REVENUE, BY MARKET TYPES, 2010 � 2016 ($MILLION)
TABLE 14 ACCESS CONTROLS: MARKET REVENUE, BY MARKET TYPES, 2010 � 2016 ($MILLION)
TABLE 15 MARKET STRUCTURE OF THE SECURITY BUSINESS IN INDIA, BY PRODUCTS, 2011
TABLE 16 HVAC CONTROLS: MARKET REVENUE, BY APPLICATIONS, 2010 � 2016 ($MILLION)
TABLE 17 HVAC CONTROLS: MARKET REVENUE, BY MARKET TYPES, 2010 � 2016 ($MILLION)
TABLE 18 TOTAL ENTERTAINMENT CONTROLS: MARKET REVENUE, BY APPLICATIONS, 2010 � 2016 ($MILLION)
TABLE 19 ENTERTAINMENT CONTROLS: MARKET REVENUE, BY MARKET TYPES, 2010 � 2016 ($MILLION)
TABLE 20 TOTAL OUTDOOR CONTROLS: MARKET REVENUE, BY APPLICATIONS, 2010 � 2016 ($MILLION)
TABLE 21 OUTDOOR CONTROLS: MARKET REVENUE, BY MARKET TYPES, 2010 � 2016 ($MILLION)
TABLE 22 LIFE SCIENCE: MARKET REVENUE, BY BUILDING TYPES, 2010 � 2016 ($MILLION)
TABLE 23 COMMERCIAL HEALTHCARE BUILDINGS: MARKET REVENUE, BY MARKET TYPES, 2010 � 2016 ($MILLION)
TABLE 24 INSTITUTIONAL HEALTHCARE BUILDINGS: MARKET REVENUE, BY MARKET TYPES, 2010 � 2016 ($MILLION)
TABLE 25 OFFICE SPACE: MARKET REVENUE, BY BUILDING TYPES, 2010 � 2016 ($MILLION)
TABLE 26 GOVERNMENT BUILDINGS: MARKET REVENUE, BY MARKET TYPES, 2010 � 2016 ($MILLION)
TABLE 27 CORPORATE OFFICE BUILDINGS: MARKET REVENUE, BY MARKET TYPES, 2010 � 2016 ($MILLION)
TABLE 28 HOSPITALITY, RESIDENTIAL & RETAIL: MARKET REVENUE, BY BUILDING TYPES, 2010 � 2016 ($MILLION)
TABLE 29 RESIDENTIAL BUILDINGS: MARKET REVENUE, BY MARKET TYPES, 2010 � 2016 ($MILLION)
TABLE 30 RETAIL BUILDINGS: MARKET REVENUE, BY MARKET TYPES, 2010 � 2016 ($MILLION)
TABLE 31 LODGING BUILDINGS: MARKET REVENUE, BY MARKET TYPES, 2010 � 2016 ($MILLION)
TABLE 32 AMUSEMENT SPACE BUILDINGS: MARKET REVENUE, BY MARKET TYPES, 2010 � 2016 ($MILLION)
TABLE 33 PUBLIC RECREATION BUILDINGS: MARKET REVENUE, BY MARKET TYPES, 2010 � 2016 ($MILLION)
TABLE 34 OTHERS BUILDING: MARKET REVENUE, BY MARKET TYPES, 2010 � 2016 ($MILLION)
TABLE 35 EDUCATIONAL & RELIGIOUS CENTERS: MARKET REVENUE, BY BUILDING TYPES, 2010 � 2016 ($MILLION)
TABLE 36 EDUCATIONAL BUILDINGS: MARKET REVENUE, BY MARKET TYPES, 2010 � 2016 ($MILLION)
TABLE 37 RELIGIOUS BUILDINGS: MARKET REVENUE, BY MARKET TYPES, 2010 � 2016 ($MILLION)
TABLE 38 MANUFACTURING BUILDINGS: MARKET REVENUE, BY BUILDING TYPES, 2010 � 2016 ($MILLION)
TABLE 39 INDUSTRIAL MANUFACTURING BUILDINGS: MARKET REVENUE, BY MARKET TYPES, 2010 � 2016 ($MILLION)
TABLE 40 AUTOMOTIVE BUILDINGS: MARKET REVENUE, BY MARKET TYPES, 2010 � 2016 ($MILLION)
TABLE 41 ENERGY & INFRASTRUCTURE: MARKET REVENUE, BY BUILDING TYPES, 2010 � 2016 ($MILLION)
TABLE 42 HIGHWAYS, STREETS & BRIDGES INFRASTUCTURE BUILDINGS: MARKET REVENUE, BY MARKET TYPES, 2010 � 2016 ($MILLION)
TABLE 43 TRANSPORTATION BUILDINGS: MARKET REVENUE, BY MARKET, 2010 � 2016 ($MILLION)
TABLE 44 COMMUNICATIONS BUILDINGS: MARKET REVENUE, BY MARKET TYPES, 2010 � 2016 ($MILLION)
TABLE 45 NON-MANUFACTURING WAREHOUSES BUILDINGS: MARKET REVENUE, BY MARKET TYPES, 2010 � 2016 ($MILLION)
TABLE 46 MERGERS & ACQUISITIONS, 2009 � 2011
TABLE 47 COLLABORATIONS/PARTNERSHIPS/AGREEMENTS/ JOINT VENTURES, 2008 � 2011
TABLE 48 NEW PRODUCTS LAUNCH, 2009 � 2011
TABLE 49 OTHERS, 2008 � 2011
TABLE 50 CISCO SYSTEMS INC: R&D INVESTMENT, 2008 � 2010 ($MILLION)
TABLE 51 CISCO SYSTEMS INC: SALES & MARKETING INVESTMENT, 2008 � 2010 ($MILLION)
TABLE 52 CISCO SYSTEM INC: MARKET REVENUE, BY GEOGRAPHY, 2009 � 2011 ($MILLION)
TABLE 53 CISCO SYSTEM INC: MARKET REVENUE, BY SEGMENTS, 2009 � 2011 ($MILLION)
TABLE 54 CISCO SYSTEM INC: MARKET REVENUE, BY SEGMENTS, 2009 � 2011 ($MILLION)
TABLE 55 JOHNSON CONTROLS INC.: TOTAL REVENUE AND R&D EXPENSES, 2008 � 2010 ($MILLION)
TABLE 56 SIEMENS BUILDING TECHNOLOGIES: TOTAL REVENUE AND R&D EXPENSES, 2009 � 2010 ($MILLION)
TABLE 57 SIEMENS AG: MARKET REVENUE, BY GEOGRAPHY 2009 � 2010 ($MILLION)
LIST OF FIGURES
FIGURE 1 INDIAN IBMS MARKET SEGMENTATION, BY PRODUCTS
FIGURE 2 INDIAN IBMS MARKET SEGMENTATION, BY APPLICATIONS
FIGURE 3 IMPACT ANALYSIS FOR THE DRIVERS FOR INDIAN IBMS MARKET
FIGURE 4 RETURNS ON INVESTMENT
FIGURE 5 ATTITUDINAL SEGMENT AMONG INDIAN CONSUMERS
FIGURE 6 IMPACT OF VARIOUS INFLUENCING FACTORS
FIGURE 7 IMPACT ANALYSIS OF THE RESTRAINTS FOR THE INDIAN IBMS MARKET
FIGURE 8 SHARE OF MAJOR PLAYERS IN INDIAN IBMS MARKET, BY COMPANY, 2009
FIGURE 9 INDIAN IBMS MARKET SHARE, BY PRODUCT SEGMENTS, 2011 VS 2016 (%)
FIGURE 10 GENERAL LIGHTING CONTROLS: MARKET GROWTH RATES, BY APPLICATIONS, 2011 � 2016 (%)
FIGURE 11 COMMUNICATION PROTOCOLS, STANDARDS & DATA DISTRIBUTION: MARKET GROWTH RATES, BY APPLICATIONS, 2011 � 2016 (%)
FIGURE 12 SECURITY CONTROLS: MARKET GROWTH RATES, BY APPLICATIONS, 2011 � 2016 (%)
FIGURE 13 ACCESS CONTROLS: MARKET GROWTH RATES, BY APPLICATIONS, 2011 � 2016 (%)
FIGURE 14 HVAC CONTROLS: MARKET GROWTH RATES, BY APPLICATIONS, 2011 � 2016 (%)
FIGURE 15 CO-GENERATION & TRI-GENERATION SYSTEM
FIGURE 16 ENTERTAINMENT CONTROLS: MARKET GROWTH RATES, BY APPLICATIONS, 2011 � 2016 (%)
FIGURE 17 OUTDOOR CONTROLS: MARKET GROWTH RATES, BY APPLICATIONS, 2011 � 2016 (%)
FIGURE 18 INDIAN IBMS MARKET SHARE, BY APPLICATIONS, 2011 VS 2016
FIGURE 19 LIFE SCIENCE SEGMENTATION, BY BUILDING TYPES
FIGURE 20 LIFE SCIENCE: MARKET GROWTH RATES, BY BUILDING TYPES, 2010 � 2016 (%)
FIGURE 21 OFFICE SPACE SEGMANTATION, BY BUILDING TYPES
FIGURE 22 OFFICE SPACE: MARKET GROWTH RATES, BY BUILDING TYPES, 2010 � 2016 (%)
FIGURE 23 HOSPITALITY, RESIDENTIAL & RETAIL MARKET SEGMENTATION, BY BUILDING TYPES
FIGURE 24 HOSPITALITY, RESIDENTIAL & RETAIL BUILDINGS: MARKET GROWTH RATES, BY BUILDING TYPES, 2010 � 2016 (%)
FIGURE 25 EDUCATIONAL & RELIGIOUS CENTERS SEGMENTATION, BY BUILDING TYPES
FIGURE 26 EDUCATIONAL & RELIGIOUS CENTERS: MARKET GROWTH RATES, BY BUILDING TYPES, 2010 � 2016 (%)
FIGURE 27 MANUFACTURING BUILDINGS SEGMENTATION, BY BUILDING TYPES
FIGURE 28 MANUFACTURING BUILDINGS: MARKET GROWTH RATES, BY BUILDING TYPES, 2010 � 2016 (%)
FIGURE 29 ENERGY & INFRASTRUCTURE SEGMENTATION, BY BUILDING TYPES
FIGURE 30 ENERGY & INFRASTRUCTURE BUILDINGS: MARKET GROWTH RATES, BY BUILDING TYPES, 2010 � 2016 (%)
FIGURE 31 INDIAN IBMS MARKET SHARE, BY GEOGRAPHY, 2011 (%)
FIGURE 32 SOUTH INDIA: MARKET SIZE, 2011 � 2016 ($MILLION)
FIGURE 33 WEST INDIA: MARKET SIZE, 2011 - 2016 ($MILLION)
FIGURE 34 NORTH INDIA: MARKET SIZE, 2011 � 2016 ($MILLION)
FIGURE 35 EAST INDIA: MARKET SIZE, 2011 � 2016 ($MILLION)
FIGURE 36 KEY GROWTH STRATEGIES, FEBRUARY 2008 � SEPTEMBER 2011
FIGURE 37 ABB LIMITED: ANNUAL REVENUE, 2006 � 2010 ($MILLION)
FIGURE 38 CISCO SYSTEMS INC: TOTAL SALES, 2006 � 2010 ($BILLION)
FIGURE 39 HONEYWELL AUTOMATION INDIA LIMITED: ANNUAL SALES REVENUE, 2007 � 2010 ($BILLION)
FIGURE 40 LEGRAND S.A.: ANNUAL SALES REVENUE, 2007 � 2010 ($BILLION)
FIGURE 41 LEGRAND S.A.: SALES DISTRIBUTION, BY GEOGRAPHY, 2010 (%)
FIGURE 42 SCHNEIDER ELECTRIC: ANNUAL SALES REVENUE, 2007 � 2010 ($BILLION)
FIGURE 43 SCHNEIDER ELECTRIC: SALES REVENUE, 2007 � 2009 (%)


Growth opportunities and latent adjacency in Indian Intelligent Building Management Systems Market
I am trying to enter in home automation business. For that I wanted to know the growth areas and market segmentation to identify high growth areas.
Requesting to provide the building management system market share in India between key players.
Interested in cost benefit analysis and advantages of smart buildings (in terms of energy requirement, performance, carbon footprint, ease of work, and seamless integration), and how LEAN techniques and DIGITAL technologies (like social, mobile, analytics, cloud and IoT) will be used to build intelligent buildings under home automation.