Industrial Gearbox Market by Type (Planetary, Helical, Bevel, Spur, Worm), Design (Parallel, Angled) Industry (Wind Power, Material Handling, Construction, Metal & Mining, Cement & Aggregate, Food & Beverage), and Region - Global Forecast to 2023


[158 Pages Report] The global industrial gearbox market is expected to grow from an estimated USD 25.91 billion in 2018 to USD 31.90 billion by 2023, at a CAGR of 4.25% during the forecast period. Increasing requirement for efficient energy gearbox and clean energy sources are driving the growth of the market. In addition to this, the increasing automation in manufacturing technology is facilitating the growth of the market. The industrial gearbox market is segmented on the basis of type, design, industry and region. The years considered for the study are as follows:
- Base Year: 2017
- Estimated Year: 2018
- Projected Year: 2023
- Forecast Period: 2018�2023
The base year considered for company profiles is 2017. Whenever information was unavailable for the base year, the prior year has been considered.
Objectives of the Study
- To define, describe, and forecast the industrial gearbox market on the basis of type, design, industry, and region
- To provide detailed information regarding the major factors influencing the growth of the market (drivers, restraints, opportunities, and industry-specific challenges)
- To strategically analyze the market with respect to individual growth trends, future projections, and the contribution of each segment to the market
- To track and analyze competitive developments such as contracts & agreements, new product launches, expansions & investments, and partnerships & collaborations in the market
- To profile key players and comprehensively analyze their market ranking and core competencies
Research Methodology
This research study involved the use of extensive secondary sources, directories, and databases, such as D&B, Bloomberg Businessweek, and Factiva, to identify and collect information useful for a technical, market-oriented, and commercial study of the industrial gearbox market. Primary sources are mainly industry experts from the core and related industries, preferred suppliers, manufacturers, distributors, service providers, technology developers, standards and certification organizations, and organizations related to all the segments of this industry�s value chain. The points given below explain the research methodology.
- Study of the annual revenue and market developments of major players that provide industrial gearbox
- Assessment of future trends and growth of the industry
- Assessment of the market with respect to the type of technology used for different applications
- Study of contracts and developments related to the market by key players across different regions
- Finalization of overall market sizes by triangulating the supply-side data, which includes product developments, and annual revenues of companies supplying industrial gearbox across the globe
After arriving at the overall market size, the total market has been split into several segments and subsegments. The figure given below illustrates the breakdown of primaries conducted during the research study, based on the company type, designation, and region.
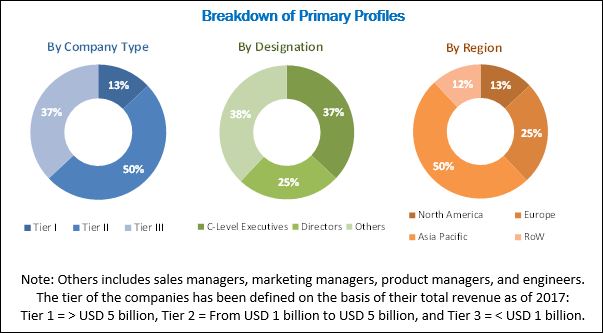
To know about the assumptions considered for the study, download the pdf brochure
Some of the leading global manufacturers of industrial gearboxes are Siemens AG (Germany), Bonfiglioli Italia S.P.A (Italy), Bondioli & Pavesi (Italy), Sew-Eurodrive (Germany), and Dana Brevini (Italy).
Target Audience:
The report�s target audience includes:
- End-Use Industries
- Gearbox Associations
- Gearbox Manufacturers & Suppliers
- Government Agencies
- Investment Banks
- Government and research organizations
- Industrial gearbox manufacturers
- State and national regulatory authorities
Scope of the report:
Industrial gearbox Market:
By Type
- Planetary
- Helical
- Bevel
- Spur
- Worm
- Other (Helical-Bevel, Planetary Worm)
By Design
- Parallel axis
- Angular axis
- Others (non-coplanar and non-parallel axis)
By Industry
- Wind Power
- Cement & Aggregates
- Chemical, Rubber & Plastics
- Construction
- Food & Beverage
- Marine
- Material Handling
- Metals & Mining
- Power Generation
- Recreational Vehicle
- Transportation Industry
- Agriculture
- Automotive
- Others (Aerospace, Defense, Semiconductor, Robotics, Textile, Healthcare)
By Region
- Asia Pacific
- North America
- Europe
- Middle East & Africa
- South America
Available Customizations:
With the given market data, MarketsandMarkets offers customizations as per the client�s specific needs. The following customization options are available for the report:
Regional Analysis
- Further breakdown of region/country-specific analysis
Company Information
- Detailed analysis and profiling of additional market players (Up to 5)
The global Industrial Gearbox Market is estimated to grow from USD 25.91 billion in 2018 to USD 31.90 billion by 2023, at a CAGR of 4.25% during the forecast period. The growth in the industrial gearbox market is driven by the increasing automation in manufacturing industries such as automobile, food processing, and agriculture machinery. In addition, increasing investments in renewable power generation, with a skew towards wind power, is driving the market.
In this report, the market is segmented on the basis of type into planetary, helical, bevel, spur, worm, and others. The planetary gearbox segment is the fastest growing segment by type in the market because of the vast application of this type of gearbox in wind turbines, steel plants, and various industries such as food and beverage, mining, and cement. These gearboxes are used in a wide range of applications such as port lifting equipment, mixers, pressure feeder, defuser, and crystallizer. The growing investment in food and beverage industry and mining and cement industry in Europe and Asia, respectively, is driving the growth for the planetary gearboxes.
The Industrial Gearbox market is further segmented on the basis of design into parallel, angular, and others. The parallel segment is projected to hold the largest market share in the market. The helical and planetary gearboxes, which hold the substantial share of the market, are manufactured using the parallel axis design. Thus, the parallel axis segment is expected to hold the largest market share.
The market has been segmented on the basis of end-user into wind power, cement & aggregate, chemical, rubber & plastic, construction, food & beverage, marine, material handling, metals & mining, power generation, recreational vehicle, transport industry, agriculture, automotive, and others. The wind power segment is expected to grow at the fastest rate in the market. The growth in the wind power segment is driven by the increasing investment in wind power installations in Asia Pacific, North America, and Europe.
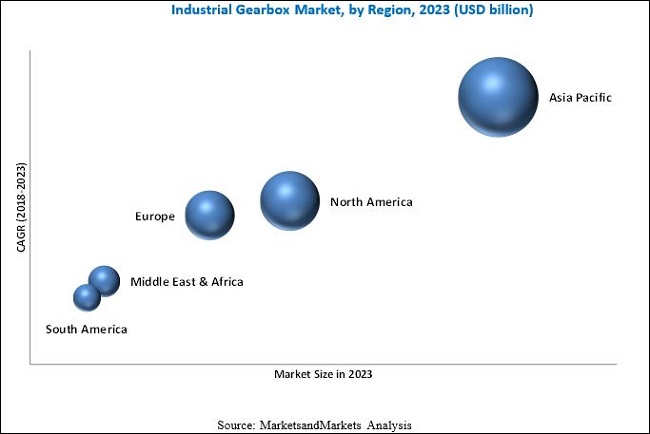
The Industrial Gearbox market is analyzed with respect to five regions, namely, North America, Europe, Asia Pacific, South America, and the Middle East & Africa. Asia Pacific region is estimated to dominate the market in the forecast period. The market in Asia Pacific is expected to hold the largest share and is forecast to grow at the fastest rate during the forecasted period. The region holds the largest market share globally as the countries such as China and Japan are among the largest manufacturing countries in the world. In addition to this, the projected installation of wind power and the growing automation in the manufacturing industries in the region is driving the growth of the market in Asia Pacific.
The major factor restraining the growth of the industrial gearbox market is the slowdown of the major economies in the European region. The technical challenges are also acting as a restraint for the growth of the market.
In this industry, most players are global multinational companies. Some of the leading global manufacturers of industrial gearboxes are Siemens AG (Germany), Bonfiglioli Italia S.P.A (Italy), Bondioli & Pavesi (Italy), Sew-Eurodrive (Germany), and Dana Brevini (Italy). These players have adopted growth strategies such as new product launches and contracts & agreements to capture a larger share in the industrial gearbox market.
To speak to our analyst for a discussion on the above findings, click Speak to Analyst
 Exclusive indicates content/data unique to MarketsandMarkets and not available with any competitors.
Table of Contents
1 Introduction (Page No. - 15)
1.1 Objectives of the Study
1.2 Definition
1.3 Market Scope
1.3.1 Markets Covered
1.3.2 Years Considered for the Study
1.4 Currency
1.5 Stakeholders
2 Research Methodology (Page No. - 18)
2.1 Research Data
2.2 Secondary Data
2.2.1 Key Data From Secondary Sources
2.2.2 Primary Data
2.2.2.1 Key Data From Primary Sources
2.2.2.2 Key Industry Insights
2.2.2.3 Breakdown of Primaries
2.3 Market Size Estimation
2.3.1 Bottom-Up Approach
2.3.2 Top-Down Approach
2.4 Market Breakdown & Data Triangulation
2.5 Research Assumptions
2.5.1 Assumptions
3 Executive Summary (Page No. - 26)
4 Premium Insights (Page No. - 31)
4.1 Attractive Opportunities in the Industrial Gearbox Market
4.2 Market, By Country
4.3 Market, By Type
4.4 Market, By Industry
4.5 Market, By Design
4.6 Asia Pacific Industrial Gearbox Market
5 Market Overview (Page No. - 36)
5.1 Introduction
5.2 Market Dynamics
5.2.1 Drivers
5.2.1.1 High Demand for Energy Efficient Gearboxes
5.2.1.2 Growing Adoption of Industrial Automation Across Various Industries
5.2.1.3 Increasing Industrialization in Economies Such as the Middle East and Africa
5.2.2 Restraints
5.2.2.1 Slowdown of Industrialization in Europe
5.2.2.2 Technical Challenges Such as Overheating, Oil Leaks, and Excessive Noise
5.2.3 Opportunities
5.2.3.1 Increasing Installation of Gearboxes in Renewable Generation, With A Skew Towards Wind Farm Sector
5.2.4 Challenges
5.2.4.1 Availability of Substitutes Such as Variable Frequency Drives (VFDS)
6 Market, By Type (Page No. - 40)
6.1 Introduction
6.2 Helical Industrial Gearbox
6.3 Planetary Industrial Gearbox
6.4 Bevel Industrial Gearbox
6.5 Spur Industrial Gearbox
6.6 Worm Industrial Gearbox
6.7 Others (Combination Gears Such as Helical-Bevel, Planetary-Worm)
7 Market, By Design (Page No. - 48)
7.1 Introduction
7.2 Parallel Axis
7.3 Angled Axis
7.4 Others (Non-Coplanar, Non � Parallel Axis)
8 Market, By Industry (Page No. - 52)
8.1 Introduction
8.2 Wind Power
8.3 Cement & Aggregates
8.4 Chemicals, Rubber & Plastic
8.5 Construction
8.6 Food & Beverage
8.7 Marine
8.8 Material Handling (Includes Lawn & Turf, Other Conveying Equipment�s for Larger Group of Manufacturing Industries)
8.9 Metals & Mining
8.10 Power Generation (Excluding Wind Power)
8.11 Recreational Vehicle
8.12 Transportation Industry (Excluding Automotive)
8.13 Agriculture
8.14 Automotive
8.15 Others
9 Market, By Region (Page No. - 69)
9.1 Introduction
9.2 Asia Pacific
9.2.1 By Type
9.2.2 By Design
9.2.3 By Industry
9.2.4 By Country
9.2.4.1 China
9.2.4.2 Japan
9.2.4.3 India
9.2.4.4 South Korea
9.2.4.5 Australia
9.2.4.6 Rest of Asia Pacific
9.3 North America
9.3.1 By Type
9.3.2 By Design
9.3.3 By Industry
9.3.4 By Country
9.3.4.1 Us
9.3.4.2 Canada
9.3.4.3 Mexico
9.4 Europe
9.4.1 By Type
9.4.2 By Design
9.4.3 By Industry
9.4.4 By Country
9.4.4.1 Germany
9.4.4.2 France
9.4.4.3 Italy
9.4.4.4 Uk
9.4.4.5 Russia
9.4.4.6 Rest of Europe
9.5 Middle East & Africa
9.5.1 By Type
9.5.2 By Design
9.5.3 By Industry
9.5.4 By Country
9.5.4.1 Saudi Arabia
9.5.4.2 UAE
9.5.4.3 Qatar
9.5.4.4 South Africa
9.5.4.5 Rest of the Middle East & Africa
9.6 South America
9.6.1 By Type
9.6.2 By Industry
9.6.3 By Country
9.6.3.1 Brazil
9.6.3.2 Argentina
9.6.3.3 Rest of South America
10 Competitive Landscape (Page No. - 111)
10.1 Introduction
10.2 Competitive Situation & Trends
10.3 Ranking of Players, 2017
10.4 Competitive Scenario
10.4.1 New Product Developments
10.4.2 Investments & Expansions
10.4.3 Mergers & Acquisitions
10.4.4 Contracts & Agreements
11 Company Profiles (Page No. - 118)
11.1 Company Benchmarking.
(Business Overview, Products Offered, Recent Developments, MnM View)*
11.2 Emerson Electric Co.
11.3 Johnson Electric Holdings Limited
11.4 Siemens AG
11.5 Sumitomo Heavy Industries Ltd.
11.6 Watt Drive Weg Group.
11.7 Sew-Eurodrive
11.8 GKN Off-Highway Powertrain
11.9 ABB
11.10 Bauer Gear Motor
11.11 Bondioli & Pavesi
11.12 Dana Brevini
11.13 Bonfiglioli
11.14 Comer Industries
11.15 Elecon Engineering
11.16 China High Speed Transmission Equipment Group Co., Ltd.
*Business Overview, Products Offered, Recent Developments, MnM View Might Not Be Captured in Case of Unlisted Companies.
12 Appendix (Page No. - 151)
12.1 Insights of Industry Experts
12.2 Discussion Guide
12.3 Knowledge Store: Marketsandmarkets� Subscription Portal
12.4 Available Customizations
12.5 Related Reports
12.6 Author Details
List of Tables (73 Tables)
Table 1 Global Industrial Gearbox Market Snapshot
Table 2 Energy Regulations and Standards
Table 3 Industrial Gearbox Market Size, By Type, 2016�2023 (USD Billion)
Table 4 Helical Industrial Gearbox: Market Size, By Region, 2016�2023 (USD Billion)
Table 5 Planetary Industrial Gearbox: Market Size, By Region, 2016�2023 (USD Billion)
Table 6 Bevel Industrial Gearbox: Market Size, By Region, 2016�2023 (USD Billion)
Table 7 Spur Industrial Gearbox: Market Size, By Region, 2016�2023 (USD Million)
Table 8 Worm Industrial Gearbox: Market Size, By Region, 2016�2023 (USD Million)
Table 9 Others: Market Size, By Region, 2016�2023 (USD Million)
Table 10 Market Size, By Design, 2016�2023 (USD Billion)
Table 11 Parallel Axis: Market Size, By Region, 2016�2023 (USD Billion)
Table 12 Angled Axis: Market Size, By Region, 2016�2023 (USD Billion)
Table 13 Others: Market Size, By Region, 2016�2023 (USD Million)
Table 14 Market Size, By Industry, 2016�2023 (USD Million)
Table 15 Wind Power: Market Size, By Region, 2016�2023 (USD Million)
Table 16 Cement & Aggregates: Market Size, By Region, 2016�2023 (USD Million)
Table 17 Chemicals, Rubbers & Plastic: Market Size, By Region, 2016�2023 (USD Million)
Table 18 Construction: Market Size, By Region, 2016�2023 (USD Million)
Table 19 Food & Beverage: Market Size, By Region, 2016�2023 (USD Million)
Table 20 Marine: Market Size, By Region, 2016�2023 (USD Million)
Table 21 Material Handling: Market Size, By Region, 2016�2023 (USD Million)
Table 22 Metals & Mining: Market Size, By Region, 2016�2023 (USD Million)
Table 23 Power Generation (Excluding Wind Power): Market Size, By Region, 2016�2023 (USD Million)
Table 24 Recreational Vehicle: Market Size, By Region, 2016�2023 (USD Million)
Table 25 Transportation Industry: Market Size, By Region, 2016�2023 (USD Million)
Table 26 Agriculture: Market Size, By Region, 2016�2023 (USD Million)
Table 27 Automotive: Market Size, By Region, 2016�2023 (USD Million)
Table 28 Others: Market Size, By Region, 2016�2023 (USD Million)
Table 29 Industrial Gearbox Market Size, By Region, 2016�2023 (USD Billion)
Table 30 Asia Pacific: Market Size, By Type, 2016�2023 (USD Million)
Table 31 Asia Pacific: Industrial Gearbox Size, By Design, 2016�2023 (USD Million)
Table 32 Asia Pacific: Industrial Gearbox Size, By Industry, 2016�2023 (USD Million)
Table 33 Asia Pacific: Industrial Gearbox Size, By Country, 2016�2023 (USD Million)
Table 34 China: Industrial Gearbox Size, By Industry, 2016�2023 (USD Million)
Table 35 Japan: Market Size, By Industry, 2016�2023 (USD Million)
Table 36 India: Industrial Gearbox Size, By Industry, 2016�2023 (USD Million)
Table 37 South Korea: Market Size, By Industry, 2016�2023 (USD Million)
Table 38 Australia: Market Size, By Industry, 2016�2023 (USD Million)
Table 39 Rest of Asia Pacific: Industrial Gearbox Size, By Industry, 2016�2023 (USD Million)
Table 40 North America: Market Size, By Type, 2016�2023 (USD Million)
Table 41 North America: Industrial Gearbox Size, By Design, 2016�2023 (USD Million)
Table 42 North America: Industrial Gearbox Size, By Industry, 2016�2023 (USD Million)
Table 43 North America: Industrial Gearbox Size, By Country, 2016�2023 (USD Million)
Table 44 US: Market Size, By Industry, 2016�2023 (USD Million)
Table 45 Canada: Market Size, By Industry, 2016�2023 (USD Million)
Table 46 Mexico: Industrial Gearbox Size, By Industry, 2016�2023 (USD Million)
Table 47 Europe: Market Size, By Type, 2016�2023 (USD Million)
Table 48 Europe: Industrial Gearbox Size, By Design, 2016�2023 (USD Million)
Table 49 Europe: Industrial Gearbox Size, By Industry, 2016�2023 (USD Million)
Table 50 Europe: Industrial Gearbox Size, By Country, 2016�2023 (USD Million)
Table 51 Germany: Market Size, By Industry, 2016�2023 (USD Million)
Table 52 France: Industrial Gearbox Size, By Industry, 2016�2023 (USD Million)
Table 53 Italy: Market Size, By Industry, 2016�2023 (USD Million)
Table 54 UK: Market Size, By Industry, 2016�2023 (USD Million)
Table 55 Russia: Market Size, By Industry, 2016�2023 (USD Million)
Table 56 Rest of Europe: Industrial Gearbox Size, By Industry, 2016�2023 (USD Million)
Table 57 Middle East & Africa: Market Size, By Type, 2016�2023 (USD Million)
Table 58 Middle East & Africa: Industrial Gearbox Size, By Design, 2016�2023 (USD Million)
Table 59 Middle East & Africa: Industrial Gearbox Size, By Industry, 2016�2023 (USD Million)
Table 60 Middle East & Africa: Industrial Gearbox Size, By Country, 2016�2023 (USD Million)
Table 61 Saudi Arabia: Market Size, By Industry, 2016�2023 (USD Million)
Table 62 UAE: Industrial Gearbox Size, By Industry, 2016�2023 (USD Million)
Table 63 Qatar: Industrial Gearbox Size, By Industry, 2016�2023 (USD Thousand)
Table 64 South Africa: Industrial Gearbox Size, By Industry, 2016�2023 (USD Thousand)
Table 65 Rest of the Middle East & Africa: Industrial Gearbox Size, By Industry, 2016�2023 (USD Million)
Table 66 South America: Market Size, By Type, 2016�2023 (USD Million)
Table 67 South America: Industrial Gearbox Size, By Design, 2016�2023 (USD Million)
Table 68 South America: Industrial Gearbox Size, By Industry, 2016�2023 (USD Million)
Table 69 South America: Industrial Gearbox Size, By Country, 2016�2023 (USD Million)
Table 70 Brazil: Market Size, By Industry, 2016�2023 (USD Million)
Table 71 Argentina: Market Size, By Industry, 2016�2023 (USD Million)
Table 72 Rest of South America: Industrial Gearbox Size, By Industry, 2016�2023 (USD Million)
Table 73 Bonfiglioli & Dana Brevini, the Most Active Player in the Market Between 2011 and July 2018
List of Figures (37 Figures)
Figure 1 Industrial Gearbox Segmentation
Figure 2 Industrial Gearbox Market: Research Design
Figure 3 Breakdown of Primary Interviews: By Company Type, Designation, and Region
Figure 4 Market Size Estimation Methodology: Bottom-Up Approach
Figure 5 Market Size Estimation Methodology: Top-Down Approach
Figure 6 Data Triangulation Methodology
Figure 7 Asia Pacific Held the Largest Share in the Market in 2017
Figure 8 Planetary Gearbox Segment is Expected to Grow at the Highest CAGR During the Forecast Period
Figure 9 Wind Power Segment Dominated the Market in 2017
Figure 10 Parallel Axis Segment is Expected to Dominate the Market From 2018 to 2023
Figure 11 Attractive Opportunities in the Market, 2018�2023
Figure 12 India is Expected to Grow at the Fastest Rate in the Asia Pacific Market During the Forecast Period
Figure 13 Helical Gearbox Segment is Expected to Dominate the Market During the Forecast Period
Figure 14 Wind Power Segment is Estimated to Grow at the Fastest Rate During the Forecast Period
Figure 15 Angled Axis Segment is Expected to Grow at the Fastest Rate During the Forecast Period
Figure 16 China Accounted for the Largest Share of the Asia Pacific Market in 2017
Figure 17 Industrial Gearbox Market: Drivers, Restraints, Opportunities, and Challenges
Figure 18 Helical Industrial Gearbox Segment is Expected to Be the Prominent Market With the Maximum Market Share During the Forecast Period
Figure 19 Parallel Axis Segment is Expected to Be the Prominent Market With the Maximum Market Share During the Forecast Period
Figure 20 Wind Power Segment is Expected to Dominate the Market With the Maximum Market Share During the Forecast Period
Figure 21 Asia Pacific is Expected to Grow at the Highest CAGR During the Forecast Period
Figure 22 Market for Industrial Gearbox in 2017
Figure 23 Asia Pacific: Market Snapshot
Figure 24 North America: Market Snapshot
Figure 25 New Product Development is the Most Widely Adopted Development Strategy Between, 2011 and July 2018
Figure 26 Ranking of Key Players in Market in 2017
Figure 27 Emerson Electric: Company Snapshot
Figure 28 Johnson Electric Holdings Limited: Company Snapshot
Figure 29 Siemens AG: Company Snapshot
Figure 30 Sumitomo Heavy Industries Ltd.: Company Snapshot
Figure 31 GKN Off-Highway Powertrain: Company Snapshot
Figure 32 ABB: Company Snapshot
Figure 33 Dana Group: Company Snapshot
Figure 34 Bonfiglioli: Company Snapshot
Figure 35 Comer Industries: Company Snapshot
Figure 36 Elecon Engineering: Company Snapshot
Figure 37 China High Speed Transmission Equipment Group: Company Snapshot


Growth opportunities and latent adjacency in Industrial Gearbox Market