Insulation Monitoring Devices Market by Response Time, Application (Power Utilities, Manufacturing and Production, Mining, Healthcare, Transportation), and Geography (North America, Europe, Asia Pacific, Rest of the World) - Global Forecast to 2035


Global Insulation Monitoring Devices Market Overview
The global insulation monitoring devices market is projected to experience robust growth from 2025 to 2035, driven by the increasing focus on electrical safety, asset protection, and operational reliability across industrial and commercial environments. Insulation monitoring devices play a crucial role in detecting insulation faults in ungrounded electrical systems, ensuring early fault identification and preventing equipment failure, electrical shocks, or fire hazards. These devices are designed to continuously monitor insulation resistance between live conductors and earth, issuing alarms when the resistance drops below a preset threshold. This proactive approach to insulation fault detection helps maintain system integrity, improve safety standards, and reduce maintenance costs.
With the rapid expansion of industrial automation, the increasing adoption of renewable energy systems, and growing demand for uninterrupted power supply, the importance of insulation monitoring devices has surged significantly. Modern industries rely on complex electrical networks where insulation degradation can lead to costly downtimes and safety risks. Insulation monitoring devices, therefore, form an integral part of predictive maintenance and asset protection strategies. Additionally, technological advancements such as digital monitoring, IoT integration, and real time fault diagnostics have enhanced the performance and reliability of these systems, enabling smarter and more efficient monitoring solutions.
Market Dynamics and Growth Drivers
The global market for insulation monitoring devices is being driven by several factors, including the increasing awareness of electrical safety regulations, the rising need for continuous system monitoring, and the growing emphasis on predictive maintenance. Insulation faults are a major cause of electrical failures and safety hazards in industrial plants, hospitals, power utilities, and transport systems. Traditional fault detection methods are often reactive, identifying problems only after a failure has occurred. Insulation monitoring devices, by contrast, offer continuous fault detection, enabling early intervention and minimizing system downtime.
The rapid adoption of automation and digitization in industries has led to an increase in the number of sensitive electronic systems and complex electrical networks. These systems require advanced protection mechanisms to ensure stable and safe operations. The integration of insulation monitoring devices into control panels, substations, and distribution systems allows operators to continuously monitor insulation health and address potential issues before they escalate.
Regulatory frameworks and safety standards such as IEC 61557 and IEC 60364 have further strengthened the adoption of insulation monitoring devices globally. Compliance with these standards ensures improved safety, reliability, and efficiency in electrical installations, particularly in critical environments such as hospitals and power plants where electrical continuity is essential.
Another major driver is the expansion of renewable energy systems, such as solar and wind power plants, which often operate on ungrounded electrical networks. Insulation monitoring devices are essential for maintaining operational safety and efficiency in such systems by continuously evaluating insulation resistance and alerting operators to faults that may compromise energy output or safety.
Market Segmentation by Response Time
The insulation monitoring devices market is segmented by response time into fast response and standard response devices.
Fast response insulation monitoring devices are designed for applications that require immediate fault detection and response. These devices are typically used in high risk environments where even a short delay in detecting insulation degradation could lead to equipment damage or safety hazards. Industries such as healthcare, mining, and power generation heavily rely on fast response devices to ensure the continuous monitoring of critical systems. For instance, in hospitals, uninterrupted power supply to life saving equipment such as ventilators and surgical tools is vital, and fast response insulation monitoring devices ensure that potential faults are detected and resolved instantly.
Standard response insulation monitoring devices are suitable for less critical applications where fault detection does not require immediate action. These devices are commonly used in industrial plants and manufacturing facilities for routine monitoring of equipment and electrical circuits. They provide reliable performance and long term system monitoring without the need for high speed response times. The flexibility and cost efficiency of standard response devices make them ideal for general industrial and commercial applications.
Market Segmentation by Application
The insulation monitoring devices market caters to a variety of industries, including power utilities, manufacturing and production, mining, healthcare, and transportation. Each sector has distinct requirements for electrical safety and operational reliability, making insulation monitoring devices a crucial component of their infrastructure.
Power Utilities represent a significant segment of the market, as they depend on high voltage equipment, transformers, generators, and distribution networks where insulation integrity is essential. Insulation monitoring devices help detect degradation in cables, switchgear, and control panels, ensuring system stability and reducing the risk of blackouts. As power grids become more complex with the integration of renewable energy and smart grid technologies, the demand for continuous insulation monitoring in power utilities is expected to rise.
Manufacturing and Production facilities use a wide range of electrically powered equipment, including motors, drives, conveyors, and automated machinery. Insulation failures in these systems can lead to costly downtime and production losses. Insulation monitoring devices play a vital role in maintaining operational efficiency by identifying early signs of wear, moisture intrusion, or material degradation in electrical circuits. Predictive maintenance enabled by insulation monitoring also reduces maintenance costs and extends equipment life.
Mining Industry applications require robust and reliable monitoring systems due to harsh environmental conditions such as humidity, dust, and vibration. Electrical systems in mines often operate in ungrounded networks where insulation degradation can lead to severe safety hazards or operational disruptions. Insulation monitoring devices in mining applications provide early warnings of insulation faults, ensuring worker safety and uninterrupted operation of critical machinery.
Healthcare is another major application area, driven by the need for uninterrupted power supply to sensitive medical equipment. Hospitals, laboratories, and healthcare facilities rely on insulation monitoring devices to ensure fault free electrical distribution systems, particularly in critical care areas such as operating rooms and intensive care units. These devices prevent electrical shocks, protect equipment, and guarantee continuous operation during medical procedures, thereby enhancing patient safety.
Transportation Sector applications include railways, electric vehicles, aerospace, and marine systems where electrical reliability is paramount. In electric traction systems and onboard power systems, insulation faults can lead to power interruptions, safety hazards, and equipment damage. Insulation monitoring devices provide real time monitoring of traction networks, control systems, and propulsion equipment, ensuring safe and efficient transportation operations. The rise of electric mobility and automated transport systems is further expanding the use of insulation monitoring technologies in this sector.
Regional Analysis
The global insulation monitoring devices market is geographically segmented into North America, Europe, Asia Pacific, and Rest of the World.
North America holds a substantial share of the market, driven by stringent safety standards, advanced industrial infrastructure, and strong adoption of predictive maintenance technologies. The United States and Canada are key markets, with increasing implementation of insulation monitoring systems across power utilities, healthcare institutions, and industrial plants. The growing integration of renewable energy systems and electric vehicles in the region also supports the demand for insulation monitoring devices.
Europe has been a pioneer in adopting insulation monitoring technologies, supported by stringent regulations on electrical safety and the widespread implementation of ungrounded power systems. Countries such as Germany, France, and the United Kingdom have a mature industrial base that relies on advanced monitoring systems to maintain high safety and reliability standards. The adoption of insulation monitoring in healthcare and transportation sectors is particularly high in Europe, reflecting the region’s focus on safety and technological innovation.
Asia Pacific is expected to witness the fastest growth in the insulation monitoring devices market during the forecast period. Rapid industrialization, expanding power infrastructure, and increasing awareness of electrical safety are driving market growth across China, Japan, India, and South Korea. The rise of manufacturing hubs and large scale adoption of automation technologies have created strong demand for insulation monitoring solutions in industrial and utility applications. Furthermore, the growing deployment of renewable energy systems such as solar farms and wind power plants in the region supports the use of insulation monitoring devices for ensuring operational safety and reliability.
Rest of the World, which includes Latin America, the Middle East, and Africa, is gradually emerging as a developing market for insulation monitoring devices. The expansion of mining, energy, and infrastructure projects in these regions has increased the need for reliable electrical safety systems. Governments and private enterprises are investing in modernizing electrical infrastructure, which is expected to drive the adoption of insulation monitoring solutions over the coming years.
Technological Advancements and Market Trends
The insulation monitoring devices market is undergoing significant technological evolution with the integration of digital technologies, IoT connectivity, and artificial intelligence. Modern insulation monitoring systems are equipped with smart sensors, real time analytics, and cloud based platforms that allow remote monitoring and diagnostics. These systems provide detailed insights into insulation health, enabling predictive maintenance and reducing operational costs.
The trend toward smart grids, industrial automation, and connected infrastructure is creating new opportunities for insulation monitoring devices. Integration with IoT networks allows operators to access real time data from multiple locations, improving decision making and operational efficiency. Artificial intelligence algorithms are being used to analyze insulation resistance data, identify patterns of degradation, and predict potential faults with greater accuracy.
The development of compact, modular, and easy to install devices has also expanded the adoption of insulation monitoring systems across small and medium enterprises. Additionally, wireless communication technologies are reducing the complexity of installation and enabling seamless connectivity between monitoring devices and central control units.
Environmental sustainability is another key trend influencing the market. Manufacturers are focusing on developing eco friendly and energy efficient insulation monitoring devices that minimize power consumption and align with global environmental standards.
Future Outlook
The future of the global insulation monitoring devices market appears highly promising as industries continue to prioritize safety, efficiency, and operational continuity. With ongoing advancements in monitoring technologies, the role of insulation monitoring devices is expected to expand beyond traditional fault detection toward comprehensive electrical health management systems. Increasing adoption across diverse sectors such as healthcare, power utilities, manufacturing, and transportation will further drive market growth.
As governments around the world continue to strengthen safety regulations and promote energy efficiency, the demand for insulation monitoring devices will continue to rise. The integration of AI and IoT technologies will transform insulation monitoring into a more predictive and data driven function, allowing industries to prevent failures before they occur.
This report categorizes the insulation monitoring devices market based on response time, application, and region.
Insulation Monitoring Devices Market, by Response Time:
- ¡Ü4 Second
- <7 Second
- >7 Second
Insulation Monitoring Devices Market, by Application:
- Power Utilities
- Manufacturing and Production
- Mining
- Healthcare
- Transportation
Insulation Monitoring Devices Market, by Region:
-
North America
- US
- Canada & Mexico
-
Europe
- Germany
- France
- UK
- Rest of Europe (Spain, Italy, Poland, Russia, Finland, Sweden, Belgium, the Netherlands, Switzerland, and Austria)
-
APAC
- China
- Japan
- South Korea
- Rest of APAC (India, Australia, Taiwan, Singapore, Hong Kong, Malaysia, Thailand, and New Zealand)
-
RoW
- Middle East & Africa
- South America
Key questions addressed by report
- Which are the major applications in the insulation monitoring devices market? How big is the opportunity for their growth in the developing economies in the next 5 years?
- Which are the major companies in the insulation monitoring devices market? What are their major strategies to strengthen their market presence?
- Will the growth of technologies such as AI and IoT, and the advent of factory automation help drive the implementation of insulation monitoring devices in the manufacturing and production applications?
- Which are the leading countries in the insulation monitoring devices market? What would be the share of the North America and Europe in this market the next 5 years?
- What will be the role of the standards and regulations by governments and associations in the adoption of insulation monitoring devices?
To speak to our analyst for a discussion on the above findings, click Speak to Analyst
 Exclusive indicates content/data unique to MarketsandMarkets and not available with any competitors.
Table of Contents
1 Introduction (Page No. - 15)
1.1 Study Objectives
1.2 Market Definition
1.3 Study Scope
1.3.1 Markets Covered
1.3.2 Years Considered
1.4 Currency
1.5 Limitations
1.6 Stakeholders
2 Research Methodology (Page No. - 18)
2.1 Research Data
2.1.1 Secondary Data
2.1.1.1 Secondary Sources
2.1.2 Primary Data
2.1.2.1 Primary Interviews With Experts
2.1.2.2 Breakdown of Primaries
2.1.2.3 Key Data From Primary Sources
2.1.3 Secondary and Primary Research
2.1.3.1 Key Industry Insights
2.2 Market Size Estimation
2.2.1 Bottom-Up Approach
2.2.1.1 Approach for Capturing Market Size By Bottom-Up Analysis (Demand Side)
2.2.2 Top-Down Approach
2.2.2.1 Approach for Capturing Market Size By Top-Down Analysis (Supply Side)
2.3 Market Breakdown and Data Triangulation
2.4 Research Assumptions
3 Executive Summary (Page No. - 29)
4 Premium Insights (Page No. - 34)
4.1 Market, 2018¨C2023 (USD Million)
4.2 Market in APAC
4.3 Developed vs Developing Markets for Insulation Monitoring Devices, 2018 and 2023 (USD Million)
4.4 Geographic Analysis: Market
4.5 Market, By Application (USD Million)
5 Market Overview (Page No. - 37)
5.1 Introduction
5.2 Market Dynamics: Market
5.2.1 Drivers
5.2.1.1 Prevention of Data Loss Due to Power Supply Fluctuations
5.2.1.2 Necessity of Electricals in It Systems
5.2.1.3 Increased Demand for Insulation Monitoring Devices From Renewable Energy Power Plants
5.2.2 Restraints
5.2.2.1 High Initial Investment Requirements
5.2.3 Opportunities
5.2.3.1 Increased Use of Insulation Monitoring Devices in Data Centers
5.2.3.2 Increasing Adoption of Insulation Monitoring Devices in Healthcare Sector
5.2.3.3 High Growth of Industry 4.0
5.2.4 Challenges
5.2.4.1 Overcoming the Deployment of Large It Systems
5.2.4.2 Lack of Skills and Expertise
5.3 Value Chain Analysis
6 Insulation Monitoring Devices Market, By Response Time (Page No. - 41)
6.1 Introduction
6.2 Mounting/Installation Types of Insulation Monitoring Devices
6.2.1 Din Rail
6.2.2 Screw Mounting
6.2.3 Panel Mounting
6.3 Response Time
6.3.1 =4 Second
6.3.2 <7 Second
6.3.3 >7 Second
7 Insulation Monitoring Devices Market, By Application (Page No. - 45)
7.1 Introduction
7.2 Power Utilities
7.2.1 Growth in Renewable Generation and Distributed Resources is Major Driver for Implementation of Insulation Monitoring Devices in Power Utilities.
7.3 Manufacturing and Production
7.3.1 Avoiding Downtime Due to Insulation Faults is Major Driver for Growth of Insulation Monitoring Devices in Manufacturing and Production
7.4 Healthcare
7.4.1 Use of Insulation Monitoring Devices in ICU and Operation Theatre are Major Growth Opportunities
7.5 Mining
7.5.1 Utmost Care Required in Mining Process is Key Factor for Growth of Insulation Monitoring Devices
7.6 Transportation
7.6.1 Increased Use of Insulation Monitoring in Electric Vehicles, Airways, Railways, Marine, and Autonomous Vehicles Likely to Drive Market Growth for Transportation Application
8 Geographic Analysis of Market (Page No. - 60)
8.1 Introduction
8.2 North America
8.2.1 US
8.2.1.1 Strong Presence of Mining and Power Utilities Industry in US Likely to Drive Market
8.2.2 Canada and Mexico
8.2.2.1 Increasing Investment in Cutting-Edge Technologies Expected to Fuel Growth of Insulation Monitoring Devices in Canada and Mexico
8.3 Europe
8.3.1 Germany
8.3.1.1 Continued Innovation and High Adoption in Power Utilities and Manufacturing & Production Expected to Drive Market in Germany
8.3.2 France
8.3.2.1 Focus on R&D to Develop Technological Capabilities Would Propel market Growth in France
8.3.3 UK
8.3.3.1 Continuous Focus on Digitalization and Enhancing Automation Likely to Drive Growth of Market in UK
8.3.4 Rest of Europe
8.3.4.1 Spain, Italy, Poland, Finland, Sweden, Belgium, the Netherlands, Switzerland, and Austria are Major Contributors to market in Rest of Europe
8.4 APAC
8.4.1 China
8.4.1.1 High Investment in Power Utilities Likely to Drive Growth of market in China
8.4.2 Japan
8.4.2.1 High Growth of Healthcare Sector in Japan to Fuel Growth of market
8.4.3 South Korea
8.4.3.1 Digital Revolution in Industrial Manufacturing Sector in South Korea Would Encourage Adoption of Insulation Monitoring Devices
8.4.4 Rest of APAC
8.4.4.1 Countries Such as India, Singapore, Taiwan, and Australia to Drive Growth of Market in Rest of APAC
8.5 RoW
8.5.1 Middle East and Africa
8.5.1.1 Oil & Gas and Mining to Fuel Growth of Insulation Monitoring Devices in Middle East and Africa
8.5.2 South America
8.5.2.1 Increased Demand in Advanced Manufacturing and Healthcare to Boost Growth of Insulation Monitoring Devices in South America
9 Competitive Landscape (Page No. - 80)
9.1 Introduction
9.2 Ranking of Market Players, 2017
9.2.1 Product Launch
9.2.2 Acquisition
9.2.3 Expansion and Recognition
9.2.4 Contract
10 Company Profiles (Page No. - 83)
10.1 Introduction
10.2 Key Players
(Business Overview, Products Offered, Recent Developments, MnM View, SWOT Analysis)*
10.2.1 Schneider Electric
10.2.2 ABB
10.2.3 Eaton
10.2.4 Littelfuse
10.2.5 Bender
10.2.6 Mitsubishi Electric
10.2.7 Siemens
10.2.8 Viper Innovations
10.2.9 Cirprotec
10.2.10 E. Dold & Sohne
10.3 Other Important Players
10.3.1 Hakel
10.3.2 Martens (GHM Group)
10.3.3 Muuntosahko Oy
10.3.4 Ppo-Elektroniikka OY
10.3.5 Megacon
10.3.6 Wei Dian Union(Hubei) Technology Co.,Ltd
10.3.7 Deif A/S
10.3.8 Renesas Electronics
10.3.9 Captech
10.3.10 Lemvigh-Muller
*Business Overview, Products Offered, Recent Developments, MnM View, SWOT Analysis Might Not Be Captured in Case of Unlisted Companies.
11 Appendix (Page No. - 107)
11.1 Insights of Industry Experts
11.2 Discussion Guide
11.3 Knowledge Store: Marketsandmarkets¡¯ Subscription Portal
11.4 Available Customizations
11.5 Related Reports
11.6 Author Details
List of Tables (52 Tables)
Table 1 Insulation Monitoring Devices Market, By Response Time, 2015¨C2023 (USD Million)
Table 2 Market, By Application, 2015¨C2023 (USD Million)
Table 3 Market for Power Utilities, By Region, 2015¨C2023 (USD Million)
Table 4 Market for Power Utilities in North America, By Country, 2015¨C2023 (USD Million)
Table 5 Market for Power Utilities in Europe, By Country, 2015¨C2023 (USD Million)
Table 6 Market for Power Utilities in APAC, By Country, 2015¨C2023 (USD Million)
Table 7 Market for Power Utilities in RoW, By Region, 2015¨C2023 (USD Million)
Table 8 Market for Manufacturing and Production, By Region, 2015¨C2023 (USD Million)
Table 9 Market for Manufacturing and Production in North America, By Country, 2015¨C2023 (USD Million)
Table 10 Market for Manufacturing and Production in Europe, By Country, 2015¨C2023 (USD Million)
Table 11 Market for Manufacturing and Production in APAC, By Country, 2015¨C2023 (USD Million)
Table 12 Market for Manufacturing and Production in RoW, By Region, 2015¨C2023 (USD Million)
Table 13 Market for Healthcare, By Region, 2015¨C2023 (USD Million)
Table 14 Market for Healthcare in North America, By Country, 2015¨C2023 (USD Million)
Table 15 Market for Healthcare in Europe, By Country, 2015¨C2023 (USD Million)
Table 16 Market for Healthcare in APAC, By Country, 2015¨C2023 (USD Million)
Table 17 Market for Healthcare in RoW, By Region, 2015¨C2023 (USD Million)
Table 18 Market for Mining, By Region, 2015¨C2023 (USD Million)
Table 19 Market for Mining in North America, By Country, 2015¨C2023 (USD Million)
Table 20 Market for Mining in Europe, By Country, 2015¨C2023 (USD Million)
Table 21 Market for Mining in APAC, By Country, 2015¨C2023 (USD Million)
Table 22 Market for Mining in RoW, By Region, 2015¨C2023 (USD Million)
Table 23 Market for Transportation, By Region, 2015¨C2023 (USD Million)
Table 24 Market for Transportation in North America, By Country, 2015¨C2023 (USD Million)
Table 25 Market for Transportation in Europe, By Country, 2015¨C2023 (USD Million)
Table 26 Market for Transportation in APAC, By Country, 2015¨C2023 (USD Million)
Table 27 Market for Transportation in RoW, By Region, 2015¨C2023 (USD Million)
Table 28 Market, By Region, 2015¨C2023 (USD Million)
Table 29 Market in North America, By Application, 2015¨C2023 (USD Million)
Table 30 Market in North America, By Country, 2015¨C2023 (USD Million)
Table 31 Market in US, By Application, 2015¨C2023 (USD Million)
Table 32 Market in Canada and Mexico, By Application, 2015¨C2023 (USD Million)
Table 33 Market in Europe, By Application, 2015¨C2023 (USD Million)
Table 34 Market in Europe, By Country, 2015¨C2023 (USD Million)
Table 35 Market in Germany, By Application, 2015¨C2023 (USD Million)
Table 36 Market in France, By Application, 2015¨C2023 (USD Million)
Table 37 Market in UK, By Application, 2015¨C2023 (USD Million)
Table 38 Market in Rest of Europe, By Application, 2015¨C2023 (USD Million)
Table 39 Market in APAC, By Application, 2015¨C2023 (USD Million)
Table 40 Market in APAC, By Country, 2015¨C2023 (USD Million)
Table 41 Market in China, By Application, 2015¨C2023 (USD Million)
Table 42 Market in Japan, By Application, 2015¨C2023 (USD Million)
Table 43 Market in South Korea, By Application, 2015¨C2023 (USD Million)
Table 44 Market in Rest of APAC, By Application, 2015¨C2023 (USD Million)
Table 45 Market in RoW, By Application, 2015¨C2023 (USD Million)
Table 46 Market in RoW, By Region, 2015¨C2023 (USD Million)
Table 47 Market in Middle East and Africa, By Application, 2015¨C2023 (USD Million)
Table 48 Market in South America, By Application, 2015¨C2023 (USD Million)
Table 49 Product Launch: Market, 2016
Table 50 Acquisition Market, 2016
Table 51 Expansion and Recognition: Market, 2015¨C2018
Table 52 Contract: Insulation Monitoring Devices Market, 2017
List of Figures (33 Figures)
Figure 1 Insulation Monitoring Devices Market Segmentation
Figure 2 Market: Research Design
Figure 3 Bottom-Up Approach to Arrive at Market Size
Figure 4 Top-Down Approach to Arrive at Market Size
Figure 5 Data Triangulation Methodology
Figure 6 Assumptions of Research Study
Figure 7 Market, 2015¨C2023 (USD Million)
Figure 8 Market, By Response Time, 2018 vs 2023
Figure 9 Market for Power Utilities to Witness Highest Growth During 2018¨C2023
Figure 10 Europe to Hold Largest Share of market By 2018
Figure 11 Europe Held Largest Size of market for Power Utilities in 2017
Figure 12 Power Utilities and Manufacturing & Production to Provide Attractive Opportunities for market
Figure 13 China to Hold Largest Share of market in APAC By 2023
Figure 14 China to Lead Market By 2023
Figure 15 Market in China to Grow at Highest CAGR From 2018 to 2023
Figure 16 Power Utilities to Hold Largest Size of market During Forecast Period
Figure 17 Necessity of Electricals in It Systems Drives Market
Figure 18 Value Chain Analysis (2017): Major Value Added During Research & Product Development and Manufacturing Stages
Figure 19 =4 S Response Time to Hold Largest Size of market During Forecast Period
Figure 20 Power Utilities to Lead market During Forecast Period
Figure 21 Fatalities in US Coal Mines
Figure 22 Geographic Snapshot: Market in APAC to Witness Highest Growth During Forecast Period
Figure 23 China to Hold Largest Size of market By 2023
Figure 24 North America: Market Snapshot
Figure 25 Europe: Snapshot of Market
Figure 26 APAC: Snapshot of Market
Figure 27 Ranking of Top 5 Players in market, 2017
Figure 28 Schneider Electric: Company Snapshot
Figure 29 ABB: Company Snapshot
Figure 30 Eaton: Company Snapshot
Figure 31 Littelfuse: Company Snapshot
Figure 32 Mitsubishi Electric: Company Snapshot
Figure 33 Siemens: Company Snapshot
The study involved 4 major activities in estimating the current size of the insulation monitoring devices market. Exhaustive secondary research has been conducted to collect information about the market, the peer market, and the parent market. Validating findings, assumptions, and sizing with industry experts across the value chain through primary research has been the next step. Both, top-down and bottom-up approaches have been employed to estimate the complete market size. After that, market breakdown and data triangulation methods have been used to estimate the market size of segments and subsegments.
Secondary Research
The research methodology used to estimate and forecast the market begins with capturing data on revenues of the key vendors in the market through secondary research. This study involves the use of extensive secondary sources, directories, and databases such as Hoovers, Bloomberg Businessweek, Factiva, and OneSource to identify and collect information useful for the technical and commercial study of the market. Vendor offerings have also been considered to determine the market segmentation. This entire research methodology includes the study of annual and financial reports of top players, presentations, press releases, journals, paid databases, trade directories, regulatory bodies, and safety standard organizations.
Primary Research
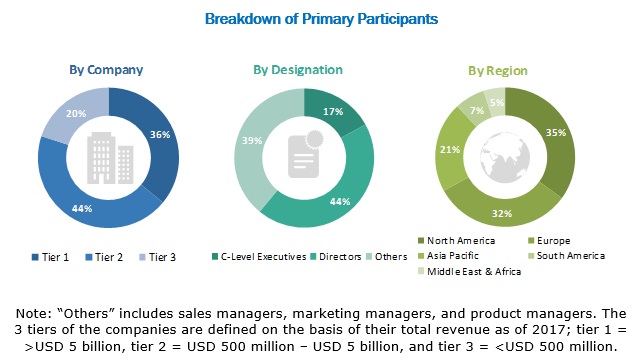
The insulation monitoring devices market comprises several stakeholders, such as suppliers, system integrators, suppliers of standard components, and original equipment manufacturers (OEMs) in the supply chain. The demand side of this market is characterized by the development of power utilities, manufacturing and production, healthcare, mining, and transportation applications. The supply side is characterized by advancements in types of insulation monitoring devices and its applications. Various primary sources from the supply and demand sides of the market have been interviewed to obtain qualitative and quantitative information. Following is the breakdown of primary respondents.
To know about the assumptions considered for the study, download the pdf brochure
Market Size Estimation
Both, top-down and bottom-up approaches have been used to estimate and validate the overall size of the market. These methods have also been used extensively to estimate the size of various market subsegments. The research methodology used to estimate the market size includes the following:
- Key players in major applications and markets have been identified through extensive secondary research.
- The industry¡¯s supply chain and market size, in terms of value, have been determined through primary and secondary research processes.
- All percentage shares, splits, and breakdowns have been determined using secondary sources and verified through primary sources.
Data Triangulation
After arriving at the overall market size using the estimation processes as explained above, the market was split into several segments and subsegments. To complete the overall market engineering process and arrive at the exact statistics of each market segment and subsegment, data triangulation, and market breakdown procedures have been employed, wherever applicable. The data have been triangulated by studying various factors and trends from both demand and supply sides in the power utilities, manufacturing and production, healthcare, mining, and transportation applications.
Report Objectives
- To define, describe, and forecast the insulation monitoring devices market, in terms of value, on the basis of response time, application and geography
- To forecast the size of the market for various segments with regard to 4 main regions: North America, Europe, Asia Pacific (APAC), and Rest of the World (RoW)
- To provide detailed information regarding the major factors influencing the growth of the market (drivers, restraints, opportunities, and challenges)
- To strategically analyze the micromarkets with regard to individual growth trends, prospects, and contributions to the total market
- To analyze the opportunities in the market for stakeholders by identifying high-growth segments in the market
- To analyze growth strategies such as acquisition, contract, expansion, and recognition of the key players in the market
- To strategically profile key players, comprehensively analyze their core competencies, and describe the competitive landscape of the market
Scope of the Report:
|
Report Metric |
Details |
|
Market size available for years |
2015¨C2023 |
|
Base year |
2017 |
|
Forecast period |
2018¨C2023 |
|
Units |
Value, USD |
|
Segments covered |
Response Time, Application, and Region |
|
Geographic regions covered |
North America, APAC, Europe, and RoW |
|
Companies covered |
ABB (Switzerland), Littelfuse (US), Mitsubishi Electric (Japan), Schneider Electric (France), Bender (Germany), Eaton (Ireland), Siemens (Germany), Viper Innovations (UK), Cirprotec (Spain), E. Dold & Sohne (Germany), Hakel (Czech Republic), Martens (GHM Group), Muuntosahko Oy (Finland), PPO-Elektroniikka Oy (Finland), Megacon (Norway), Wei Dian Union (Hubei) Technology (China), and DEIF (Denmark), |
This report categorizes the insulation monitoring devices market based on response time, application, and region.
Market, by Response Time:
- <4 Second
- <7 Second
- >7 Second
Market, by Application:
- Power Utilities
- Manufacturing and Production
- Mining
- Healthcare
- Transportation
Market, by Region:
-
North America
- US
- Canada & Mexico
-
Europe
- Germany
- France
- UK
- Rest of Europe
-
APAC
- China
- Japan
- South Korea
- Rest of APAC
- RoW
- Middle East & Africa
- South America
Available Customizations
With the given market data, MarketsandMarkets offers customizations according to the company¡¯s specific needs. The following customization options are available for the report:
Product Analysis
- Product matrix that gives a detailed comparison of the product portfolio of each company
Company Information
- Detailed analysis and profiling of additional market players (up to 5)


Growth opportunities and latent adjacency in Insulation Monitoring Devices Market