Interactive Projector Market by Technology (DLP, LCD), Projection Distance (Ultra short throw, short throw, and standard throw), Dimension (2D, and 3D), Application (Education, Corporate, and Government), Resolution, and Region - Global Forecast to 2022


The interactive projector market was valued at USD 670.3 Million in 2015 and is expected to reach USD 2,601.6 Million by 2022, growing at a CAGR of 21.5% between 2016 and 2022. The base year considered for study is 2015 and the forecast period is between 2016 and 2022.
This report provides a detailed analysis of the interactive projector market based on technology, projection distance, dimension, resolution, application, and geography. The report forecasts the market size, in terms of value, of various segments with regard to four main regions: North America, Europe, Asia-Pacific (APAC), and Rest of the World (RoW). It strategically profiles the key players and comprehensively analyzes their market rankings and core competencies, along the detailed competitive landscape for the market leaders.
The interactive projector market is expected to reach USD 2601.6 Million by 2022, at a CAGR of 21.5% between 2016 and 2022. The growth of this market is propelled by increasing adoption of interactive projectors in education segment, low cost of interactive projectors compared to interactive whiteboards, significant advantages of interactive projectors over conventional projectors. Increasing demand for ultra short throw projectors provide the opportunity for the interactive projectors market in the coming years.
The DLP technology is expected to dominate interactive projector market during the forecast period. DLP technology creates image with good contrast since the space between each micro-mirror is less than one micron, the space between pixels is greatly limited. DLP projectors are smaller and produce less noise than LCD projectors. DLP projectors are also cost effective than LCD projectors.
The ultra short throw projectors market is expected to grow at the highest rate during the forecast period. In ultra short throw projectors, distance between screen and projector is smallest compared to the short throw and standard throw projectors. A shorter throw projection would provide reduced shadows. It also restricts the quantity of light that hits a presenter’s eyes and can help in installations where space is limited
Projectors with resolution 1280*800 dominated the interactive projectors market in 2015 and expected to lead during forecast period as it offers clearer picture quality showing more picture details than 1024*768 and 854 *480 resolution projectors. Moreover, it is a cost-effective solution than higher resolution solutions.
The education segment expected to lead market during forecast period due to increased penetration of interactive projectors in the education application. Interactive projectors keep children engaged and increases collaborative learning. For instance, ten students (for example) can draw on an interactive projector screen at any time, making these projectors ideal for increasing engagement via group projects and presentations.
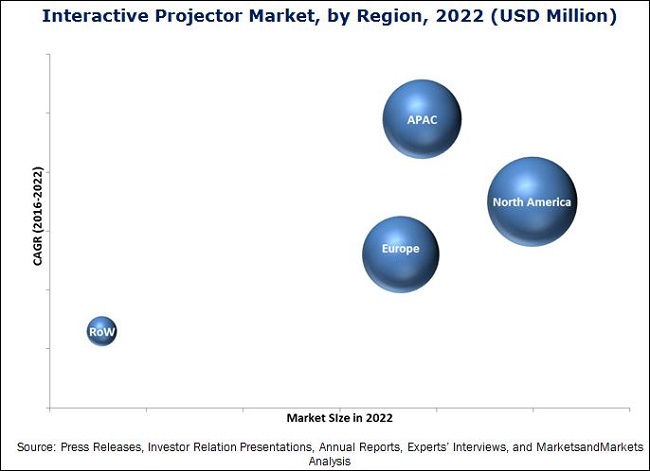
The market in APAC is expected to grow at the highest rate during the forecast period. Increasing penetration of interactive projectors in education segment in countries such as China, Japan, India, Australia, South Korea and Malaysia drives the growth of market. Increasing government support and education spending, technology adoption in education and corporate segment are some of the factors that drive the growth of the market
Low awareness of the consumers regarding interactive projectors restrains the growth of market. The key strategy adopted by major players in the market was new product development. The strategy accounted for 61% of all strategies. Companies such as BenQ Corp. (Taiwan) Mimio Boxlight (U.S.), NEC Display Solutions, Ltd. (Japan) are major companies that adopted this strategy.
To speak to our analyst for a discussion on the above findings, click Speak to Analyst
 Exclusive indicates content/data unique to MarketsandMarkets and not available with any competitors.
Table of Contents
1 Introduction (Page No. - 15)
1.1 Objectives of the Study
1.2 Market Definition
1.3 Study Scope
1.3.1 Markets Covered
1.3.2 Years Considered for the Study
1.4 Currency
1.5 Limitations
1.6 Stakeholders
2 Research Methodology (Page No. - 19)
2.1 Research Data
2.1.1 Secondary Data
2.1.1.1 Key Data From Secondary Sources
2.1.2 Primary Data
2.1.2.1 Key Data From Primary Sources
2.1.2.2 Key Industry Insights
2.1.2.3 Breakdown of Primary Interviews
2.2 Market Size Estimation
2.2.1 Bottom-Up Approach
2.2.2 Top-Down Approach
2.3 Market Breakdown and Data Traingulation
2.4 Assumptions
3 Executive Summary (Page No. - 27)
4 Premium Insights (Page No. - 31)
4.1 Interactive Projector Market, 2016 –2022 (USD Million)
4.2 Market, By Projection Distance
4.3 Market, By Region and Application
4.4 Market: Geographical Snapshot (2015)
5 Market Overview (Page No. - 34)
5.1 Introduction
5.2 Market Segmentation
5.2.1 By Technology
5.2.2 By Projection Distance
5.2.3 By Dimension
5.2.4 By Resolution
5.2.5 By Application
5.2.6 By Region
5.3 Market Dynamics
5.3.1 Drivers
5.3.1.1 Significant Advantages of Interactive Projectors Over Conventional Projectors
5.3.1.2 Increasing Adoption of Interactive Projectors in Education Segment
5.3.1.3 Low Cost of Interactive Projectors Compared to Interactive Whiteboard Systems
5.3.2 Restraints
5.3.2.1 Low Awareness of the Consumers Regarding Interactive Projectors in Developing Countries
5.3.3 Opportunities
5.3.3.1 Growing Demand for Ultra Short Throw Interactive Projectors
5.3.4 Challenges
5.3.4.1 Growing Adoption of Interactive Flat Panel Displays
6 Industry Trends (Page No. - 43)
6.1 Introduction
6.2 Value Chain Analysis
6.3 Porter’s Five Forces Analysis: Interactive Projector Market
6.3.1 Bargaining Power of Suppliers
6.3.2 Bargaining Power of Buyers
6.3.3 Threat of Substitutes
6.3.4 Threat of New Entrants
6.3.5 Intensity of Competitive Rivalry
7 Market, By Technology (Page No. - 50)
7.1 Introduction
7.2 Digital Light Processing (DLP) Technology
7.3 Liquid Crystal Display (LCD) Technology
7.4 Liquid Crystal on Silicon (LCoS) Technology
8 Market, By Projection Distance (Page No. - 61)
8.1 Introduction
8.2 Ultra-Short Throw
8.3 Short Throw
8.4 Standard Throw
9 Market By Dimension (Page No. - 66)
9.1 Introduction
9.2 2D Interactive Projectors
9.3 3D Interactive Projectors
10 Market, By Resolution (Page No. - 70)
10.1 Introduction
10.2 1920*1024 and 1920*720
10.3 1280*800
10.4 1024*768
10.5 Others (854*480)
11 Market, By Application (Page No. - 76)
11.1 Introduction
11.2 Education
11.3 Corporate
11.4 Government
11.5 Malls and Retail Shops
11.6 Restaurants, Nightclubs, Hotels, and Casinos
11.7 Healthcare
11.8 Museums and Exhibitions
11.9 Fun and Games
12 Geographic Analysis (Page No. - 96)
12.1 Introduction
12.2 North America
12.2.1 U.S.
12.2.2 Canada
12.2.3 Mexico
12.3 Europe
12.3.1 Germany
12.3.2 U.K.
12.3.3 France
12.3.4 Italy
12.3.5 Rest of Europe (RoE)
12.4 APAC
12.4.1 China
12.4.2 Japan
12.4.3 Australia
12.4.4 India
12.4.5 Rest of APAC (RoAPAC)
12.5 Rest of the World
12.5.1 Latin America
12.5.2 Middle East and Africa (MEA)
13 Competitive Landscape (Page No. - 128)
13.1 Market Player Ranking Analysis of the Interactive Projector Market
13.2 New Product Launches
13.3 Agreements/ Contracts/Collaborations/ Partnerships
13.4 Expansions
13.5 Mergers & Acquisitons
14 Company Profiles (Page No. - 134)
14.1 Introduction
(Business Overview, Products & Services, Key Insights, Recent Developments, SWOT Analysis, Ratio Analysis, MnM View)*
14.2 Seiko Epson Corp.
14.3 Panasonic Corp.
14.4 Benq Corp.
14.5 Dell Technologies Inc.
14.6 Mimio Boxlight
14.7 Casio Computer Co. Ltd.
14.8 NEC Display Solutions, Ltd.
14.9 Optoma Technology, Inc.
14.10 Touchjet, Inc.
14.11 Delta Electronics, Inc. ( Vivitek)
*Details on Business Overview, Products & Services, Key Insights, Recent Developments, SWOT Analysis, MnM View Might Not Be Captured in Case of Unlisted Companies.
15 Appendix (Page No. - 154)
15.1 Insights From Industry Experts
15.2 Discussion Guide
15.3 Knowledge Store: Marketsandmarkets’ Subscription Portal
15.4 Introducing RT: Real-Time Market Intelligence
15.5 Available Customization
15.6 Related Reports
15.7 Author Details
List of Tables (74 Tables)
Table 1 Currency Table
Table 2 Interactive Projector Market, By Technology
Table 3 Market, By Projection Distance
Table 4 Market, By Dimension
Table 5 Market, By Resolution
Table 6 Market, By Application
Table 7 Price for Interactive Projector (2015)
Table 8 Price for Interactive Whiteboard System
Table 9 Interactive Projector Market in Terms of Value and Volume (2013–2022)
Table 10 Market, By Technology, 2013–2022 (USD Million)
Table 11 Market for DLP Technology, By Dimension, 2013–2022 (USD Million)
Table 12 Interactive Projector Market for DLP Technology, By Resolution, 2013–2022 (USD Million)
Table 13 Market for DLP Technology, By Projection Distance, 2013–2022 (USD Million)
Table 14 Market for DLP Technology, By Application, 2013–2022 (USD Million)
Table 15 Market for LCD Technology, By Resolution, 2013–2022 (USD Million)
Table 16 Interactive Projector Market for LCD Technology, By Projection Distance, 2013–2022 (USD Million)
Table 17 Market for LCD Technology, By Application, 2013–2022 (USD Million)
Table 18 Market, By Projection Distance, 2013–2022 (USD Million)
Table 19 Market for Ultra-Short Throw Projectors, By Technology, 2013–2022 (USD Million)
Table 20 Market for Short Throw Projectors, By Technology, 2013–2022 (USD Million)
Table 21 Market for Standard Throw Projectors, By Technology, 2013–2022 (USD Million)
Table 22 Interactive Projector Market, By Dimension, 2013–2022 (USD Million)
Table 23 Market for 2D Dimension, By Technology, 2013–2022 (USD Million)
Table 24 Market, By Resolution, 2013–2022 (USD Million)
Table 25 Market for 1280*800 Resolution, By Technology, 2013–2022 (USD Million)
Table 26 Interactive Projector Market for 1024*768 Resolution, By Technology, 2013–2022 (USD Million)
Table 27 Market, By Application, 2013–2022 (USD Million)
Table 28 Market for Education Application, By Technology, 2013–2022 (USD Million)
Table 29 Interactive Projector Market for Education Application. By Region, 2013–2022 (USD Million)
Table 30 Market for Education Application in North America, By Country, 2013–2022 (USD Million)
Table 31 Market for Education Application, By Country, 2013–2022 (USD Million)
Table 32 Market for Education Application in APAC, By Country, 2013–2022 (USD Million)
Table 33 Interactive Projector Market for Education Application in RoW, By Country, 2013–2022 (USD Million)
Table 34 Market for Corporate Application, By Technology, 2013–2022 (USD Million)
Table 35 Interactive Projector Market for Corporate Application, By Region, 2013–2022 (USD Million)
Table 36 Market for Corporate Application, By Country, 2013–2022 (USD Million)
Table 37 Market for Corporate Application in Europe, By Country, 2013–2022 (USD Million)
Table 38 Market for Corporate Application in APAC, By Country, 2013–2022 (USD Million)
Table 39 Interactive Projector Market for Corporate Application in RoW, By Region, 2013–2022 (USD Million)
Table 40 Market for Government Application, By Technology, 2013–2022 (USD Million)
Table 41 Interactive Projector Market for Government Application, By Region, 2013–2022 (USD Million)
Table 42 Market for Government Application in North America, By Country, 2013–2022 (USD Million)
Table 43 Market for Government Application in Europe, By Country, 2013–2022 (USD Million)
Table 44 Interactive Projector Market for Government Application, By Country, 2013–2022 (USD Million)
Table 45 Market for Government Application in RoW, Byregion, 2013–2022 (USD Million)
Table 46 Interactive Projector Market, By Region, 2013–2022 (USD Million)
Table 47 Market in North America, By Country, 2013–2022 (USD Million)
Table 48 Market in North America, By Application, 2013–2022 (USD Million)
Table 49 Market in U.S., By Application, 2013–2022 (USD Million)
Table 50 Market in Canada, By Application, 2013–2022 (USD Million)
Table 51 Interactive Projector Market in Mexico, By Application, 2013–2022 (USD Million)
Table 52 Market in Europe, By Country, 2013–2022 (USD Million)
Table 53 Market in Europe, By Application, 2013–2022 (USD Million)
Table 54 Market in Germany, By Application, 2013–2022 (USD Million)
Table 55 Interactive Projector Market in U.K., By Application, 2013–2022 (USD Million)
Table 56 Market in France, By Application, 2013–2022 (USD Million)
Table 57 Interactive Projector Market in Italy, By Application, 2013–2022 (USD Million)
Table 58 Market in RoE, By Application, 2013–2022 (USD Million)
Table 59 Market in APAC, By Country, 2013–2022 (USD Million)
Table 60 Market in APAC, By Application, 2013–2022 (USD Million)
Table 61 Interactive Projector Market in China, By Application, 2013–2022 (USD Million)
Table 62 Market in Japan, By Application, 2013–2022 (USD Million)
Table 63 Interactive Projector Market in Australia, By Application, 2013–2022 (USD Million)
Table 64 Market in India, By Application, 2013–2022 (USD Million)
Table 65 Interactive Projector Market in RoAPAC, By Application, 2013–2022 (USD Million)
Table 66 Market in RoW, By Application, 2013–2022 (USD Million)
Table 67 Interactive Projector Market in RoW, By Region, 2013–2022 (USD Million)
Table 68 Market in Latin America, By Application, 2013–2022 (USD Million)
Table 69 Market in MEA, By Application, 2013–2022 (USD Million)
Table 70 Key Player Rank for Market
Table 71 New Product Launches, 2014–2016
Table 72 Agreements/Joint Ventures/Partnerships , 2013–2016
Table 73 Expansions, 2014–2016
Table 74 Mergers & Acquisitions, 2016
List of Figures (77 Figures)
Figure 1 Interactive Projector Market
Figure 2 Global Market: Research Design
Figure 3 Breakdown of Primary Interviews: By Company Type, Designation, and Region
Figure 4 Market Size Estimation Methodology: Bottom-Up Approach
Figure 5 Market Size Estimation Methodology: Top-Down Approach
Figure 6 Data Traingulation
Figure 7 DLP Projectors Dominated the Interactive Projector Market in 2015
Figure 8 Market, By Application (2016–2022)
Figure 9 Market, By Region, 2015
Figure 10 Attractive Growth Opportunities for the Market Between 2016 and 2022
Figure 11 Ultra Short Throw Interactive Projectors are Expected to Grow at the Highest Rate During the Forecast Period
Figure 12 North America Held the Major Share of the Global Market in 2015
Figure 13 U.S. Held the Largest Share of the Market in 2015
Figure 14 Market, By Region
Figure 15 Increased Adopttion of Interactive Projectors in Education Segment Drives the Market
Figure 16 Value Chain Analysis of the Market: Major Value Added By Component Manufacturers and Product Manufacturers
Figure 17 Porter’s Five Forces Analysis: Market (2015)
Figure 18 Porter’s Five Forces Analysis: Market
Figure 19 Impact Analysis of Bargaining Power of Suppliers
Figure 20 Impact Analysis of Bargaining Power of Buyers
Figure 21 Impact Analysis of Threat of Substitutes
Figure 22 Threat of New Entrants
Figure 23 Impact Analysis of Intensity of Competitive Rivalry
Figure 24 DLP Projectors are Expected to Dominate the Interactive Projectors Market During Forecast Period
Figure 25 3D Projectors are Expected to Lead DLP Interactive Projectors Market During Forecast Period
Figure 26 Projectors With 1920*1080 Resolution to Grow at the Highest Rate in the Market for DLP Technology During Forecast Period
Figure 27 Ultrashort Throw Projectors Expected to Grow at the Highest Rate in the Market for DLP Technology During Forecast Period
Figure 28 Education Segment to Dominate the Interactive Projectors Market for DLP Technology During the Forecast Period
Figure 29 Projectors With 1280*800 Resolution to Dominate the Interactive Projectors Market for LCD Technology During Forecast Period
Figure 30 Education Application to Lead the Market During Forecast Period
Figure 31 Short Throw Projectors to Dominate the Market During Forecast Period
Figure 32 LCD Technology Expected to Dominate the Interactive Projector Market for Ultra-Short Throw During the Forecast Period
Figure 33 DLP Technology is Expected to Lead the Market for Short Throw During Forecast Period
Figure 34 2D Interactive Projectors Lead the Market During Forecast Period
Figure 35 LCD Interactive Projectors to Dominate the Market for 2D Dimension During the Forecast Period
Figure 36 Interactive Projectors With 1280*800 Resolution Expected to Dominate the Market During the Forecast Period
Figure 37 LCD Projectors Expected to Dominate in Interactive Projectors Market With 1280*800 Resolution During the Forecast Period
Figure 38 DLP Projectors Play Vital Role for 1024*768 Resolution Interactive Projectors Market During the Forecast Period
Figure 39 Education Application to Dominate the Interactive Projector Market During the Forecast Period
Figure 40 DLP Technology is Expected to Lead the Market for Education Application During the Forecast Period
Figure 41 North America to Lead the Market for Education Application During the Forecast Period
Figure 42 U.S. is Expected to Lead the North American Interactive Projector Market for Education Application During Forecast Period
Figure 43 China is Expected to Lead the Market for Education Application During Forecast Period
Figure 44 DLP Technology is Expected to Dominate the Market for Corporate Application During the Forecast Period
Figure 45 North America Expected to Dominate Market for Corporate Segment During Forecast Period
Figure 46 U.S. to Dominate the Interactive Projector Market for Corporate Application in North America During the Forecast Period
Figure 47 Germany is Expected to Lead the Market for Corporate Segment in Europe During the Forecast Period
Figure 48 Latin America is Expected to Lead Market for Corporate Application in RoW During Forecast Period
Figure 49 LCD Technology to Grow at Higher Rate for Interactive Projectors Market for Government Application During the Forecast Period
Figure 50 APAC Expected to Grow at the Highest Rate in the Interactive Projector Market for Government Application During the Forecast Period
Figure 51 China to Dominate Market for Government Application in APAC During the Forecast Period
Figure 52 Geographic Snapshot for the Market (2016–2022)
Figure 53 North America is Expected to Dominate the Interactive Projector Market During Forecast Period
Figure 54 North America: Market Snapshot (2016–2022)
Figure 55 U.S. to Dominate the Market in North America During the Forecast Period
Figure 56 Education Application to is Expected to Lead the Market in North America During the Forecast Period
Figure 57 Corporate Application is Expected to Grow at the Highest Rate in the Interactive Projectot Market in the U.S. Between 2016 and 2022
Figure 58 Germany is Expected to Dominate the Market in Europe During Forecast Period
Figure 59 Education is Expected to Dominate the Market in Europe During Forecast Period
Figure 60 Corporate Application is Expected to Grow at the Highest Rate in the Market in Germany Between 2016 and 2022
Figure 61 APAC: Market Snapshot (2016–2022)
Figure 62 China is Expected to Dominate the Interactive Projector Market in APAC During the Forecast Period
Figure 63 Education Application is Expected to Lead for the Market in APAC During Forecast Period
Figure 64 Education Application is Expected to Lead the Market in China Between 2016 and 2022
Figure 65 Euducation Application to Dominate the Market in Japan Between 2016 and 2022
Figure 66 Education Application is Expected to Dominate the Market in RoW Between 2016 and 2022
Figure 67 Latin America to Lead the Market in RoW During Forecast Period
Figure 68 New Product Launches Was the Key Growth Strategy Over the Last Four Years (2011–2015)
Figure 69 Battle for Market Share: Agreement/Collaboration/Strategic Partnership Was the Key Strategy
Figure 70 Seiko Epson Corp.: Company Snapshot
Figure 71 SWOT Analysis: Seiko Epson Corp.
Figure 72 Panasonic Corp.: Company Snapshot
Figure 73 SWOT Analysis: Panasonic Corp.
Figure 74 SWOT Analysis: BENQ Corp.
Figure 75 SWOT Analysis: Dell Technologies, Inc
Figure 76 SWOT Analysis: Mimio Boxlight
Figure 77 Casio Computer Co., Ltd: Company Snapshot
The research methodology used to estimate and forecast the interactive projectors market begins with capturing data on key vendor revenue through the secondary research such as Projectorcentral, Projector Reviews, The Journal. The vendor offerings are also taken into consideration to determine the market segmentation. The bottom-up procedure has been employed to arrive at the overall size of the global interactive projector market from the revenue of key players. After arriving at the overall market size, the total market has been split into several segments and subsegments which have been verified through the primary research by conducting extensive interviews of people holding key positions such as CEOs, VPs, directors, and executives. The market breakdown and data triangulation procedures have been employed to complete the overall market engineering process and arrive at the exact statistics for all segments and subsegments. The breakdown of the profiles of primaries has been depicted in the figure below:
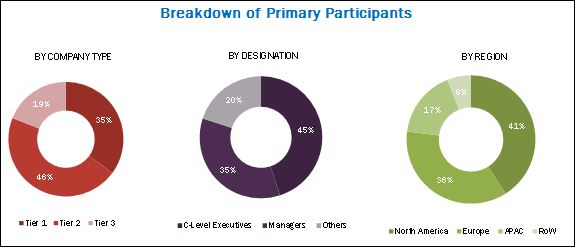
To know about the assumptions considered for the study, download the pdf brochure
The interactive projector ecosystem comprises raw material and component providers, product manufacturers, distributors, and end users. The players involved in the interactive projectors include Seiko Epson Corp. (Japan), BenQ Corp. (Taiwan), Mimio Boxlight (U.S.), Dell Technologies Inc. (U.S.), Panasonic Corp. (Japan),CASIO COMPUTER Co., Ltd. (Japan), NEC Display Solutions, Ltd. (Japan), Optoma Technology Inc. (U.S.), Touchjet Inc. (Singapore), and Delta Electronics Inc. (Taiwan).
Target audience of the report:
- Raw material vendors
- Component providers
- Product and accessories manufacturers
- Distributors
- End users such as education institutes, corporate customers, or government bodies
- Research organizations
This study answers several questions for the stakeholders, primarily which market segments to focus on in the next two to five years for prioritizing efforts and investments.
Scope of the report:
This research report categorizes the global interactive projector market on the basis of technology, projection distance, dimension, resolution, application and geography.
Interactive projector market, by Technology:
- DLP
- LCD
- LCoS
Interactive projector market, by Projection Distance:
- Ultra short throw
- Short throw
- Standard throw
Interactive projector market, by Dimension:
- 2D
- 3D
Interactive projector market, by Resolution:
- 1920*1080 and 1920*720
- 1280*800
- 1024*768
- Others (854*480)
Interactive projector market, by Application:
- Education
- Corporate
- Government
Interactive projector market, by Geography:
- North America
- Europe
- Asia-Pacific (APAC)
- Rest of the World (RoW)
Available Customizations:
With the given market data, MarketsandMarkets offers customizations according to the companies’ specific needs. The following customization options are available for the report:
Company Information:
Detailed analysis and profiling of additional market players (up to five)


Growth opportunities and latent adjacency in Interactive Projector Market
India Market Size in 2018 and Growth Trend, target customer segmentation, dealers, distributors for mini, wireless, Pico DLP Projectors.