Intraoperative Imaging Market by Product (Mobile C-arms, CT, Intraoperative MRI, Ultrasound, X ray), Application (Neurosurgery, Orthopedic & Trauma Care, Spine, CVDs, ENT, Gastroenterology), End User (Hospitals, ASCs, Academia) & Region - Global Forecast to 2025
Market Growth Outlook Summary
The global intraoperative imaging market growth forecasted to transform from $1.9 billion in 2020 to $2.5 billion by 2025, driven by a CAGR of 5.2%. Key growth drivers include technological advancements, increasing surgeries, and rising investments. The market faces challenges from high costs and hospital budget cuts, but there are significant opportunities in emerging economies like India and China. Mobile C-arms and neurosurgery applications dominate the market. Major players include General Electric, Siemens Healthineers, Medtronic, and Philips, with North America leading the regional market due to advanced healthcare infrastructure.
Intraoperative Imaging Market Trends
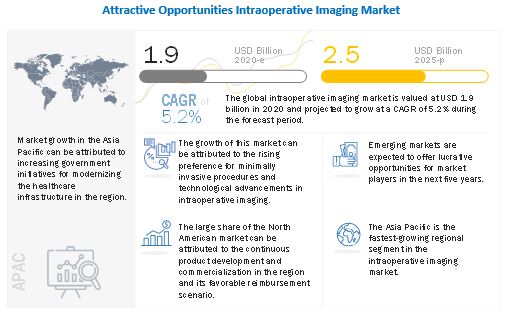
To know about the assumptions considered for the study, download the pdf brochure
Intraoperative Imaging Market Dynamics
Driver: Technological advancements in intraoperative imaging modalities
Over the past decade, the medical device sector has witnessed significant transformations and technological advancements in intraoperative imaging, including the emergence of focused imaging technologies and portable/handheld/smartphone-based intraoperative imaging devices. Technologically advanced intraoperative imaging systems offer faster results, higher image quality, easier operations, and simplified consoles as compared to traditional imaging devices.
The key players in the intraoperative imaging market are increasingly focusing on launching novel, technologically advanced products. Innovation in this market focuses on developing economical, technologically advanced, and easy-to-use intraoperative imaging systems. An important technological advancement is a reduction in the noise produced by intraoperative imaging systems. Key players have continually produced devices that produce far less sound. Such advancements focus on improving the functionality of intraoperative imaging systems and expanding their application areas, thereby driving the demand for these systems among end users.
Restraint: High cost of intraoperative imaging systems
Intraoperative imaging systems are priced at a premium and require high investments for installations, increasing the procedural cost for patients. This affects the adoption rate of new systems, especially in emerging countries; most healthcare facilities in these countries, consequently, cannot afford such systems.
Healthcare facilities that purchase such costly systems often depend on third-party payers (such as Medicare, Medicaid, or private health insurance plans) to reimburse costs incurred in screening and therapeutic procedures performed using these systems. As a result, factors such as continuous cuts in reimbursements for intraoperative imaging scans and the increasing cost of intraoperative imaging systems prevent medium-sized and small healthcare facilities from investing in advanced intraoperative imaging modalities.
Opportunity: High growth opportunities in emerging countries
Developing economies such as India, China, Brazil, South Korea, Turkey, Russia, and South Africa offer high growth opportunities for the major players in the intraoperative imaging market. Although the cost factor is a concern in these developing countries, their huge population bases—especially in India and China—indicate a sustainable market for intraoperative imaging devices.
The higher incidence of chronic diseases such as cancer, stroke, nephrology, neurological surgery, and cardiovascular diseases, as well as the higher death rates in these countries, showcase the need for early detection. For instance, GLOBOCAN 2018 data estimated that roughly 50% of the global cancer population lived in developing regions. In addition, regulatory policies are more adaptive and business-friendly in Asia-Pacific countries than in western countries. Increasing competition in mature markets is expected to compel intraoperative imaging system manufacturers to focus on emerging markets.
Challenge: Hospital budget cuts
In response to increasing government pressure to reduce healthcare costs, several healthcare providers have aligned themselves with group purchasing organisations (GPOs), integrated health networks (IHNs), and integrated delivery networks (IDNs). These organisations aggregate their members’ purchases and bargain for a competitive price with the suppliers and manufacturers of medical devices. GPOs, IHNs, and IDNs negotiate heavily for bulk purchases of intraoperative imaging devices. The rising cost of prescription drugs and a sharp decline in the proposed budget allocations for health and human services in the US, as of 2019, have significantly reduced hospital budgets. A study by the American Hospital Association estimated that federal payment cuts to hospitals would amount to USD 218 billion by 2028, forcing hospitals to allocate smaller budgets annually.
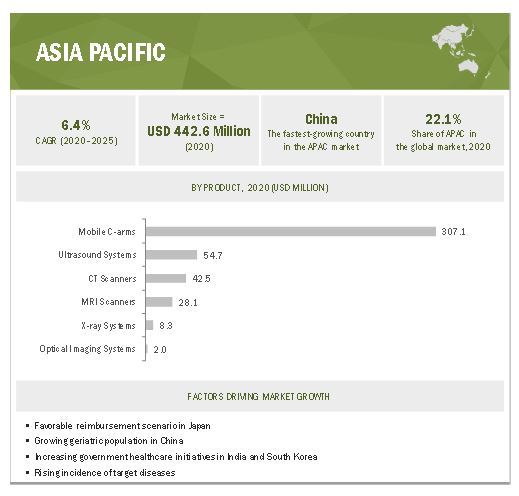
By product, the mobile c-arm segment is expected to have the largest intraoperative imaging industry share during the forecast period.
Mobile C-arms are medical imaging devices that comprise a generator, the X-ray source, and an image intensifier or flat-panel detector. The X-rays emitted by the generator penetrate the patient's body and are then converted into visible images by the image intensifiers or detectors before being displayed on the monitor. The growing demand for mobile C-arms is mainly attributed to their broadening application horizons. For instance, C-arms are used for a wide range of applications, including cardiovascular surgeries, neurosurgery, gastroenterology surgeries, orthopedics, traumatology, and urology disorders.
Neurosurgery is the largest application segment of the intraoperative imaging industry.
The growing demand for intraoperative imaging solutions in neurosurgery is mainly attributed to the increasing adoption of intraoperative imaging products among medical professionals, owing to technological advancements and rising awareness of intraoperative techniques. For instance, C-arms with high resolution and penetration are essential in monitoring the positioning of screws, instruments, implants, and the injected cement. Furthermore, 3D imaging with navigation enhances treatment precision and enables the intraoperative evaluation of surgical procedures. The use of C-arms for neurosurgery, especially spinal surgeries, is expected to increase in the coming years on account of technological advancements that have made diagnosing and treating issues easier than before.
Hospitals and diagnostic centres accounted for the largest share of the intraoperative imaging industry among end users.
Hospitals routinely conduct a wide range of surgical procedures, and most of these surgeries are performed in hospital inpatient settings. Growth in this segment of the intraoperative imaging market is primarily attributed to the growing number of minimally invasive surgeries and electrosurgery procedures performed in hospitals and the adoption of robotic surgery. The adoption of intraoperative imaging instruments is higher in hospitals, owing to their higher purchasing power and larger volume of surgeries performed. The rising incidence of road accidents, fall-related injuries, and sports injuries has resulted in an increasing number of orthopaedic surgeries performed in hospitals. By adding to the procedural volume, the growing incidence of ailments requiring surgical treatment supports the use of intraoperative imaging devices.
North America is the largest region of the intraoperative imaging industry.
North America (comprising the US and Canada) dominates the intraoperative imaging market. North America is a mature market, with high penetration of intraoperative imaging technologies among key end users and well-established distribution channels for intraoperative imaging product manufacturers and suppliers. Easy accessibility to and the high adoption of advanced technologies due to the significant per capita annual healthcare expenditure by the US and Canadian governments, as well as supportive government regulations, are driving the growth of the global market in this region.
Prominent key players in the intraoperative imaging market are General Electric Company (US), Siemens Healthineers AG (Germany), Ziehm Imaging GmbH (Germany), Medtronic (Ireland), Koninklijke Philips N.V. (Netherlands), Canon Healthcare (Japan), Stryker (US), Brainlab AG (Germany), IMRIS (US), Shimadzu Corporation (Japan), Shenzhen Anke High-tech Co. (China), Hitachi, Ltd. (Japan), FUJIFILM Holdings (Japan), Carl Zeiss Meditec AG (Germany), Mindray Ltd. (US), Carestream Health (US), Analogic Corporation (US), Allengers Medical Systems Ltd. (India), Esaote SpA (Italy) and NeuroLogica Corporation (US).
Scope of the Intraoperative Imaging Industry
|
Report Metric |
Details |
|
Market Revenue Size in 2020 |
$1.9 billion |
|
Projected Revenue Size by 2025 |
$2.5 billion |
|
Industry Growth Rate |
Poised to grow at a CAGR of 5.2% |
|
Market Driver |
Technological advancements in intraoperative imaging modalities |
|
Market Opportunity |
High growth opportunities in emerging countries |
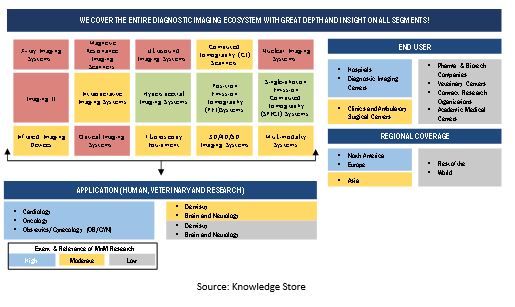
This research report categorizes the global intraoperative imaging market to forecast revenue and analyze trends in each of the following submarkets:
By Product
- Mobile C Arm
-
Ultrasound
- Laparoscopic probes
- Drop-in probes
- Other devices
- CT
- MRI
- X Rays
- Intraoperative optical imaging
By Application
- Neurosurgery
- Orthopedic & Trauma Surgery
- Spine Surgery
- Cardiovascular Surgery
- ENT Surgery
- Oncology
- Emergency & Trauma Surgery
- Urological
- HPB surgery
- Colorectal
- General Surgery
- Other Applications
By End Users
- Hospitals & Diagnostic Centers
- Ambulatory Surgical Centers and Clinics
- Research Laboratories & Academic Institutes
By Region
-
North America
- US
- Canada
-
Europe
- Germany
- UK
- France
- Italy
- Spain
- RoE
-
Asia Pacific
- Japan
- China
- India
- RoAPAC
-
Latin America
- Brazil
- Mexico
- Rest of Latin America
- Middle East and Africa
Recent Developments of Intraoperative Imaging Industry
- In 2019, Canon Medical (Japan) launched Global Illumination next-generation rendering capabilities to allow clinicians to visualize and manipulate photo-realistic anatomical images
- In 2019, Seimens AG (Germany) established a new R&D center in Bengaluru, India, which offers diagnostic imaging solutions and advanced therapies. The center will manufacture mobile C-arm devices locally in India.
- In 2019, IMRIS, Deerfield Imaging announced a collaboration with the Prince Sultan Military Medical City and distributor Gulf Medical Company to install the first IMRIS Surgical Theatre in Saudi Arabia.
- In 2018, Koninklijke Philips N.V. (Netherlands) established an AI lab in Shanghai, China. The AI lab is dedicated to driving the integration of AI technologies in medical imaging, image-guided therapies, patient monitoring, health informatics, home care, and personal health applications.
Frequently Asked Questions (FAQ):
What is the projected market revenue value of the global intraoperative imaging market?
The global intraoperative imaging market boasts a total revenue value of $2.5 billion by 2025.
What is the estimated growth rate (CAGR) of the global intraoperative imaging market?
The global intraoperative imaging market has an estimated compound annual growth rate (CAGR) of 5.2% and a revenue size in the region of $1.9 billion in 2020.
To speak to our analyst for a discussion on the above findings, click Speak to Analyst

TABLE OF CONTENTS
1 INTRODUCTION (Page No. - 20)
1.1 OBJECTIVES OF THE STUDY
1.2 INTRAOPERATIVE IMAGING INDUSTRY DEFINITION
1.2.1 MARKET SCOPE
FIGURE 1 MARKETS COVERED
1.2.2 GEOGRAPHIC SCOPE
1.2.3 YEARS CONSIDERED FOR THE STUDY
1.3 CURRENCY USED FOR THE STUDY
1.4 MAJOR MARKET STAKEHOLDERS
1.5 SUMMARY OF CHANGES
2 RESEARCH METHODOLOGY (Page No. - 24)
2.1 RESEARCH DATA
FIGURE 2 RESEARCH DESIGN
2.1.1 SECONDARY DATA
2.1.1.1 Secondary sources
2.1.2 PRIMARY DATA
FIGURE 3 BREAKDOWN OF PRIMARIES: INTRAOPERATIVE IMAGING MARKET
2.2 MARKET ESTIMATION METHODOLOGY
FIGURE 4 RESEARCH METHODOLOGY: HYPOTHESIS BUILDING
2.2.1 END USER -BASED MARKET ESTIMATION
2.2.2 REVENUE MAPPING-BASED MARKET ESTIMATION
FIGURE 5 MARKET SIZE ESTIMATION: GLOBAL MARKET
2.2.3 PRIMARY RESEARCH VALIDATION
2.3 DATA TRIANGULATION
FIGURE 6 DATA TRIANGULATION METHODOLOGY
2.4 RESEARCH ASSUMPTIONS
2.5 RESEARCH LIMITATIONS
3 EXECUTIVE SUMMARY (Page No. - 32)
FIGURE 7 INTRAOPERATIVE IMAGING MARKET, BY PRODUCT, 2020 VS. 2025
FIGURE 8 GLOBAL MARKET, BY APPLICATION, 2020 VS. 2025
FIGURE 9 GLOBAL MARKET, BY END USER, 2020 VS. 2025
FIGURE 10 ASIA PACIFIC INTRAOPERATIVE IMAGING INDUSTRY TO GROW AT THE HIGHEST CAGR DURING THE FORECAST PERIOD
4 PREMIUM INSIGHTS (Page No. - 35)
4.1 INTRAOPERATIVE IMAGING MARKET OVERVIEW
FIGURE 11 INCREASING PREVALENCE OF TARGET DISEASES TO DRIVE MARKET GROWTH
4.2 GLOBAL MARKET, BY PRODUCT
FIGURE 12 MOBILE C-ARMS TO ACCOUNT FOR THE LARGEST SHARE OF THE MARKET DURING THE FORECAST PERIOD
4.3 APAC: GLOBAL MARKET, BY COUNTRY AND PRODUCT
FIGURE 13 JAPAN IS THE LARGEST MARKET FOR INTRAOPERATIVE IMAGING IN APAC
4.4 GLOBAL MARKET SHARE, BY END USER
FIGURE 14 HOSPITALS & DIAGNOSTIC CENTERS TO ACCOUNT FOR THE LARGEST MARKET SHARE DURING THE FORECAST PERIOD
4.5 GEOGRAPHICAL SNAPSHOT OF THE GLOBAL INTRAOPERATIVE IMAGING INDUSTRY
FIGURE 15 CHINA TO REGISTER THE HIGHEST CAGR DURING THE FORECAST PERIOD
5 MARKET OVERVIEW (Page No. - 39)
5.1 INTRODUCTION
5.2 MARKET DYNAMICS
FIGURE 16 INTRAOPERATIVE IMAGING MARKET: DRIVERS, RESTRAINTS, OPPORTUNITIES, AND CHALLENGES
5.2.1 DRIVERS
5.2.1.1 Rising geriatric population and growth in the prevalence of chronic diseases
TABLE 1 AGE-RELATED DISEASES: PREVALENCE AND ESTIMATIONS
5.2.1.2 Technological advancements in intraoperative imaging modalities
5.2.1.3 Increasing demand for minimally invasive surgeries
5.2.1.4 Rising investments/funds/grants by public-private organizations
TABLE 2 KEY INVESTMENTS BY GOVERNMENT BODIES IN THE GLOBAL MARKET
5.2.2 RESTRAINTS
5.2.2.1 High cost of intraoperative imaging systems
5.2.2.2 Declining reimbursements and increasing regulatory burden
5.2.3 OPPORTUNITIES
5.2.3.1 High growth opportunities in emerging countries
5.2.3.2 Adoption of AI and analytics in intraoperative imaging
5.2.4 CHALLENGES
5.2.4.1 Hospital budget cuts
5.2.4.2 Dearth of trained professionals
5.2.4.3 Increasing adoption of refurbished systems
5.3 REGULATORY SCENARIO
5.4 ECOSYSTEM COVERAGE
5.5 VALUE CHAIN ANALYSIS
5.6 PRICING ANALYSIS
TABLE 3 INTRAOPERATIVE IMAGING PRODUCTS PRICING ANALYSIS (USD, 2019)
5.7 PORTER’S 5 FORCE ANALYSIS
6 INTRAOPERATIVE IMAGING MARKET, BY PRODUCT (Page No. - 49)
6.1 INTRODUCTION
TABLE 4 GLOBAL INTRAOPERATIVE IMAGING INDUSTRY, BY PRODUCT, 2018–2025
6.2 MOBILE C-ARMS
6.2.1 MULTI-FUNCTIONAL CAPABILITIES OF C-ARMS WILL INCREASE THEIR ADOPTION AMONG SURGEONS
TABLE 5 PRODUCT HIGHLIGHTS
TABLE 6 GLOBAL MARKET FOR MOBILE C-ARMS, BY REGION, 2018–2025
TABLE 7 GLOBAL MARKET FOR MOBILE C-ARMS, BY APPLICATION, 2018–2025
TABLE 8 GLOBAL MARKET FOR MOBILE C-ARMS, BY END USER, 2018–2025
6.3 ULTRASOUND SYSTEMS
6.3.1 DIAGNOSTIC SUPERIORITY AND GROWING APPLICATIONS WILL INCREASE THE ADOPTION OF INTRAOPERATIVE ULTRASOUND
TABLE 9 GLOBAL MARKET FOR ULTRASOUND SYSTEMS, BY PRODUCT, 2018–2025
TABLE 10 GLOBAL MARKET FOR ULTRASOUND SYSTEMS, BY REGION, 2018–2025
TABLE 11 GLOBAL MARKET FOR ULTRASOUND SYSTEMS, BY APPLICATION, 2018–2025
TABLE 12 GLOBAL MARKET FOR ULTRASOUND SYSTEMS, BY END USER, 2018–2025
6.3.2 DROP IN PROBES
6.3.2.1 Drop in Probes segment will dominate the ultrasound market in upcoming years
TABLE 13 GLOBAL MARKET FOR DROP IN PROBES, BY REGION, 2018–2025
6.3.3 LAPAROSCOPIC PROBES
6.3.3.1 Laparoscopic probe utilization is augmented by rising number of related surgical procedures across key geographies.
TABLE 14 GLOBAL MARKET FOR LAPAROSCOPIC PROBES, BY REGION, 2018–2025
6.3.4 OTHER ULTRASOUND SYSTEMS
6.3.4.1 Other ultrasound segment market will have smaller segment due to technical difficulties.
TABLE 15 GLOBAL MARKET FOR OTHER ULTRASOUND SYSTEMS, BY REGION, 2018–2025
6.4 CT SCANNERS
6.4.1 CT USE IN DIAGNOSTIC APPLICATIONS HAS RISEN SIGNIFICANTLY IN RECENT YEARS
TABLE 16 GLOBAL INTRAOPERATIVE IMAGING INDUSTRY FOR CT SCANNERS, BY REGION, 2018–2025
TABLE 17 GLOBAL MARKET FOR CT SCANNERS, BY APPLICATION, 2018–2025
TABLE 18 GLOBAL MARKET FOR CT SCANNERS, BY END USER, 2018–2025
6.5 MRI SCANNERS
6.5.1 FASTER SCAN TIMES AND INCREASED IMAGE QUALITY TO INCREASE THE ADOPTION OF INTRAOPERATIVE MRI SYSTEMS
TABLE 19 GLOBAL MARKET FOR MRI SCANNERS, BY REGION, 2018–2025
TABLE 20 GLOBAL MARKET FOR MRI SCANNERS, BY APPLICATION, 2018–2025
TABLE 21 GLOBAL MARKET FOR MRI SCANNERS, BY END USER, 2018–2025
6.6 X-RAY SYSTEMS
6.6.1 POSSIBILITY OF SIDE-EFFECTS DUE TO RADIATION EXPOSURE MAY HINDER MARKET GROWTH
TABLE 22 GLOBAL MARKET FOR X-RAY SYSTEMS, BY REGION, 2018–2025
TABLE 23 GLOBAL MARKET FOR X-RAY SYSTEMS, BY APPLICATION, 2018–2025
TABLE 24 GLOBAL MARKET FOR X-RAY SYSTEMS, BY END USER, 2018–2025
6.7 OPTICAL IMAGING SYSTEMS
6.7.1 GROWING DEMAND FOR NON-IONIZING IMAGING MODALITIES TO AID MARKET GROWTH
TABLE 25 GLOBAL MARKET FOR OPTICAL IMAGING SYSTEMS, BY REGION, 2018–2025
TABLE 26 GLOBAL MARKET FOR OPTICAL IMAGING SYSTEMS, BY APPLICATION, 2018–2025
TABLE 27 GLOBAL MARKET FOR OPTICAL IMAGING SYSTEMS, BY END USER, 2018–2025
7 INTRAOPERATIVE IMAGING MARKET, BY APPLICATION (Page No. - 65)
7.1 INTRODUCTION
TABLE 28 GLOBAL INTRAOPERATIVE IMAGING INDUSTRY, BY APPLICATION, 2018–2025
7.2 NEUROSURGERY
7.2.1 NEUROSURGERY HOLDS THE LARGEST SHARE OF THE APPLICATIONS MARKET
TABLE 29 GLOBAL MARKET FOR NEUROSURGERY, BY REGION, 2018–2025
7.3 CARDIOVASCULAR SURGERY
7.3.1 INCREASING PREVALENCE OF CARDIOVASCULAR DISEASES TO SUPPORT THE MARKET GROWTH
TABLE 30 GLOBAL MARKET FOR CARDIOVASCULAR SURGERY, BY REGION, 2018–2025
7.4 ORTHOPEDIC SURGERY
7.4.1 RISING GERIATRIC POPULATION & RISING OBESITY RATES HAVE DRIVEN THE NUMBER OF ORTHOPEDIC SURGERIES PERFORMED
TABLE 31 GLOBAL MARKET FOR ORTHOPEDIC SURGERY, BY REGION, 2018–2025
7.5 SPINE SURGERY
7.5.1 RISING NUMBER OF SPINE INJURIES AND GROWING ACCESS TO SPINE SURGERY WILL DRIVE MARKET GROWTH
TABLE 32 GLOBAL MARKET FOR SPINE SURGERY, BY REGION, 2018–2025
7.6 SURGICAL ONCOLOGY
7.6.1 INCREASING PREVALENCE OF CANCER WILL DRIVE THE MARKET GROWTH
TABLE 33 GLOBAL MARKET FOR SURGICAL ONCOLOGY, BY REGION, 2018–2025
7.7 EMERGENCY AND TRAUMA SURGERIES
7.7.1 EMERGENCY & TRAUMA CENTERS SUPPORTS THE GORWTH OF THIS SEGMENTS
TABLE 34 GLOBAL MARKET FOR EMERGENCY SURGERIES, BY REGION, 2018–2025
7.8 ENT SURGERY
7.8.1 GROWING FOCUS ON MINIMALLY INVASIVE AND IMAGE-GUIDED SURGERY SHOWCASE STRONG GROWTH POTENTIAL
TABLE 35 GLOBAL MARKET FOR ENT SURGERY, BY REGION, 2018–2025
7.9 UROLOGICAL SURGERY
7.9.1 GROWING INCIDENCE OF UROLOGICAL CONDITIONS TO AUGMENT POSITIVE GROWTH POTENTIAL OF RELATED SURGICAL PLATFORMS
TABLE 36 GLOBAL MARKET FOR UROLOGICAL SURGERY, BY REGION, 2018–2025
7.10 HBP (HEPATO-PANCREATICO-BILIARY) SURGERY
7.10.1 GROWING INCIDENCE OF UROLOGICAL SURGERY CONDISTIONS SHOWCASE STRONG GROWTH POTENTIAL
TABLE 37 GLOBAL MARKET FOR HPB SURGERY, BY REGION, 2018–2025
7.11 COLORECTAL SURGERIES
7.11.1 COLORECTAL SEGMENT IS LIKELY TO GROW AT SLOW GROWTH RATE IN UPCOMING YEAR
TABLE 38 GLOBAL MARKET FOR COLORECTAL SURGERIES, BY REGION, 2018–2025
7.12 GENERAL SURGERY
7.12.1 INCREASING NUMBER OF BARIATRIC SURGERY TO DRIVE MARKET GROWTH
TABLE 39 GLOBAL MARKET FOR GENERAL SURGERIES, BY REGION, 2018–2025
7.13 OTHER APPLICATIONS
7.13.1 OTHER APPLICATIONS SEGMENT IS LIKELY TO GROW AT SLOW GROWTH RATE IN UPCOMING YEAR
TABLE 40 GLOBAL INTRAOPERATIVE IMAGING INDUSTRY FOR OTHER APPLICATIONS, BY REGION, 2018–2025
8 INTRAOPERATIVE IMAGING MARKET, BY END USER (Page No. - 79)
8.1 INTRODUCTION
TABLE 41 GLOBAL INTRAOPERATIVE IMAGING INDUSTRY, BY END USER, 2018–2025
8.2 HOSPITALS & DIAGNOSTIC CENTERS
8.2.1 INCREASING NUMBER OF SURGERIES AND HIGH PURCHASING POWER TO SUPPORT THE GROWTH OF THIS SEGMENT
TABLE 42 GLOBAL MARKET FOR HOSPITALS & DIAGNOSTICS CENTERS, BY REGION, 2018–2025
8.3 AMBULATORY SURGICAL CENTERS & CLINICS
8.3.1 INCREASING NUMBER OF ASCS LIKELY TO DRIVE MARKET GROWTH
TABLE 43 GLOBAL MARKET FOR AMBULATORY SURGICAL CENTERS & CLINICS, BY REGION, 2018–2025
8.4 RESEARCH LABORATORIES & ACADEMIC INSTITUTES
8.4.1 BUDGETARY RESTRICTIONS OF RESEARCHERS ARE LIMITING THE ADOPTION OF HIGH-END INTRAOPERATIVE IMAGING PRODUCTS
TABLE 44 GLOBAL INTRAOPERATIVE IMAGING INDUSTRY FOR RESEARCH LABORATORIES & ACADEMIC INSTITUTES, BY REGION, 2018–2025
9 INTRAOPERATIVE IMAGING MARKET, BY REGION (Page No. - 84)
9.1 INTRODUCTION
TABLE 45 GLOBAL INTRAOPERATIVE IMAGING INDUSTRY, BY REGION, 2018–2025
9.2 NORTH AMERICA
FIGURE 17 NORTH AMERICA: MARKET SNAPSHOT
TABLE 46 NORTH AMERICA: MARKET, BY COUNTRY, 2018–2025
TABLE 47 NORTH AMERICA: MARKET, BY PRODUCT, 2018–2025
TABLE 48 NORTH AMERICA: MARKET, BY APPLICATION, 2018–2025
TABLE 49 NORTH AMERICA: MARKET, BY END USER, 2018–2025
9.2.1 US
9.2.1.1 The US dominates the North American market
TABLE 50 INCREASE IN TARGET POPULATION/DISEASE PREVALENCE IN THE US
TABLE 51 US: INTRAOPERATIVE IMAGING MARKET, BY PRODUCT, 2018–2025
9.2.2 CANADA
9.2.2.1 A dearth of radiologists and long waiting times restrain market growth in Canada
TABLE 52 INCREASE IN TARGET POPULATION/DISEASE PREVALENCE IN CANADA
TABLE 53 CANADA: MARKET, BY PRODUCT, 2018–2025
9.3 EUROPE
TABLE 54 EUROPE: MARKET, BY COUNTRY, 2018–2025
TABLE 55 EUROPE: MARKET, BY PRODUCT, 2018–2025
TABLE 56 EUROPE: MARKET, BY APPLICATION, 2018–2025
TABLE 57 EUROPE: MARKET, BY END USER, 2018–2025
9.3.1 GERMANY
9.3.1.1 Germany holds the largest share of the market in Europe
TABLE 58 INCREASE IN TARGET POPULATION/DISEASE PREVALENCE IN GERMANY
TABLE 59 GERMANY: MARKET, BY PRODUCT, 2018–2025
9.3.2 UK
9.3.2.1 Government initiatives to support market growth in the UK
TABLE 60 UK: MARKET, BY PRODUCT, 2018–2025
9.3.3 FRANCE
9.3.3.1 Availability of funding, strong player presence, and government support are key drivers in France
TABLE 61 FRANCE: INTRAOPERATIVE IMAGING INDUSTRY, BY PRODUCT, 2018–2025
9.3.4 ITALY
9.3.4.1 Favorable regulatory policies likely to support market growth
TABLE 62 ITALY: MARKET, BY PRODUCT, 2018–2025
9.3.5 SPAIN
9.3.5.1 Preference for new equipment likely to increase the market growth
TABLE 63 SPAIN: MARKET, BY PRODUCT, 2018–2025
9.3.6 REST OF EUROPE
TABLE 64 ROE: MARKET, BY PRODUCT, 2018–2025
9.4 ASIA PACIFIC
FIGURE 18 ASIA PACIFIC: INTRAOPERATIVE IMAGING MARKET SNAPSHOT
TABLE 65 APAC: MARKET, BY COUNTRY, 2018–2025
TABLE 66 APAC: MARKET, BY PRODUCT, 2018–2025
TABLE 67 APAC: MARKET, BY APPLICATION, 2018–2025
TABLE 68 APAC: MARKET, BY END USER, 2018–2025
9.4.1 JAPAN
9.4.1.1 Japan dominates the APAC market
TABLE 69 JAPAN: MARKET, BY PRODUCT, 2018–2025
9.4.2 CHINA
9.4.2.1 Government initiatives and investments support the growth of the Chinese market
TABLE 70 CHINA: MARKET, BY PRODUCT, 2018–2025
9.4.3 INDIA
9.4.3.1 Rising disease incidence and growing awareness support market growth; uncertainties in healthcare policies and uneven coverage pose challenges
TABLE 71 INDIA: MARKET, BY PRODUCT, 2018–2025
9.4.4 AUSTRALIA
9.4.4.1 Support for R&D and equipment purchases drives the market growth in Australia
TABLE 72 AUSTRALIA: INTRAOPERATIVE IMAGING INDUSTRY, BY PRODUCT, 2018–2025
9.4.5 SOUTH KOREA
9.4.5.1 Supportive government initiatives expected to impact market growth positively
TABLE 73 SOUTH KOREA: MARKET, BY PRODUCT, 2018–2025
9.4.6 REST OF ASIA PACIFIC
TABLE 74 ROAPAC: MARKET, BY PRODUCT, 2018–2025
9.5 LATIN AMERICA
TABLE 75 LATIN AMERICA: IMAGING MARKET, BY COUNTRY, 2018–2025
TABLE 76 LATAM: MARKET, BY PRODUCT, 2018–2025
TABLE 77 LATAM: MARKET, BY APPLICATION, 2018–2025
TABLE 78 LATAM: INTRAOPERATIVE IMAGING MARKET, BY END USER, 2018–2025
9.5.1 BRAZIL
9.5.1.1 Growing disease burden and rising awareness to support market growth in Brazil
TABLE 79 BRAZIL: MARKET, BY PRODUCT, 2018–2025
9.5.2 MEXICO
9.5.2.1 Favorable investment scenario for medical device manufacturers to drive market growth in Mexico
TABLE 80 MEXICO: MARKET, BY PRODUCT, 2018–2025
9.5.3 REST OF LATIN AMERICA
TABLE 81 ROLATAM: MARKET, BY PRODUCT, 2018–2025
9.6 MIDDLE EAST AND AFRICA
9.6.1 RISING DISPOSABLE INCOME AND INFRASTRUCTURAL DEVELOPMENT TO CONTRIBUTE TO MARKET GROWTH
TABLE 82 MEA: MARKET, BY PRODUCT, 2018–2025
TABLE 83 MEA: MARKET, BY APPLICATION, 2018–2025
TABLE 84 MEA: MARKET, BY END USER, 2018–2025
10 COMPETITIVE LANDSCAPE (Page No. - 117)
10.1 OVERVIEW
FIGURE 19 KEY DEVELOPMENTS IN THE INTRAOPERATIVE IMAGING MARKET (2017–2020)
10.2 GLOBAL INTRAOPERATIVE IMAGING INDUSTRY SHARE ANALYSIS (2019)
FIGURE 20 GE HEALTHCARE HELD THE LEADING POSITION IN THE GLOBAL MARKET IN 2019
10.3 COMPETITIVE SCENARIO (2017–2020)
10.3.1 KEY PRODUCT LAUNCHES (2017–2020)
10.3.2 KEY EXPANSIONS (2017–2020)
10.3.3 KEY ACQUISITIONS (2017–2020)
10.3.4 KEY AGREEMENTS, COLLABORATIONS, AND PARTNERSHIPS (2017–2020)
10.4 COMPETITIVE LEADERSHIP MAPPING
10.5 VENDOR INCLUSION CRITERIA
10.5.1 STARS
10.5.2 EMERGING LEADERS
10.5.3 PERVASIVE PLAYERS
10.5.4 PARTICIPANTS
FIGURE 21 GLOBAL INTRAOPERATIVE IMAGING INDUSTRY - COMPETITIVE LEADERSHIP MAPPING, 2019
10.6 COMPETITIVE LEADERSHIP MAPPING: EMERGING COMPANIES/SMES/START-UPS (2019)
10.6.1 PROGRESSIVE COMPANIES
10.6.2 STARTING BLOCKS
10.6.3 RESPONSIVE COMPANIES
10.6.4 DYNAMIC COMPANIES
FIGURE 22 INTRAOPERATIVE IMAGING MARKET: GLOBAL COMPETITIVE LEADERSHIP MAPPING, 2019 (SME/START-UPS)
11 COMPANY PROFILES (Page No. - 126)
(Business overview, Products offered, Recent developments, MNM view)*
11.1 GENERAL ELECTRIC COMPANY
FIGURE 23 GENERAL ELECTRIC COMPANY: COMPANY SNAPSHOT
11.2 SIEMENS HEALTHINEERS AG
FIGURE 24 SIEMENS HEALTHINEERS AG: COMPANY SNAPSHOT
11.3 CANON MEDICAL SYSTEMS CORPORATION
FIGURE 25 CANON MEDICAL SYSTEMS CORPORATION: COMPANY SNAPSHOT
11.4 MEDTRONIC PLC
FIGURE 26 MEDTRONIC PLC: COMPANY SNAPSHOT (2019)
11.5 KONINKLIJKE PHILIPS N.V.
FIGURE 27 KONINKLIJKE PHILIPS N.V.: COMPANY SNAPSHOT
11.6 CARESTREAM HEALTH
11.7 SHIMADZU CORPORATION
FIGURE 28 SHIMADZU CORPORATION: COMPANY SNAPSHOT
11.8 SHENZHEN ANKE HIGH-TECH CO., LTD.
11.9 BRAINLAB AG
11.10 ZIEHM IMAGING GMBH
11.11 HITACHI, LTD.
FIGURE 29 HITACHI, LTD.: COMPANY SNAPSHOT
11.12 FUJIFILM HOLDINGS CORPORATION
FIGURE 30 FUJIFILM HOLDINGS CORPORATION: COMPANY SNAPSHOT
11.13 IMRIS, DEERFIELD IMAGING, INC.
11.14 STRYKER CORPORATION
FIGURE 31 STRYKER CORPORATION: COMPANY SNAPSHOT (2019)
11.15 NEUROLOGICA CORPORATION
*Business overview, Products offered, Recent developments, MNM view might not be captured in case of unlisted companies.
11.16 OTHER COMPANIES
11.16.1 ESAOTE SPA
11.16.2 ANALOGIC CORPORATION
11.16.3 MINDRAY MEDICAL INTERNATIONAL LIMITED
11.16.4 CARL ZEISS MEDITEC AG
11.16.5 ALLENGERS MEDICAL SYSTEMS LTD.
12 APPENDIX (Page No. - 156)
12.1 DISCUSSION GUIDE
12.2 KNOWLEDGE STORE: MARKETSANDMARKETS’ SUBSCRIPTION PORTAL
12.3 AVAILABLE CUSTOMIZATIONS
12.4 RELATED REPORTS
12.5 AUTHOR DETAILS
The study involved four major activities to estimate the current size of the intraoperative imaging market. Exhaustive secondary research was carried out to collect information on the market and its different subsegments. The next step was to validate these findings, assumptions, and sizing with industry experts across the value chain through primary research. Top-down and bottom-up approaches were employed to estimate the complete market size. Thereafter, market breakdown and data triangulation procedures were used to estimate the size of segments and subsegments.
Secondary Research
In the secondary research process, various secondary sources, such as annual reports, press releases & investor presentations of companies, white papers, certified publications, articles by recognized authors, gold-standard & silver-standard websites, regulatory bodies, and databases (such as D&B Hoovers, Bloomberg Business, and Factiva) were referred to in order to identify and collect information for the orthopedic braces and supports market study.
Primary Research
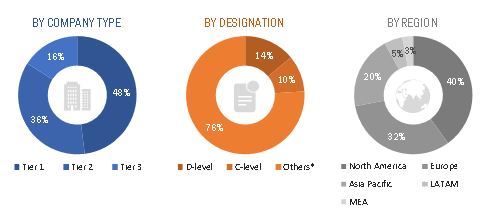
The intraoperative imaging market comprises several stakeholders such as Intraoperative imaging product manufacturing companies , Product distributors and channel partners, Hospitals and surgical centers, Orthopedic clinics, Emergency care units and trauma centers, Ambulatory care centers, physician-operated labs, and skilled nursing facilities, Contract manufacturers and third-party suppliers, Research laboratories and academic institutes, Clinical research organizations (CROs), Government and non-governmental regulatory authorities, Market research and consulting firms. The demand side of this market is characterized by the increasing incidence of transplants and technological advancements, and increased funding and public-private investments. Various primary sources from both the supply and demand sides of the market were interviewed to obtain qualitative and quantitative information. The following is the breakdown of primary respondents:
To know about the assumptions considered for the study, download the pdf brochure
Market Size Estimation
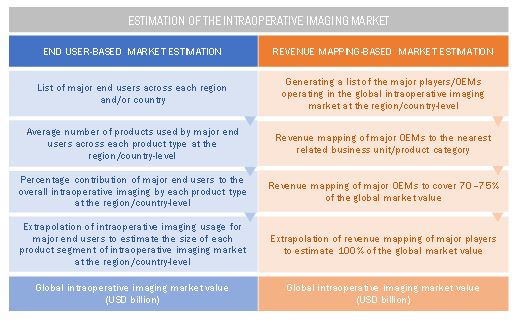
Both top-down and bottom-up approaches were used to estimate and validate the total size of the intraoperative imaging market. These methods were also used extensively to estimate the size of various subsegments in the market. The research methodology used to estimate the market size includes the following:
- The key players in the industry and markets have been identified through extensive secondary research
- The industry’s supply chain and market size, in terms of value, have been determined through primary and secondary research
- All percentage shares, splits, and breakdowns have been determined using secondary sources and verified through primary sources
Data Triangulation
After arriving at the overall market size-using the market size estimation processes as explained above-the intraoperative imaging market was split into several segments and subsegments. In order to complete the overall market engineering process and arrive at the exact statistics of each market segment and subsegment, data triangulation and market breakdown procedures were employed, wherever applicable. The data was triangulated by studying various factors and trends from both the demand and supply sides in the clinical microbiology industry.
Report Objectives
- To define, describe, and forecast the intraoperative imaging market by product, application, end user, and region
- To provide detailed information about the major factors influencing the market growth (such as key drivers, restraints, opportunities, and industry-specific challenges)
- To strategically analyze micromarkets1 with respect to individual growth trends, prospects, and their contributions to the overall intraoperative imaging market
- To analyze market opportunities for stakeholders and provide details of the competitive landscape for key players
- To forecast the revenue of market segments with respect to five major regions, namely, North America, Europe, the Asia Pacific, Latin America, and the Middle East & Africa
- To profile the key players active in the intraoperative imaging market and comprehensively analyze their global revenue shares and core competencies2
- To track and analyze competitive market-specific developments such as product launches, collaborations, agreements, partnerships, expansions, and mergers & acquisitions in the intraoperative imaging market
Available Customizations
With the given market data, MarketsandMarkets offers customizations as per the company’s specific needs. The following customization options are available for the intraoperative imaging market report:
Product Analysis
- Product Matrix, which gives a detailed comparison of the product portfolios of the top five global players
Product Analysis
- Further breakdown of the Rest of European market into Poland, Nederland and other European countries (aggregated)
Company Information
- Detailed analysis and profiling of additional market players (up to 5 OEMs)


 Generating Response ...


Growth opportunities and latent adjacency in Intraoperative Imaging Market
Keen interest in Global scope of Intraoperative Imaging Market
Does this report covers intraoperative 3d imaging system market information ?
the report is very interesting, please share more details on Intraoperative Imaging Market to make decisions about which manufacturers to make alliances with.