Inventory Tags Market by Technology (Barcodes, RFID), Label Type (Plastic, Paper, Metal), Printing technology (Digital Printing, Flexography, Lithography, Screen Printing, Gravure, Others), End-Use (Industrial, Retail, Others) - Global Forecast to 2021


[237 Pages Report] The inventory tags market size is projected to grow from USD 4.08 Billion in 2016, to reach USD 5.07 Billion by 2021, at a CAGR of 4.43%. The segments considered for this report are based on printing technology, label type, technology, end-use sector, and region. The segmentation based on technology consists of barcodes, RFID, and others. Label types include plastic labels, paper labels, metal labels, and others. The end-use sectors include the industrial, retail, and logistics & transportation sectors. On the basis of region, the report is segmented into North America, Europe, Asia-Pacific, and the Rest of the World (RoW). The base year considered for the study is 2015 and the market size is projected from 2016 to 2021. Factors such as increasing protection against theft, loss, and counterfeiting; scope for technology integration; identification of products without human intervention or need of line-of-sight; and adoptions of real time tracking systems have propelled the growth of the global inventory tags market.
The research methodology used to estimate and forecast the inventory tags market begins with capturing data on key vendor revenues through secondary research. The vendor offerings are also taken into consideration to determine the market segmentation. The bottom-up procedure was employed to arrive at the overall size of the global inventory tag market from the revenue of the key players. After arriving at the overall market size, the total market was split into several segments and subsegments, which were then verified through primary research by conducting extensive interviews with key people such as CEOs, VPs, directors, and executives. These data triangulation and market breakdown procedures were employed to complete the overall market engineering process and arrive at the exact statistics for all segments and subsegments. The breakdown of profiles of primary is depicted in the figure below:
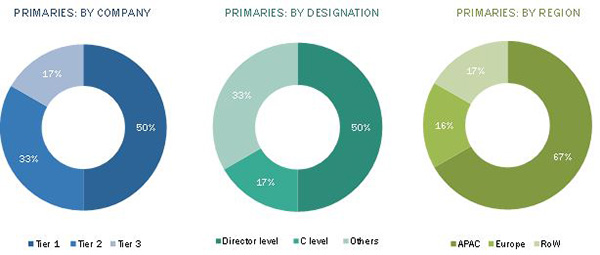
To know about the assumptions considered for the study, download the pdf brochure
The inventory tags ecosystem comprises of inventory tags manufacturers and vendors such Avery Dennison Corporation (U.S.), Tyco International plc (Ireland), 3M Company (U.S.), Brady Corporation (U.S.), and government and national associations such as IMDA, which helps the manufacturers in the development and growth of inventory tags products, technologies, and markets.
Target audience
- Raw material suppliers
- Packaging manufacturers
- Logistics & shipment companies
- Inventory tags manufacturers
- Traders and distributors of inventory tags
- Commercial R&D institutions
- Associations and industry bodies
- End-use sectors such as the industrial, retail, and transport & logistics sectors
Scope of the Report
This research report segments the inventory tags market into following submarkets:
By Printing Technology:
- Digital printing
- Flexography printing
- Gravure printing
- Screen printing
- Lithography printing
- Offset printing
- Letterpress printing
- Others (thermal printing and pad printing)
By Technology:
- Barcodes
- RFID
- Others (QR codes and normal tags)
By Label Type:
- Plastic
- Paper
- Metal
- Others (glass labels, cloth labels, and thermal label type)
By End-Use Sector:
- Industrial
- Retail
- Others (aerospace, marine, and gifts)
By Region:
- North America
- Europe
- Asia-Pacific
- RoW
Available Customizations
With the given market data, MarketsandMarkets offers customizations as per the company�s specific needs. The following customization options are available for the report:
Product Analysis
- Product Matrix, which gives a detailed comparison of market for different product types and forms
Geographic Analysis
- Further analysis of the inventory tags market for additional countries
Company Information
- Detailed analysis and profiling of additional market players (up to five).
MarketsandMarkets projects that the inventory tags market size is expected to grow from USD 4.08 Billion in 2016 to reach USD 5.07 Billion by 2021, at an estimated CAGR of 4.43%. The implementation of inventory tags technologies is an important strategy taken up by many manufacturing companies and regulatory bodies in recent years. Increasing awareness toward protection against theft, loss, and counterfeiting; scope for technology integration; identification of products without human intervention or need of line-of-sight; and adoptions of real time tracking systems are some of the factors that contribute to the growth in the demand for inventory tags in packaging. Additionally, strict laws pertaining to counterfeiting activities, need for efficient use of supply chain, and availability of cost-efficient counterfeiting technologies have propelled packaging companies to opt for inventory tags technologies, which enabled cost savings.
In order to protect the product from counterfeiters, companies accommodate authentication technologies in their product packaging. Authentication technologies such as barcodes, RFIDs, and security inks & dyes are used by companies to protect their brand image. The use of authentication technologies in the industrial sector is projected to grow at the highest CAGR during the forecast period.
The segments considered for this report are based on technology, label type, printing technology, end-use sector, and region. The segmentation based on technology consists of barcodes, RFID, and others (QR codes and normal tags). The RFID technologies segment is a huge market which is projected to grow at a high growth rate from 2016 to 2021. RFID technologies include readers, and software services and are used extensively in the packaging industry. With the help of readers, products can be traced in seconds; this helps to improve and track the supply chain process from production through distribution and retailing. The RFID technology segment is growing tremendously and is opted for by many industries as it reduces manual costs and improves visibility and planning.
Asia-Pacific is projected to be the fastest-growing region in the inventory tags market during the forecast period; the rising population of the region, along with high disposable income and the demand for packaged food products are factors driving the growth of the inventory tags market. China is projected to be the fastest-growing country in the inventory tag market from 2016 to 2021. The major drivers for the growth of the inventory tags markets in the this country include strong government support, efforts towards standardization, expanding application segments, convergence of technologies, and rising awareness of using inventory tracking technologies.
Zebra Technologies Corporation (U.S.) has maintained its leadership position through its strong distribution network across Asia Pacific, Europe, and the Americas. Zebra Technologies Corporation has strengthened its position as a leading provider of visibility solutions across the world. The company has adopted mergers and acquisitions as its key strategies to capture the market. In October 2014, Zebra Technologies Corporation acquired the enterprise business of Motorola Solutions, Inc. (U.S.) which strengthened Zebra�s product portfolio, geographic reach, go-to-market channels, and industries served. The company plans to enter into new and emerging markets given its stable financial position and a strong customer base.
To speak to our analyst for a discussion on the above findings, click Speak to Analyst
 Exclusive indicates content/data unique to MarketsandMarkets and not available with any competitors.
Table of Contents
1 Introduction (Page No. - 25)
1.1 Objectives of the Study
1.2 Market Definition
1.3 Study Scope
1.3.1 Geographic Scope
1.3.2 Periodization Considered for the Study
1.4 Currency Considered for the Study
1.5 Stakeholders
1.6 Limitations
2 Research Methodology (Page No. - 29)
2.1 Research Data
2.1.1 Secondary Data
2.1.1.1 Key Data From Secondary Sources
2.1.2 Primary Data
2.1.2.1 Key Data From Primary Sources
2.1.2.2 Key Industry Insights
2.2 Market Size Estimation
2.3 Market Breakdown & Data Triangulation
2.4 Research Assumptions & Limitations
2.4.1 Assumptions
2.4.2 Limitations of the Research Study
3 Executive Summary (Page No. - 38)
3.1 Overview
3.2 Evolution
3.3 Inventory Tags Market
3.4 Market Size, By Label Type, 2016 vs 2021 (USD Million)
3.5 China to Register the Highest CAGR in the Market for Inventory Tags From 2016 to 2021
4 Premium Insights (Page No. - 43)
4.1 Attractive Opportunities in the Inventory Tags Market
4.2 Plastic Segment is Expected to Dominate the Market of Inventory Tags During the Forecast Period
4.3 Digital Printing Technology is Projected to Dominate the Inventory Tags Market
4.4 Industrial Sector Captures the Largest Share in Asia-Pacific in 2015
4.5 Europe Dominated the Overall Inventory Tags Market in 2015
4.6 Inventory Tags Market Life Cycle Analysis, By Region
5 Market Overview (Page No. - 49)
5.1 Introduction
5.2 Evolution
5.3 Market Segmentation
5.4 Market Dynamics
5.4.1 Drivers
5.4.1.1 Protection Against Theft, Loss, and Counterfeiting
5.4.1.2 Identification Without Human Intervention Or Need of Line-Of-Sight
5.4.1.3 Integration of Technologies is Possible
5.4.1.4 Reliable and Easy Real-Time Tracking
5.4.2 Restraints
5.4.2.1 Mechanical Vulnerability
5.4.2.2 High Cost of Software and Equipment Integration
5.4.3 Opportunities
5.4.3.1 Growing Demand From Various End-Use Sectors
5.4.3.2 Remote Identification of Products
5.4.3.3 Increasing Demand for Efficient Supply Chain Management
5.4.3.4 Positive Outlook Towards Iot Sector
5.4.4 Challenges
5.4.4.1 Reflection and Absorption of Rf Signals By Metallic and Liquid Objects
5.4.4.2 Live Tags Even After Deactivation
6 Inventory Tags Market, By Technology (Page No. - 58)
6.1 Introduction
6.1.1 Inventory Tags Market, By Technology
6.1.1.1 Barcodes Segment Dominated the Inventory Tags Market in 2015
6.2 Barcodes
6.3 RFID
6.3.1 Low Frequency RFID
6.3.2 High Frequency RFID
6.3.3 Ultra High Frequency RFID
6.4 Other Technologies
7 Inventory Tags Market, By Label Type (Page No. - 66)
7.1 Introduction
7.1.1 Inventory Tags Market, By Label Type
7.1.1.1 Plastic Segment is Projected to Grow at the Highest CAGR From 2016 to 2021
7.2 Plastic
7.3 Paper
7.4 Metal
7.5 Others
8 Inventory Tags Market, By Printing Technology (Page No. - 73)
8.1 Introduction
8.1.1 Inventory Tags Market, By Printing Technology
8.1.1.1 Digital Printing Method Dominated the Inventory Tags Market in 2015
8.2 Digital Printing
8.3 Flexography Printing
8.4 Lithography Printing
8.5 Screen Printing
8.6 Gravure Printing
8.7 Letterpress Printing
8.8 Offset Printing
8.9 Others
9 Inventory Tags Market, By End Use (Page No. - 85)
9.1 Introduction
9.1.1 Inventory Tags Market, By End Use
9.1.1.1 Industrial Segment Dominated the Inventory Tags Market in 2015
9.2 Industrial
9.3 Retail
9.4 Transportation & Logistics
9.5 Others
10 Inventory Tags Market, By Region (Page No. - 92)
10.1 Introduction
10.2 North America
10.2.1 By Country
10.2.1.1 The U.S. Accounted for the Largest Market Share in North America
10.2.2 By Printing Technology
10.2.2.1 The Digital Printing Segment Dominated the North American Inventory Tags Market in 2015
10.2.3 By Technology
10.2.3.1 Barcode Segment is Projected to Dominate the Market During the Forecast Period
10.2.4 By Label Type
10.2.4.1 The Plastic Segment is Projected to Grow at the Highest CAGR From 2016 to 2021
10.2.5 By End-Use Sector
10.2.5.1 Industrial Sector is Projected to Dominate the Market During the Forecast Period
10.2.6 Key Country-Wise Insights
10.2.6.1 U.S.
10.2.7 Printing Technology
10.2.7.1 Digital Printing Segment Dominated the U.S. Inventory Tags Market in 2015
10.2.8 Technology
10.2.8.1 Barcodes Segment is Projected to Dominate the Market During the Forecast Period
10.2.9 Label Type
10.2.9.1 The Plastic Segment is Projected to Grow at the Highest CAGR During the Forecast Period
10.2.10 End-Use Sector
10.2.10.1 Industrial Sector Dominated the U.S. Inventory Tags Market in 2015
10.2.10.2 Canada
10.2.11 Printing Technology
10.2.11.1 The Digital Printing Segment Dominated the Canadian Inventory Tags Market in 2015
10.2.12 Technology
10.2.12.1 RFID Segment is Projected to Grow at the Highest CAGR From 2016 to 2021
10.2.13 Label Type
10.2.13.1 The Plastic Segment Held the Largest Share in 2015
10.2.14 End-Use Sector
10.2.14.1 Industrial Sector Dominated the Inventory Tags Market in Canada
10.2.14.2 Mexico
10.2.15 Printing Technology
10.2.15.1 The Digital Printing Segment Dominated the Mexican Inventory Tags Market in 2015
10.2.16 Technology
10.2.16.1 Barcodes Segment is Projected to Dominate the Market During the Forecast Period
10.2.17 Label Type
10.2.17.1 The Plastic Segment is Projected to Grow at the Highest CAGR During the Forecast Period
10.2.18 End-Use Sector
10.2.18.1 Industrial Sector Dominated the Mexican Inventory Tags Market in 2015
10.3 Europe
10.3.1 By Country
10.3.1.1 Germany Accounted for the Largest Market Share in Europe, in 2015
10.3.2 By Printing Technology
10.3.2.1 The Digital Printing Segment Dominated the Europe Inventory Tags Market in 2015
10.3.3 By Technology
10.3.3.1 Barcode Segment Projected to Dominate the Market During the Forecast Period.
10.3.4 By Label Type
10.3.4.1 The Plastic Segment is Projected to Grow at the Highest CAGR During the Forecast Period, 2016-2021
10.3.5 By End-Use Sector
10.3.5.1 Industrial Sector Projected to Dominate the Market During the Forecast Period, 2016-2021
10.3.6 Key Country-Wise Insights
10.3.6.1 Germany
10.3.7 By Printing Technology
10.3.7.1 The Digital Printing Segment Dominated Germany�s Inventory Tags Market, in 2015
10.3.8 By Technology
10.3.8.1 RFID Segment is Projected to Grow at the Highest CAGR From 2016 to 2021
10.3.9 By Label Type
10.3.9.1 The Plastic Labels Segment is Projected to Grow at the Highest CAGR During the Forecast Period
10.3.10 By End-Use Sector
10.3.10.1 Industrial Sector in Germany is Projected to Dominate the Market During the Forecast Period
10.3.10.2 U.K.
10.3.11 Printing Technology
10.3.11.1 Digital Printing Segment Dominated the U.K. Inventory Tags Market, in 2015
10.3.12 By Technology
10.3.12.1 Barcodes Segment is Projected to Dominate the U.K. Market During the Forecast Period
10.3.13 By Label Type
10.3.13.1 The Plastic Labels Segment is Projected to Grow at the Highest CAGR During the Forecast Period
10.3.14 By End-Use Sector
10.3.14.1 Industrial Segment Dominated the U.K. Inventory Tags Market in 2015
10.3.14.2 Russia
10.3.15 Printing Technology
10.3.15.1 The Digital Printing Segment Dominated Russia�s Inventory Tags Market
10.3.16 By Technology
10.3.16.1 RFID Segment is Projected to Grow at the Highest CAGR From 2016 to 2021
10.3.17 By Label Type
10.3.17.1 Plastic Labels Was the Largest Segment in 2015
10.3.18 By End-Use Sector
10.3.18.1 Industrial Sector Dominated the Inventory Tags Market in Russia
10.3.18.2 France
10.3.19 Printing Technology
10.3.19.1 The Digital Printing Segment Dominated the France Inventory Tags Market in 2015
10.3.20 By Technology
10.3.20.1 RFID Segment is Projected to Grow at the Highest CAGR From 2016-2021
10.3.21 By Label Type
10.3.21.1 Plastic Labels Was the Largest Segment in France, in 2015
10.3.22 By End-Use Sector
10.3.22.1 Industrial Sector Dominated the Inventory Tags Market in France
10.3.22.2 Rest of Europe
10.3.23 Printing Technology
10.3.23.1 The Digital Printing Segment Dominated the Rest of Europe Inventory Tags Market in 2015
10.3.24 By Technology
10.3.24.1 Barcodes Segment is Projected to Dominate the Rest of Europe Market During the Forecast Period
10.3.25 By Label Type
10.3.25.1 The Plastic Labels Segment is Projected to Grow at the Highest CAGR During the Forecast Period
10.3.26 By End-Use Sector
10.3.26.1 Industrial Segment Dominated the Rest of Europe Inventory Tags Market in 2015
10.4 Asia-Pacific
10.4.1 By Country
10.4.1.1 China to Account for the Largest Market Share in Asia-Pacific, 2016-2021
10.4.2 By Printing Technology
10.4.2.1 The Digital Printing Segment Dominated the Asia-Pacific Inventory Tags Market in 2015
10.4.3 By Technology
10.4.3.1 Barcode Segment Projected to Dominate the Market During the Forecast Period.
10.4.4 By Label Type
10.4.4.1 The Plastic Segment is Projected to Grow at the Highest CAGR During the Forecast Period, 2016-2021
10.4.5 By End-Use Sector
10.4.5.1 Industrial Segment is Projected to Dominate the Market During the Forecast Period, 2016-2021
10.4.6 Key Country-Wise Insights
10.4.6.1 China
10.4.7 By Printing Technology
10.4.7.1 The Digital Printing Segment Dominated China�s Inventory Tags Market in 2015
10.4.8 By Technology
10.4.8.1 RFID Segment is Projected to Grow at the Highest CAGR From 2016 to 2021
10.4.9 By Label Type
10.4.9.1 The Plastic Labels Segment is Projected to Grow at the Highest CAGR During the Forecast Period.
10.4.10 By End-Use Sector
10.4.10.1 Industrial Sector is Projected to Dominate the Market During the Forecast Period
10.4.10.2 Japan
10.4.11 Printing Technology
10.4.11.1 Digital Printing Segment Dominated Japan�s Inventory Tags Market in 2015
10.4.12 By Technology
10.4.12.1 Barcodes Segment Projected to Dominate the Market During the Forecast Period
10.4.13 By Label Type
10.4.13.1 The Plastic Labels Segment is Projected to Grow at the Highest CAGR During the Forecast Period
10.4.14 By End-Use Sector
10.4.14.1 Industrial Dominated the Japan Inventory Tags Market in 2015
10.4.14.2 India
10.4.15 Printing Technology
10.4.15.1 The Digital Printing Segment Dominated the Indian Inventory Tags Market, in 2015
10.4.16 By Technology
10.4.16.1 RFID Segment is Projected to Grow at the Highest CAGR From 2016-2021
10.4.17 By Label Type
10.4.17.1 The Plastic Labels is the Largest Market in 2015
10.4.18 By End-Use Sector
10.4.18.1 Industrial Sector Dominated the Inventory Tags Market in India
10.4.18.2 Australia
10.4.19 Printing Technology
10.4.19.1 The Digital Printing Segment Dominated the Australian Inventory Tags Market in 2015
10.4.20 By Technology
10.4.20.1 RFID Segment in Australia is Projected to Grow at the Highest CAGR From 2016 to 2021
10.4.21 By Label Type
10.4.21.1 Plastic Labels Was the Largest Segment in 2015
10.4.22 By End-Use Sector
10.4.22.1 Industrial Sector Dominated the Inventory Tags Market in Australia
10.4.22.2 Rest of Asia-Pacific
10.4.23 Printing Technology
10.4.23.1 The Digital Printing Segment Dominated the Rest of Asia-Pacific Inventory Tags Market in 2015
10.4.24 By Technology
10.4.24.1 Barcodes Segment Projected to Dominate the Market During the Forecast Period
10.4.25 By Label Type
10.4.25.1 The Plastic Labels Segment is Projected to Grow at the Highest CAGR During the Forecast Period
10.4.26 By End-Use Sector
10.4.26.1 Industrial Segment Dominated the Rest of Asia-Pacific Inventory Tags Market in 2015
10.5 Rest of the World (RoW)
10.5.1 Country
10.5.1.1 Brazil Accounted for the Largest Market Share in the RoW Region
10.5.2 By Printing Technology
10.5.2.1 The Digital Printing Segment Dominated the RoW Inventory Tags Market in 2015
10.5.3 By Technology
10.5.3.1 RFID Segment is Projected to Grow at the Highest CAGR From 2016 to 2021
10.5.4 By Label Type
10.5.4.1 The Plastic Segment is Projected to Grow at the Highest CAGR During the Forecast Period
10.5.5 By End-Use Sector
10.5.5.1 Industrial Sector is Projected to Dominate the Market During the Forecast Period
10.5.6 Key Country-Wise Insights
10.5.6.1 Brazil
10.5.7 By Printing Technology
10.5.7.1 The Digital Printing Segment Dominated the Brazilian Inventory Tags Market in 2015
10.5.8 By Technology
10.5.8.1 Barcodes Segment is Projected to Dominate the Market During the Forecast Period
10.5.9 By Label Type
10.5.9.1 The Plastic Labels Segment is Projected to Grow at the Highest CAGR During the Forecast Period
10.5.10 By End-Use Sector
10.5.10.1 Industrial Sector is Projected to Dominate the Market During the Forecast Period
10.5.10.2 Argentina
10.5.11 By Printing Technology
10.5.11.1 The Digital Printing Segment Dominated the Argentina Inventory Tags Market in 2015
10.5.12 By Technology
10.5.12.1 RFID Segment is Projected to Grow at the Highest CAGR From 2016 to 2021
10.5.13 By Label Type
10.5.13.1 The Plastic Segment is Projected to Grow at the Highest CAGR During the Forecast Period
10.5.14 By End-Use Sector
10.5.14.1 Industrial Sector is Projected to Dominate the Market During the Forecast Period
10.5.14.2 South Africa
10.5.15 By Printing Technology
10.5.15.1 The Digital Printing Segment Dominated the South African Inventory Tags Market in 2015
10.5.16 By Technology
10.5.16.1 Barcodes Segment is Projected to Dominate the Market During the Forecast Period
10.5.17 By Label Type
10.5.17.1 The Plastic Segment is Projected to Grow at the Highest CAGR During the Forecast Period
10.5.18 By End-Use Sector
10.5.18.1 Industrial Sector is Projected to Dominate the Market During the Forecast Period
10.5.18.2 Others in RoW
10.5.19 By Printing Technology
10.5.19.1 The Digital Printing Segment Dominated the Others in RoW Inventory Tags Market in 2015
10.5.20 By Technology
10.5.20.1 RFID Segment is Projected to Grow at the Highest CAGR From 2016 to 2021
10.5.21 By Label Type
10.5.21.1 The Plastic Segment is Projected to Grow at the Highest CAGR During the Forecast Period
10.5.22 By End-Use Sector
10.5.22.1 Industrial Sector is Projected to Dominate the Market During the Forecast Period
11 Competitive Landscape (Page No. - 196)
11.1 Introduction
11.2 Competitive Situations and Trends
11.3 Key Growth Strategies, 2010�2016
11.3.1 Agreements, Contracts, Collaborations, Joint Ventures, and Partnerships
11.3.2 Acquisitions
11.3.3 Technological Advancements & New Product Developments
11.3.4 Expansions & Divestiture
12 Company Profiles (Page No. - 203)
(Company at A Glance, Recent Financials, Products & Services, Strategies & Insights, & Recent Developments)*
12.1 Introduction
12.2 Avery Dennison Corporation
12.3 3M Company
12.4 Zebra Technologies Corporation
12.5 Brady Corporation
12.6 Tyco International PLC
12.7 Checkpoint Systems, Inc.
12.8 Smartrac N.V.
12.9 Hewlett-Packard Company
12.10 Cenveo Inc.
12.11 Alien Technology, Inc.
*Details on Company at A Glance, Recent Financials, Products & Services, Strategies & Insights, & Recent Developments Might Not Be Captured in Case of Unlisted Companies.
13 Appendix (Page No. - 229)
13.1 Insights of Industry Experts
13.2 Discussion Guide
13.3 Knowledge Store: Marketsandmarkets� Subscription Portal
13.4 Other Developments
13.5 Introducing RT: Real Time Market Intelligence
13.6 Available Customizations
13.7 Related Reports
List of Tables (236 Tables)
Table 1 Impact of Key Drivers on the Inventory Tags Market
Table 2 Wear & Tear of Tags and High Cost of Integration Can Restrain the Market From Growth
Table 3 Emerging Industrial Segments & Increasing Demand for Tags in the Supply Chain are Key Opportunities for the Inventory Tags Market
Table 4 List of Various Materials and Their Effect on Rf Signals
Table 5 Impact of Key Challenge for the Inventory Tags Market
Table 6 Inventory Tags Market Size, By Technology, 2014�2021 (USD Million)
Table 7 Market Size, By Technology, 2014�2021 (Million Units)
Table 8 Barcodes Market Size, By Region, 2014�2021 (USD Million)
Table 9 Barcodes Market Size, By Region, 2014�2021 (Million Units)
Table 10 RFID Market Size, By Region, 2014�2021 (USD Million)
Table 11 RFID Market Size, By Region, 2014�2021 (Million Units)
Table 12 RFID Market Size, By Type, 2014�2021 (USD Million)
Table 13 RFID Market Size, By Type, 2014�2021 (Million Units)
Table 14 Other Technologies Market Size, By Region, 2014�2021 (USD Million)
Table 15 Other Technologies Market Size, By Region, 2014�2021 (Million Units)
Table 16 Inventory Tags Market Size, By Label Type, 2014-2021 (USD Million)
Table 17 Market Size, By Label Type, 2014-2021 (Million Units)
Table 18 Plastic Labels Market Size, By Region, 2014-2021 (USD Million)
Table 19 Plastic Labels Market Size, By Region, 2014-2021 (Million Units)
Table 20 Paper Labels Market Size, By Region, 2014-2021 (USD Million)
Table 21 Paper Labels Market Size, By Region, 2014-2021 (Million Units)
Table 22 Metal Labels Market Size, By Region, 2014-2021 (USD Million)
Table 23 Metal Labels Market Size, By Region, 2014-2021 (Million Units)
Table 24 Others Market Size, By Region, 2014-2021 (USD Million)
Table 25 Others Market Size, By Region, 2014-2021 (Million Units)
Table 26 Inventory Tags Market Size, By Printing Technology, 2014-2021 (USD Million)
Table 27 Market Size, By Printing Technology, 2014-2021 (Million Units)
Table 28 Digital Printing Market Size, By Region, 2014-2021 (USD Million)
Table 29 Digital Printing Market Size, By Region, 2014-2021 (Million Units)
Table 30 Flexography Printing Market Size, By Region, 2014-2021 (USD Million)
Table 31 Flexography Printing Market Size, By Region, 2014-2021 (Million Units)
Table 32 Lithography Printing Market Size, By Region, 2014-2021 (USD Million)
Table 33 Lithography Printing Market Size, By Region, 2014-2021 (Million Units)
Table 34 Screen Printing Market Size, By Region, 2014-2021 (USD Million)
Table 35 Screen Printing Market Size, By Region, 2014-2021 (Million Units)
Table 36 Gravure Printing Market Size, By Region, 2014-2021 (USD Million)
Table 37 Gravure Printing Market Size, By Region, 2014-2021 (Million Units)
Table 38 Letterpress Printing Market Size, By Region, 2014-2021 (USD Million)
Table 39 Letterpress Printing Market Size, By Region, 2014-2021 (Million Units)
Table 40 Offset Printing Market Size, By Region, 2014-2021 (USD Million)
Table 41 Offset Printing Market Size, By Region, 2014-2021 (Million Units)
Table 42 Others Market Size, By Region, 2014-2021 (USD Million)
Table 43 Others Market Size, By Region, 2014-2021 (Million Units)
Table 44 Market Size, By End Use, 2014-2021 (USD Million)
Table 45 Market Size, By End Use, 2014-2021 (Million Units)
Table 46 Industrial Market Size, By Region, 2014�2021 (USD Million)
Table 47 Industrial Market Size, By Region, 2014�2021 (Million Units)
Table 48 Retail Market Size, By Region, 2014�2021 (USD Million)
Table 49 Retail Market Size, By Region, 2014�2021 (Million Units)
Table 50 Transportation & Logistics Market Size, By Region, 2014�2021 (USD Million)
Table 51 Transportation & Logistics Market Size, By Region, 2014�2021 (Million Units)
Table 52 Others Market Size, By Region, 2014�2021 (USD Million)
Table 53 Others Market Size, By Region, 2014�2021 (Million Units)
Table 54 North America: Inventory Tags Market Size, By Country, 2014�2021 (USD Million)
Table 55 North America: Market Size, By Country, 2014�2021 (Million Units)
Table 56 North America: Market Size, By Printing Technology, 2014-2021 (USD Million)
Table 57 North America: Market Size, By Printing Technology, 2014�2021 (Million Units)
Table 58 North America: Market Size, By Technology, 2014�2021 (USD Million)
Table 59 North America: Market Size, By Technology, 2014�2021 (Million Units)
Table 60 North America: Market Size, By Label Type, 2014�2021 (USD Million)
Table 61 North America: Market Size, By Label Type, 2014�2021 (Million Units)
Table 62 North America: Market Size, By End-Use Sector, 2014�2021 (USD Million)
Table 63 North America: Market Size, By End-Use Sector, 2014�2021 (Million Units)
Table 64 U.S.: Inventory Tags Market Size, By Printing Technology, 2014-2021 (USD Million)
Table 65 U.S.: Market Size, By Printing Technology, 2014�2021 (Million Units)
Table 66 U.S.: Market Size, By Technology, 2014�2021 (USD Million)
Table 67 U.S.: Market Size, By Technology, 2014�2021 (Million Units)
Table 68 U.S.: Market Size, By Label Type, 2014�2021 (USD Million)
Table 69 U.S.: Market Size, By Label Type, 2014�2021 (Million Units)
Table 70 U.S.: Market Size, By End-Use Sector, 2014�2021 (USD Million)
Table 71 U.S.: Market Size, By End-Use Sector, 2014�2021 (Million Units)
Table 72 Canada: Inventory Tags Market Size, By Printing Technology, 2014-2021 (USD Million)
Table 73 Canada: Market Size, By Printing Technology, 2014�2021 (Million Units)
Table 74 Canada: Market Size, By Technology, 2014�2021 (USD Million)
Table 75 Canada: Market Size, By Technology, 2014�2021 (Million Units)
Table 76 Canada: Market Size, By Label Type, 2014�2021 (USD Million)
Table 77 Canada: Market Size, By Label Type, 2014�2021 (Million Units)
Table 78 Canada: Market Size, By End-Use Sector, 2014�2021 (USD Million)
Table 79 Canada: Market Size, By End-Use Sector, 2014�2021 (Million Units)
Table 80 Mexico: Inventory Tags Market Size, By Printing Technology, 2014-2021 (USD Million)
Table 81 Mexico: Market Size, By Printing Technology, 2014�2021 (Million Units)
Table 82 Mexico: Market Size, By Technology, 2014�2021 (USD Million)
Table 83 Mexico: Market Size, By Technology, 2014�2021 (Million Units)
Table 84 Mexico: Market Size, By Label Type, 2014�2021 (USD Million)
Table 85 Mexico: Market Size, By Label Type, 2014�2021 (Million Units)
Table 86 Mexico: Market Size, By End-Use Sector, 2014�2021 (USD Million)
Table 87 Mexico: Market Size, By End-Use Sector, 2014�2021 (Million Units)
Table 88 Europe: Inventory Tags Market Size, By Country, 2014�2021 (USD Million)
Table 89 Europe: Market Size, By Country, 2014�2021 (Million Units)
Table 90 Europe: Market Size, By Printing Technology, 2014-2021 (USD Million)
Table 91 Europe: Market Size, By Printing Technology, 2014�2021 (Million Units)
Table 92 Europe: Market Size, By Technology, 2014�2021 (USD Million)
Table 93 Europe: Market Size, By Technology, 2014�2021 (Million Units)
Table 94 Europe: Market Size, By Label Type, 2014�2021 (USD Million)
Table 95 Europe: Market Size, By Label Type, 2014�2021 (Million Units)
Table 96 Europe: Market Size, By End-Use Sector, 2014�2021 (USD Million)
Table 97 Europe: Market Size, By End-Use Sector, 2014�2021 (Million Units)
Table 98 Germany: Inventory Tags Market Size, By Printing Technology, 2014-2021 (USD Million)
Table 99 Germany: Market Size, By Printing Technology, 2014�2021 (Million Units)
Table 100 Germany: Market Size, By Technology, 2014�2021 (USD Million)
Table 101 Germany: Market Size, By Technology, 2014�2021 (Million Units)
Table 102 Germany: Market Size, By Label Type, 2014�2021 (USD Million)
Table 103 Germany: Market Size, By Label Type, 2014�2021 (Million Units)
Table 104 Germany: Market Size, By End-Use Sector, 2014�2021 (USD Million)
Table 105 Germany: Market Size, By End-Use Sector, 2014�2021 (Million Units)
Table 106 U.K.: Inventory Tags Market Size, By Printing Technology, 2014-2021 (USD Million)
Table 107 U.K.: Market Size, By Printing Technology, 2014�2021 (Million Units)
Table 108 U.K.: Market Size, By Technology, 2014�2021 (USD Million)
Table 109 U.K.: Market Size, By Technology, 2014�2021 (Million Units)
Table 110 U.K.: Market Size, By Label Type, 2014�2021 (USD Million)
Table 111 U.K.: Market Size, By Label Type, 2014�2021 (Million Units)
Table 112 U.K.: Market Size, By End-Use Sector, 2014�2021 (USD Million)
Table 113 U.K.: Market Size, By End-Use Sector, 2014�2021 (Million Units)
Table 114 Russia: Inventory Tags Market Size, By Printing Technology, 2014-2021 (USD Million)
Table 115 Russia: Market Size, By Printing Technology, 2014�2021 (Million Units)
Table 116 Russia: Market Size, By Technology, 2014�2021 (USD Million)
Table 117 Russia: Market Size, By Technology, 2014�2021 (Million Units)
Table 118 Russia: Market Size, By Label Type, 2014�2021 (USD Million)
Table 119 Russia: Market Size, By Label Type, 2014�2021 (Million Units)
Table 120 Russia: Market Size, By End-Use Sector, 2014�2021 (USD Million)
Table 121 Russia: Market Size, By End-Use Sector, 2014�2021 (Million Units)
Table 122 France: Inventory Tags Market Size, By Printing Technology, 2014-2021 (USD Million)
Table 123 France: Market Size, By Printing Technology, 2014�2021 (Million Units)
Table 124 France: Market Size, By Technology, 2014�2021 (USD Million)
Table 125 France: Market Size, By Technology, 2014�2021 (Million Units)
Table 126 France: Market Size, By Label Type, 2014�2021 (USD Million)
Table 127 France: Market Size, By Label Type, 2014�2021 (Million Units)
Table 128 France: Market Size, By End-Use Sector, 2014�2021 (USD Million)
Table 129 France: Market Size, By End-Use Sector, 2014�2021 (Million Units)
Table 130 Rest of Europe: Inventory Tags Market Size, By Printing Technology, 2014-2021 (USD Million)
Table 131 Rest of Europe: Market Size, By Printing Technology, 2014�2021 (Million Units)
Table 132 Rest of Europe: Market Size, By Technology, 2014�2021 (USD Million)
Table 133 Rest of Europe: Market Size, By Technology, 2014�2021 (Million Units)
Table 134 Rest of Europe: Market Size, By Label Type, 2014�2021 (USD Million)
Table 135 Rest of Europe: Market Size, By Label Type, 2014�2021 (Million Units)
Table 136 Rest of Europe: Market Size, By End-Use Sector, 2014�2021 (USD Million)
Table 137 Rest of Europe: Market Size, By End-Use Sector, 2014�2021 (Million Units)
Table 138 Asia-Pacific: Inventory Tags Market Size, By Country, 2014�2021 (USD Million)
Table 139 Asia-Pacific: Market Size, By Country, 2014�2021 (Million Units)
Table 140 Asia-Pacific: Market Size, By Printing Technology, 2014-2021 (USD Million)
Table 141 Asia-Pacific: Market Size, By Printing Technology, 2014�2021 (Million Units)
Table 142 Asia-Pacific: Market Size, By Technology, 2014�2021 (USD Million)
Table 143 Asia-Pacific: Market Size, By Technology, 2014�2021 (Million Units)
Table 144 Asia-Pacific: Market Size, By Label Type, 2014�2021 (USD Million)
Table 145 Asia-Pacific: Market Size, By Label Type, 2014�2021 (Million Units)
Table 146 Asia-Pacific: Market Size, By End-Use Sector, 2014�2021 (USD Million)
Table 147 Asia-Pacific: Market Size, By End-Use Sector, 2014�2021 (Million Units)
Table 148 China: Inventory Tags Market Size, By Printing Technology, 2014-2021 (USD Million)
Table 149 China: Market Size, By Printing Technology, 2014�2021 (Million Units)
Table 150 China: Market Size, By Technology, 2014�2021 (USD Million)
Table 151 China: Market Size, By Technology, 2014�2021 (Million Units)
Table 152 China: Market Size, By Label Type, 2014�2021 (USD Million)
Table 153 China: Market Size, By Label Type, 2014�2021 (Million Units)
Table 154 China: Market Size, By End-Use Sector, 2014�2021 (USD Million)
Table 155 China: Market Size, By End-Use Sector, 2014�2021 (Million Units)
Table 156 Japan: Inventory Tags Market Size, By Printing Technology, 2014-2021 (USD Million)
Table 157 Japan: Market Size, By Printing Technology, 2014�2021 (Million Units)
Table 158 Japan: Market Size, By Technology, 2014�2021 (USD Million)
Table 159 Japan: Market Size, By Technology, 2014�2021 (Million Units)
Table 160 Japan: Market Size, By Label Type, 2014�2021 (USD Million)
Table 161 Japan: Market Size, By Label Type, 2014�2021 (Million Units)
Table 162 Japan: Market Size, By End-Use Sector, 2014�2021 (USD Million)
Table 163 Japan: Market Size, By End-Use Sector, 2014�2021 (Million Units)
Table 164 India: Inventory Tags Market Size, By Printing Technology, 2014-2021 (USD Million)
Table 165 India: Market Size, By Printing Technology, 2014�2021 (Million Units)
Table 166 India: Market Size, By Technology, 2014�2021 (USD Million)
Table 167 India: Market Size, By Technology, 2014�2021 (Million Units)
Table 168 India: Market Size, By Label Type, 2014�2021 (USD Million)
Table 169 India: Market Size, By Label Type, 2014�2021 (Million Units)
Table 170 India: Market Size, By End-Use Sector, 2014�2021 (USD Million)
Table 171 India: Market Size, By End-Use Sector, 2014�2021 (Million Units)
Table 172 Australia: Inventory Tags Market Size, By Printing Technology, 2014-2021 (USD Million)
Table 173 Australia: Market Size, By Printing Technology, 2014�2021 (Million Units)
Table 174 Australia: Market Size, By Technology, 2014�2021 (USD Million)
Table 175 Australia: Market Size, By Technology, 2014�2021 (Million Units)
Table 176 Australia: Market Size, By Label Type, 2014�2021 (USD Million)
Table 177 Australia: Market Size, By Label Type, 2014�2021 (Million Units)
Table 178 Australia: Market Size, By End-Use Sector, 2014�2021 (USD Million)
Table 179 Australia: Market Size, By End-Use Sector, 2014�2021 (Million Units)
Table 180 Rest of Asia-Pacific: Inventory Tags Market Size, By Printing Technology, 2014-2021 (USD Million)
Table 181 Rest of Asia-Pacific: Market Size, By Printing Technology, 2014�2021 (Million Units)
Table 182 Rest of Asia-Pacific: Market Size, By Technology, 2014�2021 (USD Million)
Table 183 Rest of Asia-Pacific: Market Size, By Technology, 2014�2021 (Million Units)
Table 184 Rest of Asia-Pacific: Market Size, By Label Type, 2014�2021 (USD Million)
Table 185 Rest of Asia-Pacific: Market Size, By Label Type, 2014�2021 (Million Units)
Table 186 Rest of Asia-Pacific: Market Size, By End-Use Sector, 2014�2021 (USD Million)
Table 187 Rest of Asia-Pacific: Market Size, By End-Use Sector, 2014�2021 (Million Units)
Table 188 RoW: Inventory Tags Market Size, By Country, 2014�2021 (USD Million)
Table 189 RoW: Market Size, By Country, 2014�2021 (Million Units)
Table 190 RoW: Market Size, By Printing Technology, 2014-2021 (USD Million)
Table 191 RoW: Market Size, By Printing Technology, 2014�2021 (Million Units)
Table 192 RoW: Market Size, By Technology, 2014�2021 (USD Million)
Table 193 RoW: Market Size, By Technology, 2014�2021 (Million Units)
Table 194 RoW: Market Size, By Label Type, 2014�2021 (USD Million)
Table 195 RoW: Market Size, By Label Type, 2014�2021 (Million Units)
Table 196 RoW: Market Size, By End-Use Sector, 2014�2021 (USD Million)
Table 197 RoW: Market Size, By End-Use Sector, 2014�2021 (Million Units)
Table 198 Brazil: Inventory Tags Market Size, By Printing Technology, 2014-2021 (USD Million)
Table 199 Brazil: Market Size, By Printing Technology, 2014�2021 (Million Units)
Table 200 Brazil: Market Size, By Technology, 2014�2021 (USD Million)
Table 201 Brazil: Market Size, By Technology, 2014�2021 (Million Units)
Table 202 Brazil: Market Size, By Label Type, 2014�2021 (USD Million)
Table 203 Brazil: Market Size, By Label Type, 2014�2021 (Million Units)
Table 204 Brazil: Market Size, By End-Use Sector, 2014�2021 (USD Million)
Table 205 Brazil: Market Size, By End-Use Sector, 2014�2021 (Million Units)
Table 206 Argentina: Inventory Tags Market Size, By Printing Technology, 2014-2021 (USD Million)
Table 207 Argentina: Market Size, By Printing Technology, 2014�2021 (Million Units)
Table 208 Argentina: Market Size, By Technology, 2014�2021 (USD Million)
Table 209 Argentina: Market Size, By Technology, 2014�2021 (Million Units)
Table 210 Argentina: Market Size, By Label Type, 2014�2021 (USD Million)
Table 211 Argentina: Market Size, By Label Type, 2014�2021 (Million Units)
Table 212 Argentina: Market Size, By End-Use Sector, 2014�2021 (USD Million)
Table 213 Argentina: Market Size, By End-Use Sector, 2014�2021 (Million Units)
Table 214 South Africa: Inventory Tags Market Size, By Printing Technology, 2014-2021 (USD Million)
Table 215 South Africa: Market Size, By Printing Technology, 2014�2021 (Million Units)
Table 216 South Africa: Market Size, By Technology, 2014�2021 (USD Million)
Table 217 South Africa: Market Size, By Technology, 2014�2021 (Million Units)
Table 218 South Africa: Market Size, By Label Type, 2014�2021 (USD Million)
Table 219 South Africa: Market Size, By Label Type, 2014�2021 (Million Units)
Table 220 South Africa: Market Size, By End-Use Sector, 2014�2021 (USD Million)
Table 221 South Africa: Market Size, By End-Use Sector, 2014�2021 (Million Units)
Table 222 Others in RoW: Inventory Tags Market Size, By Printing Technology, 2014-2021 (USD Million)
Table 223 Others in RoW: Market Size, By Printing Technology, 2014�2021 (Million Units)
Table 224 Others in RoW: Market Size, By Technology, 2014�2021 (USD Million)
Table 225 Others in RoW: Market Size, By Technology, 2014�2021 (Million Units)
Table 226 Others in RoW: Market Size, By Label Type, 2014�2021 (USD Million)
Table 227 Others in RoW: Market Size, By Label Type, 2014�2021 (Million Units)
Table 228 Others in RoW: Market Size, By End-Use Sector, 2014�2021 (USD Million)
Table 229 Others in RoW: Market Size, By End-Use Sector, 2014�2021 (Million Units)
Table 230 Agreements, Contracts, Collaborations, Joint Ventures & Partnerships, 2014-2016
Table 231 Acquisitions, 2013-2016
Table 232 Technological Advancements & New Product Developments, 2014�2016
Table 233 Expansions & Divestiture, 2014�2016
Table 234 Technological Advancements & New Product Developments
Table 235 Acquisitions
Table 236 Agreements, Contracts, Collaborations, Joint Ventures & Partnerships
List of Figures (46 Figures)
Figure 1 Inventory Tags Market
Figure 2 Inventory Tags: Market Research Design
Figure 3 Key Industry Insights
Figure 4 Breakdown of Primary Interviews, By Company Type, Designation & Region
Figure 5 Market Size Estimation Methodology: Bottom-Up Approach
Figure 6 Market Size Estimation Methodology: Top-Down Approach
Figure 7 Data Triangulation Methodology
Figure 8 Limitations of the Research Study
Figure 9 Evolution of the Inventory Tags Market
Figure 10 Market Snapshot (2016 vs 2021): Demand for Plastic Labels in the Inventory Tags Market to Grow at the Highest CAGR
Figure 11 China Projected to Be the Fastest-Growing Market for Inventory Tags, 2016�2021
Figure 12 Leading Market Players Adopted Agreements, Contracts, and Collaborations as the Key Strategy During 2010 to 2016
Figure 13 Emerging Economies Offer Attractive Opportunities in the Inventory Tags Market
Figure 14 Plastic Segment is Projected to Grow at the Highest CAGR From 2016 to 2021
Figure 15 Digital Printing Segment Projected to Grow at the Highest CAGR, 2016�2021
Figure 16 China Led the Market for Inventory Tags in the Emerging Asia-Pacific Region in 2015
Figure 17 Asia-Pacific is Projected to Be the Fastest-Growing Market in Terms of Value for Inventory Tags, 2016�2021
Figure 18 Inventory Tags Market in Asia-Pacific is Experiencing High Growth
Figure 19 Evolution of Inventory Tags
Figure 20 Inventory Tags: Market Segmentation
Figure 21 Protection Against Theft, Loss, and Counterfeiting Demands the Use of Inventory Tags
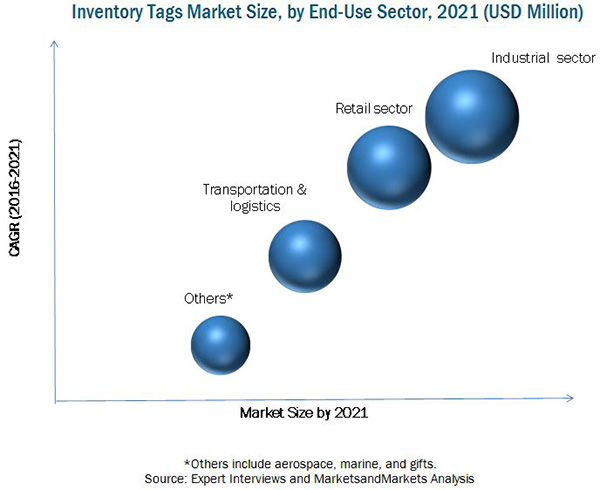
Figure 22 Inventory Tags Market Size, By End Use, 2016 vs 2021 (USD Million)
Figure 23 Plastic is Estimated to Account for the Largest Market Share in 2016
Figure 24 Digital Printing is Projected to Dominate the Global Inventory Tags Market in 2021
Figure 25 Market Size, By End Use, 2016 vs 2021 (USD Million)
Figure 26 Geographic Snapshot (2016�2021): the Markets in Asia-Pacific are Projected to Register the Highest Growth Rate
Figure 27 North American Market Snapshot
Figure 28 Europe: Snapshot
Figure 29 Asia-Pacific Market Snapshot
Figure 30 Companies Adopted Acquisitions & Partnership as Their Key Growth Strategy, 2010�2016
Figure 31 Annual Developments in the Inventory Tags Packaging Market, 2010�2016
Figure 32 Agreements, Contracts, Collaborations, Joint Ventures, and Partnerships: the Key Strategies, 2010�2016
Figure 33 Geographic Revenue Mix of Top Five Market Players
Figure 34 Avery Dennison Corporation: Company Snapshot
Figure 35 Avery Dennison Corporation: SWOT Analysis
Figure 36 3M Company: Company Snapshot
Figure 37 3M Company: SWOT Analysis
Figure 38 Zebra Technologies Corporation: Company Snapshot
Figure 39 Zebra Technologies Corporation: SWOT Analysis
Figure 40 Brady Corporation: Company Snapshot
Figure 41 Brady Corporation: SWOT Analysis
Figure 42 Tyco International PLC: Company Snapshot
Figure 43 Tyco International PLC: SWOT Analysis
Figure 44 Checkpoint Systems, Inc.: Company Snapshot
Figure 45 Hewlett-Packard Company: Company Snapshot
Figure 46 Cenveo Inc.: Company Snapshot


Growth opportunities and latent adjacency in Inventory Tags Market