We use cookies to enhance your experience. By continuing to visit this site you agree to our use of cookies . More info . X close

Lab Automation Market: Growth, Size, Share, and Trends

Report Code AST 5764
Published in Dec, 2024, By MarketsandMarkets™
Download PDF

Choose License Type

Buy Report Now Inquire Before Buying

Lab Automation Market by Product (Robotic Arm, Microplate Reader, Workstation, LIMS, ELN), Application (ADME, Drug Discovery, Diagnostic, Genomic, Proteomic, High Throughput), End User (Pharma, Diagnolab, Forensic, Environmental) - Global Forecast to 2030

Overview

The global lab automation market, valued at US$5.97 billion in 2024, stood at US$6.36 billion in 2025 and is projected to advance at a resilient CAGR of 7.2% from 2025 to 2030, culminating in a forecasted valuation of US$9.01 billion by the end of the period. The primary driver of this growth is the increasing demand for high-throughput screening, which enables laboratories to efficiently process large volumes of samples in drug discovery and diagnostics. Automated systems minimize human intervention, leading to more accurate results for both clinical and research applications.

Additionally, a shortage of skilled personnel has heightened the need for solutions that require minimal supervision, thereby reducing labor costs and improving efficiency. Ongoing advancements in robotics, artificial intelligence, and machine learning are further enhancing the capabilities of automation. Other factors contributing to the growth of this market include the personalization of medicine, rising investments in research & development, regulatory compliance, and cost-effectiveness.

Lab Automation Market– Global Forecast and Key Opportunities to 2030

Attractive Opportunities in the Lab Automation Market

North America

In North America, the lab automation market is driven primarily by the rising demand for high-throughput screening, increasing R&D expenditures, and technological innovations.

Lab automation is driven by its potential to increase throughput and improve accuracy.

Innovations in lab automation include rapid molecular diagnostics, automated testing systems, and AI-driven data analysis to get faster and more accurate results.

North America held the largest market share (40.5%) in 2024.

The lab automation market is supported by an increase in funding by public and private organizations and the development of innovative automated solutions by prominent players.

Global Lab Automation Market Dynamics

DRIVER: Growing Need for Automation in Drug Discovery

Automation is transforming drug discovery by simplifying complex workflows, improving precision, and accelerating research timelines. High-throughput screening systems, enabled by automation, can quickly test thousands of compounds, significantly reducing the time required to identify potential drug candidates. This process minimizes human error, enhances result consistency, maximizes data analysis, and improves data management.

Additionally, automation supports initial-stage processes such as target identification and ensures compliance with regulations, even though some delays still exist. Leading companies like ArrayJet (UK) and SCIEX (US) are pushing the boundaries of drug discovery by employing innovative technologies such as bioprinting and acoustic ejection mass spectrometry (AEMS). Furthermore, technologies like 3D cell models and microfluidics are improving the consistency and safety of drug development. Together, these advancements offer cost-effective and reliable automation solutions for drug discovery.


Moreover, target identification and regulatory compliance are also automated; however, at the earlier stages, they still pose bottlenecks. Key companies like Arraylet (UK) and SCIEX (US), employ cutting-edge technologies such as bioprinting and Acoustic Ejection Mass Spectrometry (AEMS), which will optimize drug discovery workflows. The 3D cell models help reduce variability and safety. In organ-on-chip cultures, microfluidics is a vital technology. Together, these are key steps toward far more efficient, yet still robust, automation solutions shortly for drug discovery.

RESTRAINT: Slow Adoption in Developing Countries

In developing nations, the widespread implementation of lab automation technologies is hindered by a number of challenges, primarily financial obstacles. The expense of maintaining and servicing laboratory informatics systems is very high, at times higher than the initial purchase price of the software itself. Additionally, periodic updates and system maintenance result in recurring costs that form a high percentage—about 20–30%—of the entire investment in such systems. For small laboratories, these recurring costs are a heavy burden.

Furthermore, the training of staff and applying of automation technology may incur an additional 15% of the total investment. This would be a significant barrier for small and medium-sized labs, particularly in areas where resources are scarce.

Another important consideration is the ambiguity surrounding long-term cost-effectiveness of these systems. Because the financial returns are not always well-proven, many likely adopters are unwilling to invest heavily. The absence of evidence regarding the returns inhibits the rapid adoption of automation, and hence the advantages it can reap in the form of increased efficiency and productivity in the laboratory environment.


OPPORTUNITY: Growth in Pharmaceutical and Biotechnology Industries

The biopharmaceutical and pharmaceutical industries are experiencing significant growth in emerging economies, particularly in India and China. While the US currently leads in pharmaceutical research and development (R&D) and holds intellectual property rights for the majority of new drugs, both India and China are gradually advancing their own industries.

India plays a crucial role in the global supply chain, producing over 50% of the world's vaccines, 40% of the generic drugs consumed in the US, and 25% of the medicines used in the UK. The country boasts a large biotechnology and pharmaceutical workforce, with approximately 5,000 biotech firms. The industry was valued at USD 12 billion in 2021. Meanwhile, China has strategically emphasized biotechnology as part of its long-term development plan, including initiatives such as "Made in China 2025." These efforts aim to propel Chinese pharmaceutical companies toward greater innovation and enhanced global competitiveness.

As the biotech and pharmaceutical sectors in China and India expand, the demand for laboratory automation is increasing. This trend is essential for enhancing the speed and precision of research and drug development processes. Consequently, there are numerous opportunities for laboratory automation companies to capitalize on the rapid evolution of these markets.

CHALLENGES: Issues related to system integration

One of the biggest challenges in lab automation is system integration. This challenge arises from the difficulty of connecting contemporary automation systems with older technologies and legacy systems. Many laboratories continue to use a wide variety of equipment and software platforms, each with its own protocols and formats. This lack of standardization leads to compatibility issues when integrating new automation tools. As a result, integration often becomes time-consuming and requires significant customization, which can result in delays, increased errors, and higher costs. Such issues can undermine the anticipated benefits of automation, such as improved efficiency and accuracy.

The integration process is typically followed by calibration, validation, and system downtime, which can further prolong the implementation timeline. If specialized expertise is needed, these delays can become quite costly. Maintaining a smooth and efficient laboratory automation system generally requires careful planning and tailored solutions. Additionally, to ensure that personnel can effectively use the automated systems, comprehensive training is essential.

Global Lab Automation Market Ecosystem Analysis

The market for laboratory automation consists of a number of products and solutions, ranging from automated workstations and robotic systems to software and automated storage and retrieval systems. These solutions find application in drug discovery, diagnostics, genomics, proteomics, and microbiology. End users of the solutions are quite varied and range from hospitals and diagnostic centers to pharmaceutical and biotechnology firms, academic institutions, forensic laboratories, environmental testing laboratories, and the food and beverage sector.

Lab Automation Market
 

Automated workstations registered largest market share in 2024

Automated workstations are expected to significantly impact the global laboratory automation market by enhancing both, precision and productivity in laboratories. These systems are designed to automate critical laboratory procedures, including sample preparation, liquid handling, and data processing, allowing labs to achieve higher efficiency and accuracy. Their value is particularly pronounced in sectors such as pharmaceuticals, biotechnology, and clinical diagnostics, where there is a growing demand for error-free, high-throughput processes.

By reducing manual intervention and streamlining workflows, automated workstations are widely adopted by leading organizations. For instance, the Fluent Liquid Handler from Tecan Group (Switzerland) features up to three robotic arms capable of performing tasks such as pipetting, tip disposal, and object gripping with exceptional precision. Additionally, advancements in robotics and intelligent software solutions have broadened the capabilities of automated workstations, enabling laboratories to manage complex testing processes while ensuring compliance with strict regulatory requirements.

Drug discovery is expected to register the largest share during the forecast period.

Drug discovery has become the leading application segment in the lab automation market, largely due to the pharmaceutical sector's need for fast and scalable screening solutions. Automation has significantly reduced manual intervention during key stages of drug discovery, including compound screening, assay development, and lead optimization. This advancement in technology streamlines processes and enhances precision.

Achieving high-throughput sample analysis with consistent accuracy is crucial for the rapid and cost-effective identification of potential drug candidates. Increasing investments in innovative treatment areas, such as oncology, infectious diseases, and neurological conditions, are driving pharmaceutical companies to incorporate automation into their research and development workflows. This shift not only boosts efficiency and data reliability but also helps meet stringent regulatory requirements.

A notable example is Automata's LINQ platform (based in the UK), which supports various drug discovery tasks, including tissue culture and assay execution, significantly contributing to the growth of this segment within the lab automation industry.

Hospitals and Diagnostic Labs Dominated End User Segment in 2024

In 2024, hospitals and diagnostic laboratories made up the majority of the lab automation end user market. This dominance is primarily due to the growing demand for high-throughput and efficient systems that can manage large volumes of samples and complex testing processes. Automation plays a crucial role in improving workflow efficiency, reducing human errors, and providing rapid, accurate diagnostic results. These innovations not only streamline operations but also enhance patient care. Equipment such as computerized sample handling systems and advanced data management software enables laboratories to conduct comprehensive testing with increased accuracy, ultimately leading to quicker and better healthcare outcomes.

US to Retain Largest Share of North American Lab Automation Market

The US is expected to continue dominating the North American lab automation market during the forecast period. This dominance is largely due to the strong presence of pharmaceutical and biotech companies, as well as the growing demand for efficient laboratory performance to manage increasing volumes of diagnostic and research-based testing. A notable example is Agilent Technologies’ investment of USD 725 million in January 2023 to enhance its nucleic acid therapeutic manufacturing capabilities.

Additionally, government support for healthcare innovation and the rapid adoption of emerging technologies such as artificial intelligence (AI) and robotics have accelerated their integration into laboratories. These advancements have significantly improved both productivity and accuracy. Given its openness to innovation and focus on operational excellence, the US is likely to maintain its leading role in lab automation in the future.

HIGHEST CAGR MARKET IN 2024-2030
CHINA FASTEST GROWING MARKET IN THE REGION
Lab Automation Market

Recent Developments of Lab Automation Market

  • In July 2023, Tecan Group (Switzerland) partnered with Singular Genomics Systems, Inc. (US) to develop customized reagent kits for the NGS library preparation system, aiming to enhance efficiency and optimize workflows in genomics research.
  • In February 2023, Tecan (Switzerland) collaborated with Element Biosciences, Inc., (US) by combining Tecan's automation solutions with advanced sequencing techniques offered by Element.
  • In 2023, Danaher Corporation (US) acquired Abcam plc (UK) to establish its presence in the proteomics sector. The deal was valued at USD 5.60 billion.
  • In April 2022, Revvity, Inc. (US) partnered with Scitera Corporation (US) to develop a new lab model that enhances lab automation through better data management and collaboration among scientists from various disciplines.

Key Market Players

Want to explore hidden markets that can drive new revenue in Lab Automation Market?

Scope of the Report

Report Metric Details
Market size available for years 2022-2029
Base Year Considered 2023
Forecast period 2024-2029
Forecast units Value (USD Million/USD Billion)
Segments covered Product, Application, End User, and Region
Geographies covered North America, Europe, Asia Pacific, Latin America, and the Middle East & Africa

Frequently Asked Questions(FAQ)

What will be the addressable market value of the global lab automation market within five years?

The global lab automation market is projected to reach USD 9,014.5 million by 2030 from USD 6,361.8 million in 2025, at a CAGR of 7.2%.

Which product type segments have the highest potential for growth in the Lab Automation market?

Automated workstations are expected to exhibit the highest growth rates.

Who are the top 3 players in the market, and how is the market landscape?

The leading players are Thermo Fisher Scientific Inc., Tecan Group, and Danaher Corporation. The market is moderately consolidated with top players holding 40–55% of market share.

What are the major strategies adopted by leading players to enter emerging regions?

Distribution agreements, partnerships, product launches, and product approvals represent the major growth strategies adopted by major market players.

What are the emerging trends in the global lab automation market?

The wave of lab automation involves the integration of artificial intelligence and machine learning aimed at optimizing data analysis and predictive modeling. The use of robotic systems for high-throughput screening and sample handling has increased significantly. Additionally, miniaturized and microfluidic-based devices are being designed and developed to make laboratory practices more cost-effective and accurate, providing greater efficiency and consistency that can be scaled for diagnostics and research.

What are the major factors likely to hamper the growth of the lab automation market?

Complex integration of automation technology, strict regulations, and high initial product prices can hinder the growth of the lab automation market.

Which end user segment will likely show the highest growth in the lab automation market?

Hospitals & diagnostic laboratories are expected to grow at the highest rate in the end user market.

Personalize This Research

  • Triangulate with your Own Data
  • Get Data as per your Format and Definition
  • Gain a Deeper Dive on a Specific Application, Geography, Customer or Competitor
  • Any level of Personalization
Request A Free Customisation

Let Us Help You

  • What are the Known and Unknown Adjacencies Impacting the Lab Automation Market
  • What will your New Revenue Sources be?
  • Who will be your Top Customer; what will make them switch?
  • Defend your Market Share or Win Competitors
  • Get a Scorecard for Target Partners
Customized Workshop Request

Table of Contents

Exclusive indicates content/data unique to MarketsandMarkets and not available with any competitors.

TITLE
PAGE NO
INTRODUCTION
31
RESEARCH METHODOLOGY
36
EXECUTIVE SUMMARY
50
PREMIUM INSIGHTS
53
MARKET OVERVIEW
57
  • 5.1 INTRODUCTION
  • 5.2 MARKET DYNAMICS
    DRIVERS
    - Need for automation in drug discovery
    - Advancements in artificial intelligence and robotics
    - Growth in demand for process automation for food safety
    - Rise in demand for automation in forensics
    RESTRAINTS
    - High initial investment costs
    - Slow adoption in developing regions
    OPPORTUNITIES
    - Increased expenditure on healthcare
    - Growth in pharmaceutical and biotechnology industries
    CHALLENGES
    - System integration issues
    - Availability of refurbished lab automation equipment
  • 5.3 TECHNOLOGY ANALYSIS
    KEY TECHNOLOGIES
    - Cobots
    - Microfluidics technology
    - High-throughput screening technologies
    COMPLEMENTARY TECHNOLOGIES
    - Cloud connectivity
    - Internet of Things
    - Digital twins
    ADJACENT TECHNOLOGIES
    - Storage & archiving systems
    - Automated analytical instruments
  • 5.4 SUPPLY CHAIN ANALYSIS
    PROMINENT COMPANIES
    SMALL AND MEDIUM-SIZED ENTERPRISES
    END USERS
  • 5.5 VALUE CHAIN ANALYSIS
  • 5.6 PORTER'S FIVE FORCES ANALYSIS
    THREAT OF NEW ENTRANTS
    THREAT OF SUBSTITUTES
    BARGAINING POWER OF SUPPLIERS
    BARGAINING POWER OF BUYERS
    INTENSITY OF COMPETITIVE RIVALRY
    KEY STAKEHOLDERS IN BUYING PROCESS
    KEY BUYING CRITERIA
  • 5.7 PATENT ANALYSIS
    LIST OF MAJOR PATENTS
  • 5.8 KEY CONFERENCES AND EVENTS
  • 5.9 TRADE DATA ANALYSIS
    IMPORT DATA (HS CODE 8479)
    EXPORT DATA (HS CODE 8479)
  • 5.10 UNMET NEEDS AND KEY PAIN POINTS
  • 5.11 ECOSYSTEM ANALYSIS
  • 5.12 TRENDS/DISRUPTIONS IMPACTING CUSTOMER BUSINESS
  • 5.13 INVESTMENT AND FUNDING SCENARIO
  • 5.14 IMPACT OF GEN AI ON LAB AUTOMATION MARKET
  • 5.15 REGULATORY LANDSCAPE
    REGULATORY STANDARDS AND APPROVALS
    - North America
    - Europe
    - Asia Pacific
    REGULATORY BODIES, GOVERNMENT AGENCIES, AND OTHER ORGANIZATIONS
  • 5.16 PRICING ANALYSIS
    AVERAGE SELLING PRICE TREND, BY REGION
    AVERAGE SELLING PRICE OF ROBOTIC ARMS, BY KEY PLAYER
IMPACT OF 2025 US TARIFF – LAB AUTOMATION MARKET
99
  • 6.1 INTRODUCTION
  • 6.2 KEY TARIFF RATES
  • 6.3 PRICE IMPACT ANALYSIS
  • 6.4 IMPACT ON COUNTRY/REGION*
    US
    EUROPE
    ASIA PACIFIC
  • 6.5 IMPACT ON END-USE INDUSTRIES
LAB AUTOMATION MARKET, BY APPLICATION
103
  • 7.1 INTRODUCTION
  • 7.2 DRUG DISCOVERY
    ACCELERATION OF DRUG DEVELOPMENT TIMELINE TO DRIVE MARKET
    HIGH-THROUGHPUT SCREENING
    - Integration with automation technologies helps rapidly identify compounds
    COMPOUND MANAGEMENT
    - Offerings by prominent players support growth
    ADME SCREENING
    - Growing requirement for ADME screening in drug discovery to fuel segment
    COMPOUND WEIGHING & DISSOLUTION
    - Potential to improve precision and operational efficiency without user intervention to boost growth
    OTHER DRUG DISCOVERY APPLICATIONS
  • 7.3 DIAGNOSTICS
    NEED FOR AUTOMATED INSTRUMENTS FOR PRECISION AND EFFICIENCY IN DIAGNOSTICS
    PRE-ANALYTICS/SAMPLE PREPARATION
    - Automation minimizes errors and cuts labor costs while enhancing precision and productivity
    ENZYME IMMUNOASSAYS
    - Rising demand for automation of EIA processes
    SAMPLE DISTRIBUTION, SPLITTING, AND ARCHIVING
    - Ease of monitoring interaction and need for reduced tube manipulation to drive segment
  • 7.4 GENOMICS
    INCREASING APPLICATION OF AUTOMATION IN GENOMICS TO FUEL GROWTH
  • 7.5 PROTEOMICS
    DEMAND FOR ROBOTICS TO REDUCE COMPLEXITY OF PROTEOME DATASETS
  • 7.6 MICROBIOLOGY
    INCREASING PRECISION AND EFFICIENCY SUPPORT DEMAND
  • 7.7 OTHER APPLICATIONS
LAB AUTOMATION MARKET, BY PRODUCT
120
  • 8.1 INTRODUCTION
  • 8.2 AUTOMATED WORKSTATIONS
    AUTOMATED LIQUID HANDLING SYSTEMS
    - Automated integrated workstations
    - Pipetting systems
    - Reagent dispensers
    - Microplate washers
    MICROPLATE READERS
    - Multi-mode microplate readers
    - Single-mode microplate readers
    AUTOMATED ELISA SYSTEMS
    - Integration of automation into ELISA system offers more benefits
    AUTOMATED NUCLEIC ACID PURIFICATION SYSTEMS
    - Wide applications of automated nucleic acid extraction systems
  • 8.3 OFF-THE-SHELF AUTOMATED WORK CELLS
    PRE-ANALYTICAL AUTOMATION
    - Enhanced efficiency through pre-analytical automation system
    POST-ANALYTICAL AUTOMATION
    - Innovative automated product launches
    TOTAL LAB AUTOMATION
    - Despite its advantages, total automation challenging to implement in most labs
  • 8.4 SOFTWARE
    LABORATORY INFORMATION MANAGEMENT SYSTEMS
    - Minimizing human errors and increasing efficacy
    ELECTRONIC LABORATORY NOTEBOOKS
    - Data security and user-friendly interface of ELN
    LABORATORY EXECUTION SYSTEMS
    - LES provides a paperless, high-productivity environment
    SCIENTIFIC DATA MANAGEMENT SYSTEMS
    - Increased application of SDMS in research
  • 8.5 ROBOTIC SYSTEMS
    ROBOTIC ARMS
    - Flexibility, accuracy, and enhanced to increase application of robotic arms
    TRACK ROBOTS
    - Innovative products offered by key players
    COLLABORATIVE ROBOTS
    - Rapidly expanding robotics technology with significant market potential
    MOBILE ROBOTS
    - Significant Technological Trends and integration with software
  • 8.6 AUTOMATED STORAGE & RETRIEVAL SYSTEMS
    AUTOMATED STORAGE AND RETRIEVAL SYSTEMS PLAY AN IMPORTANT ROLE IN DRUG DISCOVERY
  • 8.7 OTHER LAB AUTOMATION EQUIPMENT
LAB AUTOMATION MARKET, BY END USER
178
  • 9.1 INTRODUCTION
  • 9.2 BIOTECHNOLOGY & PHARMACEUTICAL COMPANIES
    NEED FOR ACCURACY DRIVES DEMAND FOR AUTOMATION
  • 9.3 HOSPITAL & DIAGNOSTIC LABORATORIES
    AUTOMATION MEETS DEMAND FOR FAST AND PRECISE RESULTS
  • 9.4 RESEARCH & ACADEMIC INSTITUTES
    INCREASE IN BIOTECHNOLOGY AND LIFE SCIENCE RESEARCH
  • 9.5 ENVIRONMENTAL TESTING LABORATORIES
    INTEGRATING AUTOMATION IN ENVIRONMENTAL TESTING LABS TO ENHANCE EFFICIENCY
  • 9.6 FORENSIC LABORATORIES
    PROMINENT COMPANIES TO ADOPT AUTOMATION IN FORENSICS FOR BETTER OUTCOME
  • 9.7 FOOD & BEVERAGE INDUSTRY
    INCREASING UTILIZATION OF ROBOTIC ARMS IN FOOD & BEVERAGE INDUSTRY
  • 9.8 OTHER END USERS
LAB AUTOMATION MARKET, BY REGION
187
  • 10.1 INTRODUCTION
  • 10.2 NORTH AMERICA
    NORTH AMERICA: MACROECONOMIC OUTLOOK
    US
    - STRATEGIES ADOPTED BY PROMINENT PLAYERS
    CANADA
    - Innovative products related to automation to boost growth
  • 10.3 EUROPE
    EUROPE: MACROECONOMIC OUTLOOK
    GERMANY
    - Presence of public & private organizations
    FRANCE
    - Rising expenditure by pharma and biotech companies
    UK
    - Advanced automated solutions
    ITALY
    - Biotechnology advancements and R&D investments drive market growth
    SWITZERLAND
    - Recent developments in automation to propel growth
    NETHERLANDS
    - Netherlands leads in R&D for lab automation solutions
    REST OF EUROPE
  • 10.4 ASIA PACIFIC
    ASIA PACIFIC: MACROECONOMIC OUTLOOK
    CHINA
    - Advanced automation solutions brought by key players
    JAPAN
    - Strategic partnerships and expansions
    INDIA
    - Automation technology gaining traction in Indian clinics and hospitals
    AUSTRALIA
    - Increase in developments
    SOUTH KOREA
    - Application of automation in microbiology and food & beverages sector
    REST OF ASIA PACIFIC
  • 10.5 LATIN AMERICA
    LATIN AMERICA: MACROECONOMIC OUTLOOK
    BRAZIL
    - Increased expenditure and expansions
    MEXICO
    - Favorable business environment for market players
    REST OF LATIN AMERICA
  • 10.6 MIDDLE EAST & AFRICA
    MIDDLE EAST & AFRICA TO ACCOUNT FOR SMALLEST SHARE OF GLOBAL MARKET
    MIDDLE EAST & AFRICA: MACROECONOMIC OUTLOOK
    GCC COUNTRIES
    - Advancements in healthcare infrastructure
    REST OF MIDDLE EAST & AFRICA
COMPETITIVE LANDSCAPE
291
  • 11.1 OVERVIEW
  • 11.2 KEY PLAYER STRATEGY/RIGHT TO WIN
  • 11.3 REVENUE ANALYSIS, 2020–2023
  • 11.4 MARKET SHARE ANALYSIS, 2023
    RANKING OF KEY MARKET PLAYERS
  • 11.5 COMPANY EVALUATION MATRIX: KEY PLAYERS, 2024
    STARS
    EMERGING LEADERS
    PERVASIVE PLAYERS
    PARTICIPANTS
    COMPANY FOOTPRINT: KEY PLAYERS, 2024
    - Company footprint
    - Region footprint
    - Application footprint
    - End user footprint
  • 11.6 COMPANY EVALUATION MATRIX: STARTUPS/SMES, 2024
    PROGRESSIVE COMPANIES
    RESPONSIVE COMPANIES
    DYNAMIC COMPANIES
    STARTING BLOCKS
    COMPANY BENCHMARKING: STARTUPS/SMES, 2024
    - Competitive benchmarking of emerging players/startups
    - Detailed list of key startups/SMEs
  • 11.7 COMPANY VALUATION AND FINANCIAL METRICS
  • 11.8 PRODUCT/BRAND COMPARISON
  • 11.9 COMPETITIVE SCENARIO
    PRODUCT LAUNCHES AND APPROVALS
    DEALS
COMPANY PROFILES
314
  • 12.1 KEY PLAYERS
    THERMO FISHER SCIENTIFIC INC.
    - Business overview
    - Products offered
    - Recent developments
    - MnM view
    TECAN TRADING AG
    - Business overview
    - Products offered
    - Recent developments
    - MnM view
    DANAHER CORPORATION
    - Business overview
    - Products offered
    - Recent developments
    - MnM view
    AGILENT TECHNOLOGIES
    - Business overview
    - Products offered
    - Recent developments
    - MnM view
    F. HOFFMANN-LA ROCHE LTD.
    - Business overview
    - Products offered
    - Recent developments
    - MnM view
    METTLER TOLEDO
    - Business overview
    - Products Offered
    - Recent developments
    REVVITY, INC.
    - Business overview
    - Products offered
    - Recent developments
    EPPENDORF SE
    - Business overview
    - Products offered
    - Recent developments
    BECTON, DICKINSON AND COMPANY
    - Business overview
    - Products offered
    - Recent developments
    WATERS CORPORATION
    - Business overview
    - Products offered
    - Recent developments
    SIEMENS HEALTHINEERS
    - Business overview
    - Products offered
    - Recent developments
    ABBOTT LABORATORIES
    - Business overview
    - Products offered
    BIOMÉRIEUX
    - Business overview
    - Products offered
    HAMILTON COMPANY
    - Business overview
    - Products offered
    - Recent developments
    HUDSON ROBOTICS
    - Business overview
    - Products offered
    - Recent developments
  • 12.2 OTHER COMPANIES
    GILSON, INC.
    BMG LABTECH
    FESTO AG & CO. KG
    AURORA BIOMED INC.
    HIGHRES BIOSOLUTIONS
    OPENTRONS LABWORKS INC.
    PEAK ANALYSIS AND AUTOMATION
    QIAGEN N.V.
    LABVANTAGE SOLUTIONS, INC.
    BIO-RAD LABORATORIES, INC.
    LABWARE
    SYSMEX CORPORATION
    UNIVERSAL ROBOTS
    AB CONTROLS, INC.
    AUTOMATA
    SPT LABTECH
    BIOSERO, INC.
APPENDIX
396
  • 13.1 DISCUSSION GUIDE
  • 13.2 KNOWLEDGESTORE: MARKETSANDMARKETS’ SUBSCRIPTION PORTAL
  • 13.3 CUSTOMIZATION OPTIONS
  • 13.4 RELATED REPORTS
  • 13.5 AUTHOR DETAILS
LIST OF TABLES
 
  • TABLE 1 LAB AUTOMATION MARKET: INCLUSIONS AND EXCLUSIONS
  • TABLE 2 METHODOLOGY-RELATED ASSUMPTIONS
  • TABLE 3 LIMITATIONS AND ASSOCIATED RISKS
  • TABLE 4 COMPANIES AND THEIR LAB AUTOMATION TECHNOLOGIES FOR DRUG DISCOVERY
  • TABLE 5 LAB AUTOMATION MARKET: PORTER'S FIVE FORCES ANALYSIS
  • TABLE 6 INFLUENCE OF STAKEHOLDERS ON BUYING PROCESS, BY PRODUCT
  • TABLE 7 INFLUENCE OF KEY STAKEHOLDERS ON BUYING PROCESS
  • TABLE 8 INFLUENCE OF STAKEHOLDERS ON BUYING PROCESS, BY END USER
  • TABLE 9 LAB AUTOMATION MARKET: LIST OF MAJOR PATENTS, 2022–2025
  • TABLE 10 LAB AUTOMATION MARKET: KEY CONFERENCES AND EVENTS, JANUARY 2025–DECEMBER 2026
  • TABLE 11 IMPORT DATA FOR HS CODE 8479, BY COUNTRY, 2019–2023 (USD THOUSAND)
  • TABLE 12 EXPORT DATA FOR HS CODE 8479, BY COUNTRY, 2019−2023 (USD THOUSAND)
  • TABLE 13 LAB AUTOMATION MARKET: CURRENT UNMET NEEDS
  • TABLE 14 LAB AUTOMATION MARKET: ROLE OF ECOSYSTEM
  • TABLE 15 EXAMPLES OF LAB AUTOMATION SOFTWARE SYSTEMS
  • TABLE 16 US FDA: MEDICAL DEVICE CLASSIFICATION
  • TABLE 17 CANADA: TIME, COST, AND COMPLEXITY OF REGISTRATION
  • TABLE 18 EUROPE: LEVEL OF RISK, TIME, COST, AND COMPLEXITY OF REGISTRATION PROCESS
  • TABLE 19 JAPAN: TIME, COST, AND COMPLEXITY OF REGISTRATION
  • TABLE 20 CHINA: TIME, COST, AND COMPLEXITY OF REGISTRATION
  • TABLE 21 NORTH AMERICA: REGULATORY BODIES, GOVERNMENT AGENCIES, AND OTHER ORGANIZATIONS
  • TABLE 22 EUROPE: REGULATORY BODIES, GOVERNMENT AGENCIES, AND OTHER ORGANIZATIONS
  • TABLE 23 ASIA PACIFIC: REGULATORY BODIES, GOVERNMENT AGENCIES, AND OTHER ORGANIZATIONS
  • TABLE 24 LATIN AMERICA: REGULATORY BODIES, GOVERNMENT AGENCIES, AND OTHER ORGANIZATIONS
  • TABLE 25 ROW: LIST OF REGULATORY BODIES, GOVERNMENT AGENCIES, AND OTHER ORGANIZATIONS
  • TABLE 26 AVERAGE SELLING PRICE OF LAB AUTOMATION EQUIPMENT, BY REGION, 2022–2024(USD THOUSAND)
  • TABLE 27 AVERAGE SELLING PRICE OF ROBOTIC ARMS, BY KEY PLAYER, 2024 (USD THOUSAND)
  • TABLE 28 US ADJUSTED RECIPROCAL TARIFF RATES
  • TABLE 29 LAB AUTOMATION MARKET, BY APPLICATION, 2023–2030 (USD MILLION)
  • TABLE 30 LAB AUTOMATION MARKET FOR DRUG DISCOVERY, BY TYPE, 2023–2030 (USD MILLION)
  • TABLE 31 LAB AUTOMATION MARKET FOR DRUG DISCOVERY, BY REGION, 2023–2030 (USD MILLION)
  • TABLE 32 LAB AUTOMATION MARKET FOR HIGH-THROUGHPUT SCREENING, BY REGION, 2023–2030 (USD MILLION)
  • TABLE 33 LAB AUTOMATION MARKET FOR COMPOUND MANAGEMENT, BY REGION, 2023–2030 (USD MILLION)
  • TABLE 34 LAB AUTOMATION MARKET FOR ADME SCREENING, BY REGION, 2023–2030 (USD MILLION)
  • TABLE 35 LAB AUTOMATION MARKET FOR COMPOUND WEIGHING & DISSOLUTION, BY REGION, 2023–2030 (USD MILLION)
  • TABLE 36 LAB AUTOMATION MARKET FOR OTHER DRUG DISCOVERY APPLICATIONS, BY REGION, 2023–2030 (USD MILLION)
  • TABLE 37 LAB AUTOMATION MARKET FOR DIAGNOSTICS, BY TYPE, 2023–2030 (USD MILLION)
  • TABLE 38 LAB AUTOMATION MARKET FOR DIAGNOSTICS, BY REGION, 2023–2030 (USD MILLION)
  • TABLE 39 LAB AUTOMATION MARKET FOR PRE-ANALYTICS/SAMPLE PREPARATION, BY REGION, 2023–2030 (USD MILLION)
  • TABLE 40 LAB AUTOMATION MARKET FOR ENZYME IMMUNOASSAYS, BY REGION, 2023–2030 (USD MILLION)
  • TABLE 41 LAB AUTOMATION MARKET FOR SAMPLE DISTRIBUTION, SPLITTING, AND ARCHIVING, BY REGION, 2023–2030 (USD MILLION)
  • TABLE 42 LAB AUTOMATION MARKET FOR GENOMICS BY REGION, 2023–2030 (USD MILLION)
  • TABLE 43 LAB AUTOMATION MARKET FOR PROTEOMICS, BY REGION, 2023–2030 (USD MILLION)
  • TABLE 44 LAB AUTOMATION MARKET FOR MICROBIOLOGY, BY REGION, 2023–2030 (USD MILLION)
  • TABLE 45 LAB AUTOMATION MARKET FOR OTHER APPLICATIONS, BY REGION, 2023–2030 (USD MILLION)
  • TABLE 46 LAB AUTOMATION MARKET, BY PRODUCT, 2023–2030 (USD MILLION)
  • TABLE 47 GLOBAL LAB AUTOMATION MARKET VOLUME, 2023–2030 (UNITS)
  • TABLE 48 AUTOMATED WORKSTATIONS MARKET, BY PRODUCT, 2023–2030 (USD MILLION)
  • TABLE 49 AUTOMATED WORKSTATIONS MARKET, BY REGION, 2023–2030 (USD MILLION)
  • TABLE 50 AUTOMATED WORKSTATIONS MARKET, BY APPLICATION, 2023–2030 (USD MILLION)
  • TABLE 51 AUTOMATED WORKSTATIONS MARKET, BY END USER, 2023–2030 (USD MILLION)
  • TABLE 52 AUTOMATED LIQUID HANDLING SYSTEMS MARKET, BY REGION, 2023–2030 (USD MILLION)
  • TABLE 53 AUTOMATED LIQUID HANDLING SYSTEMS MARKET, BY TYPE, 2023–2030 (USD MILLION)
  • TABLE 54 LAB AUTOMATION MARKET FOR AUTOMATED LIQUID HANDLING SYSTEMS, BY APPLICATION, 2023–2030 (USD MILLION)
  • TABLE 55 LAB AUTOMATION MARKET FOR AUTOMATED LIQUID HANDLING SYSTEMS, BY END USER, 2023–2030 (USD MILLION)
  • TABLE 56 AUTOMATED INTEGRATED WORKSTATIONS MARKET, BY REGION, 2023–2030 (USD MILLION)
  • TABLE 57 PIPETTING SYSTEMS MARKET, BY REGION, 2023–2030 (USD MILLION)
  • TABLE 58 REAGENT DISPENSERS MARKET, BY REGION, 2023–2030 (USD MILLION)
  • TABLE 59 MICROPLATE WASHERS MARKET, BY REGION, 2023–2030 (USD MILLION)
  • TABLE 60 MICROPLATE READERS MARKET, BY REGION, 2023–2030 (USD MILLION)
  • TABLE 61 MICROPLATE READERS MARKET, BY TYPE, 2023–2030 (USD MILLION)
  • TABLE 62 MICROPLATE READERS MARKET, BY APPLICATION, 2023–2030 (USD MILLION)
  • TABLE 63 MICROPLATE READERS MARKET, BY END USER, 2023–2030 (USD MILLION)
  • TABLE 64 MULTI-MODE MICROPLATE READERS MARKET, BY TYPE, 2023–2030 (USD MILLION)
  • TABLE 65 MULTI-MODE MICROPLATE READERS MARKET, BY REGION, 2023–2030 (USD MILLION)
  • TABLE 66 FILTER-BASED READERS MARKET, BY REGION, 2023–2030 (USD MILLION)
  • TABLE 67 MONOCHROMATOR-BASED READERS MARKET, BY REGION, 2023–2030 (USD MILLION)
  • TABLE 68 HYBRID READERS MARKET, BY REGION, 2023–2030 (USD MILLION)
  • TABLE 69 SINGLE-MODE MICROPLATE READERS MARKET, BY TYPE, 2023–2030 (USD MILLION)
  • TABLE 70 SINGLE-MODE MICROPLATE READERS MARKET, BY REGION,2023–2030 (USD MILLION)
  • TABLE 71 FLUORESCENCE READERS MARKET, BY REGION, 2023–2030 (USD MILLION)
  • TABLE 72 ABSORBANCE READERS MARKET, BY REGION, 2023–2030 (USD MILLION)
  • TABLE 73 LUMINESCENCE READERS MARKET, BY REGION, 2023–2030 (USD MILLION)
  • TABLE 74 AUTOMATED ELISA SYSTEMS MARKET, BY REGION, 2023–2030 (USD MILLION)
  • TABLE 75 AUTOMATED ELISA SYSTEMS MARKET, BY APPLICATION, 2023–2030 (USD MILLION)
  • TABLE 76 AUTOMATED ELISA SYSTEMS MARKET, BY END USER, 2023–2030 (USD MILLION)
  • TABLE 77 AUTOMATED NUCLEIC ACID PURIFICATION SYSTEMS MARKET, BY REGION, 2023–2030 (USD MILLION)
  • TABLE 78 AUTOMATED NUCLEIC ACID PURIFICATION SYSTEMS MARKET, BY APPLICATION, 2023–2030 (USD MILLION)
  • TABLE 79 AUTOMATED NUCLEIC ACID PURIFICATION SYSTEMS MARKET, BY END USER, 2023–2030 (USD MILLION)
  • TABLE 80 OFF-THE-SHELF AUTOMATED WORK CELLS MARKET, BY TYPE, 2023–2030 (USD MILLION)
  • TABLE 81 OFF-THE-SHELF AUTOMATED WORK CELLS MARKET, BY REGION, 2023–2030 (USD MILLION)
  • TABLE 82 OFF-THE-SHELF AUTOMATED WORK CELLS MARKET, BY APPLICATION, 2023–2030 (USD MILLION)
  • TABLE 83 OFF-THE-SHELF AUTOMATED WORK CELLS MARKET, BY END USER, 2023–2030 (USD MILLION)
  • TABLE 84 PRE-ANALYTICAL AUTOMATION MARKET, BY REGION, 2023–2030 (USD MILLION)
  • TABLE 85 PRE-ANALYTICAL AUTOMATION MARKET, BY APPLICATION, 2023–2030 (USD MILLION)
  • TABLE 86 LAB AUTOMATION MARKET FOR PRE-ANALYTICAL AUTOMATION, BY END USER, 2023–2030 (USD MILLION)
  • TABLE 87 POST-ANALYTICAL AUTOMATION MARKET, BY REGION, 2023–2030 (USD MILLION)
  • TABLE 88 POST-ANALYTICAL AUTOMATION MARKET, BY APPLICATION, 2023–2030 (USD MILLION)
  • TABLE 89 POST-ANALYTICAL AUTOMATION MARKET, BY END USER, 2023–2030 (USD MILLION)
  • TABLE 90 LAB AUTOMATION MARKET FOR TOTAL LAB AUTOMATION, BY REGION, 2023–2030 (USD MILLION)
  • TABLE 91 LAB AUTOMATION MARKET FOR TOTAL LAB AUTOMATION, BY APPLICATION, 2023–2030 (USD MILLION)
  • TABLE 92 LAB AUTOMATION MARKET FOR TOTAL LAB AUTOMATION, BY END USER, 2023–2030 (USD MILLION)
  • TABLE 93 LAB AUTOMATION SOFTWARE MARKET, BY TYPE, 2023–2030 (USD MILLION)
  • TABLE 94 LAB AUTOMATION SOFTWARE MARKET, BY REGION, 2023–2030 (USD MILLION)
  • TABLE 95 LAB AUTOMATION SOFTWARE MARKET, BY APPLICATION, 2023–2030 (USD MILLION)
  • TABLE 96 LAB AUTOMATION SOFTWARE MARKET, BY END USER, 2023–2030 (USD MILLION)
  • TABLE 97 LABORATORY INFORMATION MANAGEMENT SYSTEMS MARKET, BY REGION, 2023–2030 (USD MILLION)
  • TABLE 98 LABORATORY INFORMATION MANAGEMENT SYSTEMS MARKET, BY APPLICATION, 2023–2030 (USD MILLION)
  • TABLE 99 LABORATORY INFORMATION MANAGEMENT SYSTEMS MARKET, BY END USER, 2023–2030 (USD MILLION)
  • TABLE 100 ELECTRONIC LABORATORY NOTEBOOKS MARKET, BY REGION, 2023–2030 (USD MILLION)
  • TABLE 101 LAB AUTOMATION MARKET FOR ELECTRONIC LABORATORY NOTEBOOKS,BY APPLICATION, 2023–2030 (USD MILLION)
  • TABLE 102 LAB AUTOMATION MARKET FOR ELECTRONIC LABORATORY NOTEBOOKS, BY END USER, 2023–2030 (USD MILLION)
  • TABLE 103 LABORATORY EXECUTION SYSTEMS MARKET, BY REGION, 2023–2030 (USD MILLION)
  • TABLE 104 LABORATORY EXECUTION SYSTEMS MARKET, BY APPLICATION, 2023–2030 (USD MILLION)
  • TABLE 105 LABORATORY EXECUTION SYSTEMS MARKET, BY END USER, 2023–2030 (USD MILLION)
  • TABLE 106 LAB AUTOMATION MARKET FOR SCIENTIFIC DATA MANAGEMENT SYSTEMS, BY REGION, 2023–2030 (USD MILLION)
  • TABLE 107 SCIENTIFIC DATA MANAGEMENT SYSTEMS MARKET, BY APPLICATION, 2023–2030 (USD MILLION)
  • TABLE 108 SCIENTIFIC DATA MANAGEMENT SYSTEMS MARKET, BY END USER, 2023–2030 (USD MILLION)
  • TABLE 109 ROBOTIC SYSTEMS MARKET, BY TYPE, 2023–2030 (USD MILLION)
  • TABLE 110 ROBOTIC SYSTEMS MARKET, BY REGION, 2023–2030 (USD MILLION)
  • TABLE 111 ROBOTIC SYSTEMS MARKET, BY APPLICATION, 2023–2030 (USD MILLION)
  • TABLE 112 ROBOTIC SYSTEMS MARKET, BY END USER, 2023–2030 (USD MILLION)
  • TABLE 113 LAB AUTOMATION MARKET FOR ROBOTIC ARMS, BY REGION, 2023–2030 (USD MILLION)
  • TABLE 114 ROBOTIC ARMS MARKET, BY APPLICATION, 2023–2030 (USD MILLION)
  • TABLE 115 ROBOTIC ARMS MARKET, BY END USER, 2023–2030 (USD MILLION)
  • TABLE 116 TRACK ROBOTS MARKET, BY REGION, 2023–2030 (USD MILLION)
  • TABLE 117 LAB AUTOMATION MARKET FOR TRACK ROBOTS, BY APPLICATION, 2023–2030 (USD MILLION)
  • TABLE 118 TRACK ROBOTS MARKET, BY END USER, 2023–2030 (USD MILLION)
  • TABLE 119 COLLABORATIVE ROBOTS MARKET, BY REGION, 2023–2030 (USD MILLION)
  • TABLE 120 COLLABORATIVE ROBOTS MARKET, BY APPLICATION, 2023–2030 (USD MILLION)
  • TABLE 121 COLLABORATIVE ROBOTS MARKET, BY END USER, 2023–2030 (USD MILLION)
  • TABLE 122 LAB MOBILE ROBOTS MARKET, BY REGION, 2023–2030 (USD MILLION)
  • TABLE 123 MOBILE ROBOTS MARKET, BY APPLICATION, 2023–2030 (USD MILLION)
  • TABLE 124 MOBILE ROBOTS MARKET, BY END USER, 2023–2030 (USD MILLION)
  • TABLE 125 AUTOMATED STORAGE & RETRIEVAL SYSTEMS MARKET, BY REGION, 2023–2030 (USD MILLION)
  • TABLE 126 AUTOMATED STORAGE & RETRIEVAL SYSTEMS MARKET, BY APPLICATION, 2023–2030 (USD MILLION)
  • TABLE 127 AUTOMATED STORAGE & RETRIEVAL SYSTEMS MARKET, BY END USER, 2023–2030 (USD MILLION)
  • TABLE 128 OTHER LAB AUTOMATION EQUIPMENT MARKET, BY REGION, 2023–2030 (USD MILLION)
  • TABLE 129 OTHER LAB AUTOMATION EQUIPMENT MARKET, BY APPLICATION, 2023–2030 (USD MILLION)
  • TABLE 130 OTHER LAB AUTOMATION EQUIPMENT MARKET, BY END USER, 2023–2030 (USD MILLION)
  • TABLE 131 LAB AUTOMATION MARKET, BY END USER, 2023–2030 (USD MILLION)
  • TABLE 132 LAB AUTOMATION MARKET FOR BIOTECHNOLOGY & PHARMACEUTICAL COMPANIES, BY REGION, 2023–2030 (USD MILLION)
  • TABLE 133 LAB AUTOMATION MARKET FOR HOSPITAL & DIAGNOSTIC LABORATORIES, BY REGION, 2023–2030 (USD MILLION)
  • TABLE 134 LAB AUTOMATION MARKET FOR RESEARCH & ACADEMIC INSTITUTES, BY REGION, 2023–2030 (USD MILLION)
  • TABLE 135 LAB AUTOMATION MARKET FOR ENVIRONMENTAL TESTING LABORATORIES, BY REGION, 2023–2030 (USD MILLION)
  • TABLE 136 LAB AUTOMATION MARKET FOR FORENSIC LABORATORIES, BY REGION, 2023–2030 (USD MILLION)
  • TABLE 137 LAB AUTOMATION MARKET FOR FOOD & BEVERAGE INDUSTRY, BY REGION, 2023–2030 (USD MILLION)
  • TABLE 138 LAB AUTOMATION MARKET FOR OTHER END USERS, BY REGION, 2023–2030 (USD MILLION)
  • TABLE 139 LAB AUTOMATION MARKET, BY REGION, 2023–2030 (USD MILLION)
  • TABLE 140 NORTH AMERICA: MACROECONOMIC OUTLOOK, 2024
  • TABLE 141 NORTH AMERICA: LAB AUTOMATION MARKET, BY COUNTRY, 2023–2030 (USD MILLION)
  • TABLE 142 NORTH AMERICA: LAB AUTOMATION MARKET, BY PRODUCT, 2023–2030 (USD MILLION)
  • TABLE 143 NORTH AMERICA: AUTOMATED WORKSTATIONS MARKET, BY TYPE, 2023–2030 (USD MILLION)
  • TABLE 144 NORTH AMERICA: AUTOMATED LIQUID HANDLING SYSTEMS MARKET, BY TYPE, 2023–2030 (USD MILLION)
  • TABLE 145 NORTH AMERICA: AUTOMATED MICROPLATE READERS MARKET, BY TYPE, 2023–2030 (USD MILLION)
  • TABLE 146 NORTH AMERICA: MULTI-MODE MICROPLATE READERS MARKET, BY TYPE, 2023–2030 (USD MILLION)
  • TABLE 147 NORTH AMERICA: SINGLE-MODE MICROPLATE READERS MARKET, BY TYPE, 2023–2030 (USD MILLION)
  • TABLE 148 NORTH AMERICA: OFF-THE-SHELF AUTOMATED WORK CELLS MARKET, BY TYPE, 2023–2030 (USD MILLION)
  • TABLE 149 NORTH AMERICA: ROBOTIC SYSTEMS MARKET, BY TYPE, 2023–2030 (USD MILLION)
  • TABLE 150 NORTH AMERICA: LAB AUTOMATION SOFTWARE MARKET, BY TYPE, 2023–2030 (USD MILLION)
  • TABLE 151 NORTH AMERICA: LAB AUTOMATION MARKET, BY APPLICATION, 2023–2030 (USD MILLION)
  • TABLE 152 NORTH AMERICA: LAB AUTOMATION MARKET FOR DRUG DISCOVERY, BY TYPE, 2023–2030 (USD MILLION)
  • TABLE 153 NORTH AMERICA: LAB AUTOMATION MARKET FOR DIAGNOSTICS, BY TYPE,2023–2030 (USD MILLION)
  • TABLE 154 NORTH AMERICA: LAB AUTOMATION MARKET, BY END USER, 2023–2030 (USD MILLION)
  • TABLE 155 US: LAB AUTOMATION MARKET, BY PRODUCT, 2023–2030 (USD MILLION)
  • TABLE 156 US: AUTOMATED WORKSTATIONS MARKET, BY TYPE, 2023–2030 (USD MILLION)
  • TABLE 157 US: OFF-THE-SHELF AUTOMATED WORK CELLS MARKET, BY TYPE, 2023–2030 (USD MILLION)
  • TABLE 158 US: ROBOTIC SYSTEMS MARKET, BY TYPE, 2023–2030 (USD MILLION)
  • TABLE 159 US: LAB AUTOMATION SOFTWARE MARKET, BY TYPE, 2023–2030 (USD MILLION)
  • TABLE 160 CANADA: LAB AUTOMATION MARKET, BY PRODUCT, 2023–2030 (USD MILLION)
  • TABLE 161 CANADA: AUTOMATED WORKSTATIONS MARKET, BY TYPE, 2023–2030 (USD MILLION)
  • TABLE 162 CANADA: OFF-THE-SHELF AUTOMATED WORK CELLS MARKET, BY TYPE, 2023–2030 (USD MILLION)
  • TABLE 163 CANADA: ROBOTIC SYSTEMS MARKET, BY TYPE, 2023–2030 (USD MILLION)
  • TABLE 164 CANADA: LAB AUTOMATION SOFTWARE MARKET, BY TYPE, 2023–2030 (USD MILLION)
  • TABLE 165 EUROPE: MACROECONOMIC OUTLOOK
  • TABLE 166 EUROPE: LAB AUTOMATION MARKET, BY COUNTRY, 2023–2030 (USD MILLION)
  • TABLE 167 EUROPE: LAB AUTOMATION MARKET, BY PRODUCT, 2023–2030 (USD MILLION)
  • TABLE 168 EUROPE: AUTOMATED WORKSTATIONS MARKET, BY TYPE, 2023–2030 (USD MILLION)
  • TABLE 169 EUROPE: AUTOMATED LIQUID HANDLING SYSTEMS MARKET, BY TYPE, 2023–2030 (USD MILLION)
  • TABLE 170 EUROPE: AUTOMATED MICROPLATE READERS MARKET, BY TYPE, 2023–2030 (USD MILLION)
  • TABLE 171 EUROPE: MULTI-MODE MICROPLATE READERS MARKET, BY TYPE, 2023–2030 (USD MILLION)
  • TABLE 172 EUROPE: SINGLE-MODE MICROPLATE READERS MARKET,BY TYPE, 2023–2030 (USD MILLION)
  • TABLE 173 EUROPE: OFF-THE-SHELF AUTOMATED WORK CELLS MARKET, BY TYPE, 2023–2030 (USD MILLION)
  • TABLE 174 EUROPE: ROBOTIC SYSTEMS MARKET, BY TYPE, 2023–2030 (USD MILLION)
  • TABLE 175 EUROPE: LAB AUTOMATION SOFTWARE MARKET, BY TYPE, 2023–2030 (USD MILLION)
  • TABLE 176 EUROPE: LAB AUTOMATION MARKET, BY APPLICATION, 2023–2030 (USD MILLION)
  • TABLE 177 EUROPE: LAB AUTOMATION MARKET FOR DRUG DISCOVERY, BY TYPE, 2023–2030 (USD MILLION)
  • TABLE 178 EUROPE: LAB AUTOMATION MARKET FOR DIAGNOSTICS, BY TYPE, 2023–2030 (USD MILLION)
  • TABLE 179 EUROPE: LAB AUTOMATION MARKET, BY END USER, 2023–2030 (USD MILLION)
  • TABLE 180 GERMANY: LAB AUTOMATION MARKET, BY PRODUCT, 2023–2030 (USD MILLION)
  • TABLE 181 GERMANY: AUTOMATED WORKSTATIONS MARKET, BY TYPE, 2023–2030 (USD MILLION)
  • TABLE 182 GERMANY: OFF-THE-SHELF AUTOMATED WORK CELLS MARKET, BY TYPE, 2023–2030 (USD MILLION)
  • TABLE 183 GERMANY: ROBOTIC SYSTEMS MARKET, BY TYPE, 2023–2030 (USD MILLION)
  • TABLE 184 GERMANY: LAB AUTOMATION SOFTWARE MARKET, BY TYPE, 2023–2030 (USD MILLION)
  • TABLE 185 FRANCE: LAB AUTOMATION MARKET, BY PRODUCT, 2023–2030 (USD MILLION)
  • TABLE 186 FRANCE: AUTOMATED WORKSTATIONS MARKET, BY TYPE, 2023–2030 (USD MILLION)
  • TABLE 187 FRANCE: OFF-THE-SHELF AUTOMATED WORK CELLS MARKET, BY TYPE, 2023–2030 (USD MILLION)
  • TABLE 188 FRANCE: ROBOTIC SYSTEMS MARKET, BY TYPE, 2023–2030 (USD MILLION)
  • TABLE 189 FRANCE: LAB AUTOMATION SOFTWARE MARKET, BY TYPE, 2023–2030 (USD MILLION)
  • TABLE 190 UK: LAB AUTOMATION MARKET, BY PRODUCT, 2023–2030 (USD MILLION)
  • TABLE 191 UK: AUTOMATED WORKSTATIONS MARKET, BY TYPE, 2023–2030 (USD MILLION)
  • TABLE 192 UK: OFF-THE-SHELF AUTOMATED WORK CELLS MARKET, BY TYPE, 2023–2030 (USD MILLION)
  • TABLE 193 UK: ROBOTIC SYSTEMS MARKET, BY TYPE, 2023–2030 (USD MILLION)
  • TABLE 194 UK: LAB AUTOMATION SOFTWARE MARKET, BY TYPE, 2023–2030 (USD MILLION)
  • TABLE 195 ITALY: LAB AUTOMATION MARKET, BY PRODUCT, 2023–2030 (USD MILLION)
  • TABLE 196 ITALY: AUTOMATED WORKSTATIONS MARKET, BY TYPE, 2023–2030 (USD MILLION)
  • TABLE 197 ITALY: OFF-THE-SHELF AUTOMATED WORK CELLS MARKET, BY TYPE, 2023–2030 (USD MILLION)
  • TABLE 198 ITALY: ROBOTIC SYSTEMS MARKET, BY TYPE, 2023–2030 (USD MILLION)
  • TABLE 199 ITALY: LAB AUTOMATION SOFTWARE MARKET, BY TYPE, 2023–2030 (USD MILLION)
  • TABLE 200 SWITZERLAND: LAB AUTOMATION MARKET, BY PRODUCT, 2023–2030 (USD MILLION)
  • TABLE 201 SWITZERLAND: AUTOMATED WORKSTATIONS MARKET, BY TYPE, 2023–2030 (USD MILLION)
  • TABLE 202 SWITZERLAND: OFF-THE-SHELF AUTOMATED WORK CELLS MARKET, BY TYPE, 2023–2030 (USD MILLION)
  • TABLE 203 SWITZERLAND: ROBOTIC SYSTEMS MARKET, BY TYPE, 2023–2030 (USD MILLION)
  • TABLE 204 SWITZERLAND: LAB AUTOMATION SOFTWARE MARKET, BY TYPE, 2023–2030 (USD MILLION)
  • TABLE 205 NETHERLANDS: LAB AUTOMATION MARKET, BY PRODUCT, 2023–2030 (USD MILLION)
  • TABLE 206 NETHERLANDS: AUTOMATED WORKSTATIONS MARKET, BY TYPE, 2023–2030 (USD MILLION)
  • TABLE 207 NETHERLANDS: OFF-THE-SHELF AUTOMATED WORK CELLS MARKET, BY TYPE, 2023–2030 (USD MILLION)
  • TABLE 208 NETHERLANDS: ROBOTIC SYSTEMS MARKET, BY TYPE, 2023–2030 (USD MILLION)
  • TABLE 209 NETHERLANDS: LAB AUTOMATION SOFTWARE MARKET, BY TYPE, 2023–2030 (USD MILLION)
  • TABLE 210 REST OF EUROPE: LAB AUTOMATION MARKET, BY PRODUCT, 2023–2030 (USD MILLION)
  • TABLE 211 REST OF EUROPE: AUTOMATED WORKSTATIONS MARKET, BY TYPE, 2023–2030 (USD MILLION)
  • TABLE 212 REST OF EUROPE: OFF-THE-SHELF AUTOMATED WORK CELLS MARKET, BY TYPE, 2023–2030 (USD MILLION)
  • TABLE 213 REST OF EUROPE: ROBOTIC SYSTEMS MARKET, BY TYPE, 2023–2030 (USD MILLION)
  • TABLE 214 REST OF EUROPE: LAB AUTOMATION SOFTWARE MARKET, BY TYPE, 2023–2030 (USD MILLION)
  • TABLE 215 ASIA PACIFIC: MACROECONOMIC INDICATORS
  • TABLE 216 ASIA PACIFIC: LAB AUTOMATION MARKET, BY COUNTRY, 2023–2030 (USD MILLION)
  • TABLE 217 ASIA PACIFIC: LAB AUTOMATION MARKET, BY PRODUCT, 2023–2030 (USD MILLION)
  • TABLE 218 ASIA PACIFIC: AUTOMATED WORKSTATIONS MARKET, BY TYPE, 2023–2030 (USD MILLION)
  • TABLE 219 ASIA PACIFIC: AUTOMATED LIQUID HANDLING SYSTEMS MARKET, BY TYPE, 2023–2030 (USD MILLION)
  • TABLE 220 ASIA PACIFIC: AUTOMATED MICROPLATE READERS MARKET, BY TYPE, 2023–2030 (USD MILLION)
  • TABLE 221 ASIA PACIFIC: MULTI-MODE MICROPLATE READERS MARKET, BY TYPE, 2023–2030 (USD MILLION)
  • TABLE 222 ASIA PACIFIC: SINGLE-MODE MICROPLATE READERS MARKET, BY TYPE, 2023–2030 (USD MILLION)
  • TABLE 223 ASIA PACIFIC: OFF-THE-SHELF AUTOMATED WORK CELLS MARKET, BY TYPE, 2023–2030 (USD MILLION)
  • TABLE 224 ASIA PACIFIC: ROBOTIC SYSTEMS MARKET, BY TYPE, 2023–2030 (USD MILLION)
  • TABLE 225 ASIA PACIFIC: LAB AUTOMATION SOFTWARE MARKET, BY TYPE, 2023–2030 (USD MILLION)
  • TABLE 226 ASIA PACIFIC: LAB AUTOMATION MARKET, BY APPLICATION, 2023–2030 (USD MILLION)
  • TABLE 227 ASIA PACIFIC: LAB AUTOMATION MARKET FOR DRUG DISCOVERY, BY TYPE, 2023–2030 (USD MILLION)
  • TABLE 228 ASIA PACIFIC: LAB AUTOMATION MARKET FOR DIAGNOSTICS, BY TYPE, 2023–2030 (USD MILLION)
  • TABLE 229 ASIA PACIFIC: LAB AUTOMATION MARKET, BY END USER, 2023–2030 (USD MILLION)
  • TABLE 230 CHINA: LAB AUTOMATION MARKET, BY PRODUCT, 2023–2030 (USD MILLION)
  • TABLE 231 CHINA: AUTOMATED WORKSTATIONS MARKET, BY TYPE,2023–2030 (USD MILLION)
  • TABLE 232 CHINA: OFF-THE-SHELF AUTOMATED WORK CELLS MARKET, BY TYPE, 2023–2030 (USD MILLION)
  • TABLE 233 CHINA: ROBOTIC SYSTEMS MARKET, BY TYPE, 2023–2030 (USD MILLION)
  • TABLE 234 CHINA: LAB AUTOMATION SOFTWARE MARKET, BY TYPE, 2023–2030 (USD MILLION)
  • TABLE 235 JAPAN: LAB AUTOMATION MARKET, BY PRODUCT, 2023–2030 (USD MILLION)
  • TABLE 236 JAPAN: AUTOMATED WORKSTATIONS MARKET, BY TYPE, 2023–2030 (USD MILLION)
  • TABLE 237 JAPAN: OFF-THE-SHELF AUTOMATED WORK CELLS MARKET, BY TYPE, 2023–2030 (USD MILLION)
  • TABLE 238 JAPAN: ROBOTIC SYSTEMS MARKET, BY TYPE, 2023–2030 (USD MILLION)
  • TABLE 239 JAPAN: LAB AUTOMATION SOFTWARE MARKET, BY TYPE, 2023–2030 (USD MILLION)
  • TABLE 240 INDIA: LAB AUTOMATION MARKET, BY PRODUCT, 2023–2030 (USD MILLION)
  • TABLE 241 INDIA: AUTOMATED WORKSTATIONS MARKET, BY TYPE, 2023–2030 (USD MILLION)
  • TABLE 242 INDIA: OFF-THE-SHELF AUTOMATED WORK CELLS MARKET, BY TYPE, 2023–2030 (USD MILLION)
  • TABLE 243 INDIA: ROBOTIC SYSTEMS MARKET, BY TYPE, 2023–2030 (USD MILLION)
  • TABLE 244 INDIA: LAB AUTOMATION SOFTWARE MARKET, BY TYPE, 2023–2030 (USD MILLION)
  • TABLE 245 AUSTRALIA: LAB AUTOMATION MARKET, BY PRODUCT, 2023–2030 (USD MILLION)
  • TABLE 246 AUSTRALIA: AUTOMATED WORKSTATIONS MARKET, BY TYPE, 2023–2030 (USD MILLION)
  • TABLE 247 AUSTRALIA: OFF-THE-SHELF AUTOMATED WORK CELLS MARKET, BY TYPE, 2023–2030 (USD MILLION)
  • TABLE 248 AUSTRALIA: ROBOTIC SYSTEMS MARKET, BY TYPE, 2023–2030 (USD MILLION)
  • TABLE 249 AUSTRALIA: LAB AUTOMATION SOFTWARE MARKET, BY TYPE, 2023–2030 (USD MILLION)
  • TABLE 250 SOUTH KOREA: LAB AUTOMATION MARKET, BY PRODUCT, 2023–2030 (USD MILLION)
  • TABLE 251 SOUTH KOREA: AUTOMATED WORKSTATIONS MARKET, BY TYPE, 2023–2030 (USD MILLION)
  • TABLE 252 SOUTH KOREA: OFF-THE-SHELF AUTOMATED WORK CELLS MARKET, BY TYPE, 2023–2030 (USD MILLION)
  • TABLE 253 SOUTH KOREA: ROBOTIC SYSTEMS MARKET, BY TYPE, 2023–2030 (USD MILLION)
  • TABLE 254 SOUTH KOREA: LAB AUTOMATION SOFTWARE MARKET, BY TYPE, 2023–2030 (USD MILLION)
  • TABLE 255 REST OF ASIA PACIFIC: LAB AUTOMATION MARKET, BY PRODUCT, 2023–2030 (USD MILLION)
  • TABLE 256 REST OF ASIA PACIFIC: AUTOMATED WORKSTATIONS MARKET, BY TYPE, 2023–2030 (USD MILLION)
  • TABLE 257 REST OF ASIA PACIFIC: OFF-THE-SHELF AUTOMATED WORK CELLS MARKET, BY TYPE, 2023–2030 (USD MILLION)
  • TABLE 258 REST OF ASIA PACIFIC: ROBOTIC SYSTEMS MARKET, BY TYPE, 2023–2030 (USD MILLION)
  • TABLE 259 REST OF ASIA PACIFIC: LAB AUTOMATION SOFTWARE MARKET, BY TYPE, 2023–2030 (USD MILLION)
  • TABLE 260 LATIN AMERICA: MACROECONOMIC OUTLOOK
  • TABLE 261 LATIN AMERICA: LAB AUTOMATION MARKET, BY COUNTRY, 2023–2030 (USD MILLION)
  • TABLE 262 LATIN AMERICA: LAB AUTOMATION MARKET, BY PRODUCT, 2023–2030 (USD MILLION)
  • TABLE 263 LATIN AMERICA: AUTOMATED WORKSTATIONS MARKET, BY TYPE, 2023–2030 (USD MILLION)
  • TABLE 264 LATIN AMERICA: AUTOMATED LIQUID HANDLING SYSTEMS MARKET, BY TYPE, 2023–2030 (USD MILLION)
  • TABLE 265 LATIN AMERICA: AUTOMATED MICROPLATE READERS MARKET, BY TYPE, 2023–2030 (USD MILLION)
  • TABLE 266 LATIN AMERICA: MULTI-MODE MICROPLATE READERS MARKET, BY TYPE, 2023–2030 (USD MILLION)
  • TABLE 267 LATIN AMERICA: SINGLE-MODE MICROPLATE READERS MARKET, BY TYPE, 2023–2030 (USD MILLION)
  • TABLE 268 LATIN AMERICA: OFF-THE-SHELF AUTOMATED WORK CELLS MARKET, BY TYPE, 2023–2030 (USD MILLION)
  • TABLE 269 LATIN AMERICA: ROBOTIC SYSTEMS MARKET, BY TYPE, 2023–2030 (USD MILLION)
  • TABLE 270 LATIN AMERICA: LAB AUTOMATION SOFTWARE MARKET, BY TYPE, 2023–2030 (USD MILLION)
  • TABLE 271 LATIN AMERICA: LAB AUTOMATION MARKET, BY APPLICATION, 2023–2030 (USD MILLION)
  • TABLE 272 LATIN AMERICA: LAB AUTOMATION MARKET FOR DRUG DISCOVERY, BY TYPE, 2023–2030 (USD MILLION)
  • TABLE 273 LATIN AMERICA: LAB AUTOMATION MARKET FOR DIAGNOSTICS, BY TYPE, 2023–2030 (USD MILLION)
  • TABLE 274 LATIN AMERICA: LAB AUTOMATION MARKET, BY END USER, 2023–2030 (USD MILLION)
  • TABLE 275 BRAZIL: LAB AUTOMATION MARKET, BY PRODUCT, 2023–2030 (USD MILLION)
  • TABLE 276 BRAZIL: AUTOMATED WORKSTATIONS MARKET, BY TYPE, 2023–2030 (USD MILLION)
  • TABLE 277 BRAZIL: OFF-THE-SHELF AUTOMATED WORK CELLS MARKET, BY TYPE, 2023–2030 (USD MILLION)
  • TABLE 278 BRAZIL: ROBOTIC SYSTEMS MARKET, BY TYPE, 2023–2030 (USD MILLION)
  • TABLE 279 BRAZIL: LAB AUTOMATION SOFTWARE MARKET, BY TYPE, 2023–2030 (USD MILLION)
  • TABLE 280 MEXICO: LAB AUTOMATION MARKET, BY PRODUCT, 2023–2030 (USD MILLION)
  • TABLE 281 MEXICO: AUTOMATED WORKSTATIONS MARKET, BY TYPE, 2023–2030 (USD MILLION)
  • TABLE 282 MEXICO: OFF-THE-SHELF AUTOMATED WORK CELLS MARKET, BY TYPE, 2023–2030 (USD MILLION)
  • TABLE 283 MEXICO: ROBOTIC SYSTEMS MARKET, BY TYPE, 2023–2030 (USD MILLION)
  • TABLE 284 MEXICO: LAB AUTOMATION SOFTWARE MARKET, BY TYPE, 2023–2030 (USD MILLION)
  • TABLE 285 REST OF LATIN AMERICA: LAB AUTOMATION MARKET, BY PRODUCT, 2023–2030 (USD MILLION)
  • TABLE 286 REST OF LATIN AMERICA: AUTOMATED WORKSTATIONS MARKET, BY TYPE, 2023–2030 (USD MILLION)
  • TABLE 287 REST OF LATIN AMERICA: OFF-THE-SHELF AUTOMATED WORK CELLS MARKET, BY TYPE, 2023–2030 (USD MILLION)
  • TABLE 288 REST OF LATIN AMERICA: ROBOTIC SYSTEMS MARKET, BY TYPE, 2023–2030 (USD MILLION)
  • TABLE 289 REST OF LATIN AMERICA: LAB AUTOMATION SOFTWARE MARKET, BY TYPE, 2023–2030 (USD MILLION)
  • TABLE 290 MIDDLE EAST & AFRICA: MACROECONOMIC OUTLOOK
  • TABLE 291 MIDDLE EAST & AFRICA: LAB AUTOMATION MARKET, BY REGION, 2023–2030 (USD MILLION)
  • TABLE 292 MIDDLE EAST & AFRICA: LAB AUTOMATION MARKET, BY PRODUCT, 2023–2030 (USD MILLION)
  • TABLE 293 MIDDLE EAST & AFRICA: AUTOMATED WORKSTATIONS MARKET, BY TYPE, 2023–2030 (USD MILLION)
  • TABLE 294 MIDDLE EAST & AFRICA: AUTOMATED LIQUID HANDLING SYSTEMS MARKET, BY TYPE, 2023–2030 (USD MILLION)
  • TABLE 295 MIDDLE EAST & AFRICA: AUTOMATED MICROPLATE READERS MARKET, BY TYPE, 2023–2030 (USD MILLION)
  • TABLE 296 MIDDLE EAST & AFRICA: MULTI-MODE MICROPLATE READERS MARKET, BY TYPE, 2023–2030 (USD MILLION)
  • TABLE 297 MIDDLE EAST & AFRICA: SINGLE-MODE MICROPLATE READERS MARKET, BY TYPE, 2023–2030 (USD MILLION)
  • TABLE 298 MIDDLE EAST & AFRICA: OFF-THE-SHELF AUTOMATED WORK CELLS MARKET, BY TYPE, 2023–2030 (USD MILLION)
  • TABLE 299 MIDDLE EAST & AFRICA: ROBOTIC SYSTEMS MARKET, BY TYPE, 2023–2030 (USD MILLION)
  • TABLE 300 MIDDLE EAST & AFRICA: LAB AUTOMATION SOFTWARE MARKET, BY TYPE, 2023–2030 (USD MILLION)
  • TABLE 301 MIDDLE EAST & AFRICA: LAB AUTOMATION MARKET, BY APPLICATION, 2023–2030 (USD MILLION)
  • TABLE 302 MIDDLE EAST & AFRICA: LAB AUTOMATION MARKET FOR DRUG DISCOVERY,BY TYPE, 2023–2030 (USD MILLION)
  • TABLE 303 MIDDLE EAST & AFRICA: LAB AUTOMATION MARKET FOR DIAGNOSTICS, BY TYPE, 2023–2030 (USD MILLION)
  • TABLE 304 MIDDLE EAST & AFRICA: LAB AUTOMATION MARKET, BY END USER, 2023–2030 (USD MILLION)
  • TABLE 305 GCC COUNTRIES: LAB AUTOMATION MARKET, BY PRODUCT, 2023–2030 (USD MILLION)
  • TABLE 306 GCC COUNTRIES: AUTOMATED WORKSTATIONS MARKET, BY TYPE, 2023–2030 (USD MILLION)
  • TABLE 307 GCC COUNTRIES: OFF-THE-SHELF AUTOMATED WORK CELLS MARKET, BY TYPE, 2023–2030 (USD MILLION)
  • TABLE 308 GCC COUNTRIES: ROBOTIC SYSTEMS MARKET, BY TYPE, 2023–2030 (USD MILLION)
  • TABLE 309 GCC COUNTRIES: LAB AUTOMATION SOFTWARE MARKET, BY TYPE, 2023–2030 (USD MILLION)
  • TABLE 310 REST OF MIDDLE EAST & AFRICA: LAB AUTOMATION MARKET, BY PRODUCT, 2023–2030 (USD MILLION)
  • TABLE 311 REST OF MIDDLE EAST & AFRICA: AUTOMATED WORKSTATIONS MARKET, BY TYPE, 2023–2030 (USD MILLION)
  • TABLE 312 REST OF MIDDLE EAST & AFRICA: OFF-THE-SHELF AUTOMATED WORK CELLS MARKET, BY TYPE, 2023–2030 (USD MILLION)
  • TABLE 313 REST OF MIDDLE EAST & AFRICA: ROBOTIC SYSTEMS MARKET, BY TYPE, 2023–2030 (USD MILLION)
  • TABLE 314 REST OF MIDDLE EAST & AFRICA: LAB AUTOMATION SOFTWARE MARKET, BY TYPE, 2023–2030 (USD MILLION)
  • TABLE 315 OVERVIEW OF STRATEGIES ADOPTED BY PLAYERS IN LAB AUTOMATION MARKET
  • TABLE 316 LAB AUTOMATION MARKET: DEGREE OF COMPETITION
  • TABLE 317 LAB AUTOMATION MARKET: REGION FOOTPRINT, 2023
  • TABLE 318 LAB AUTOMATION MARKET: PRODUCT FOOTPRINT, 2023
  • TABLE 319 LAB AUTOMATION MARKET: APPLICATION FOOTPRINT, 2023
  • TABLE 320 LAB AUTOMATION MARKET: END USER FOOTPRINT, 2023
  • TABLE 321 LAB AUTOMATION MARKET: DETAILED LIST OF KEY STARTUPS/SMES, 2024
  • TABLE 322 LAB AUTOMATION MARKET: COMPETITIVE BENCHMARKING OF EMERGING PLAYERS/STARTUPS, BY PRODUCT
  • TABLE 323 LAB AUTOMATION MARKET: COMPETITIVE BENCHMARKING OF EMERGING PLAYERS/STARTUPS, BY REGION
  • TABLE 324 LAB AUTOMATION MARKET: PRODUCT LAUNCHES AND APPROVALS, JANUARY 2021–NOVEMBER 2024
  • TABLE 325 LAB AUTOMATION MARKET: DEALS, JANUARY 2021–NOVEMBER 2024
  • TABLE 326 THERMO FISHER SCIENTIFIC INC.: COMPANY OVERVIEW
  • TABLE 327 THERMO FISHER SCIENTIFIC INC.: PRODUCTS OFFERED
  • TABLE 328 THERMO FISHER SCIENTIFIC INC.: PRODUCT LAUNCHES AND APPROVALS
  • TABLE 329 THERMO FISHER SCIENTIFIC INC: DEALS
  • TABLE 330 THERMO FISHER SCIENTIFIC INC.: EXPANSIONS
  • TABLE 331 TECAN TRADING AG: COMPANY OVERVIEW
  • TABLE 332 TECAN TRADING AG: PRODUCTS OFFERED
  • TABLE 333 TECAN TRADING AG: PRODUCT LAUNCHES
  • TABLE 334 TECAN TRADING AG: DEALS
  • TABLE 335 DANAHER CORPORATION: COMPANY OVERVIEW
  • TABLE 336 DANAHER CORPORATION: PRODUCTS OFFERED
  • TABLE 337 DANAHER CORPORATION: DEALS
  • TABLE 338 AGILENT TECHNOLOGIES: COMPANY OVERVIEW
  • TABLE 339 AGILENT TECHNOLOGIES: PRODUCTS OFFERED
  • TABLE 340 AGILENT TECHNOLOGIES: PRODUCT LAUNCHES AND APPROVALS
  • TABLE 341 AGILENT TECHNOLOGIES: DEALS
  • TABLE 342 AGILENT TECHNOLOGIES: EXPANSIONS
  • TABLE 343 F. HOFFMANN-LA ROCHE LTD.: COMPANY OVERVIEW
  • TABLE 344 F. HOFFMANN-LA ROCHE LTD.: PRODUCTS OFFERED
  • TABLE 345 F. HOFFMANN-LA ROCHE LTD.: PRODUCT LAUNCHES AND APPROVALS, JANUARY 2021–APRIL 2025
  • TABLE 346 F. HOFFMANN-LA ROCHE LTD.: DEALS, JANUARY 2021–OCTOBER 2024
  • TABLE 347 F. HOFFMANN-LA ROCHE LTD.: EXPANSIONS
  • TABLE 348 METTLER TOLEDO: COMPANY OVERVIEW
  • TABLE 349 METTLER TOLEDO: PRODUCTS OFFERED
  • TABLE 350 METTLER TOLEDO: PRODUCT LAUNCHES AND APPROVALS
  • TABLE 351 METTLER TOLEDO: DEALS, JANUARY 2021–OCTOBER 2024
  • TABLE 352 REVVITY INC.: COMPANY OVERVIEW
  • TABLE 353 REVVITY INC.: PRODUCTS OFFERED
  • TABLE 354 REVVITY, INC.: PRODUCT LAUNCHES AND APPROVALS
  • TABLE 355 REVVITY, INC.: DEALS
  • TABLE 356 EPPENDORF AG: COMPANY OVERVIEW
  • TABLE 357 EPPENDORF AG: PRODUCTS OFFERED
  • TABLE 358 EPPENDORF AG: PRODUCT LAUNCHES
  • TABLE 359 EPPENDORF AG: DEALS
  • TABLE 360 BECTON, DICKINSON AND COMPANY: COMPANY OVERVIEW
  • TABLE 361 BECTON, DICKINSON AND COMPANY: PRODUCTS OFFERED
  • TABLE 362 BECTON, DICKINSON AND COMPANY: PRODUCT LAUNCHES AND APPROVALS
  • TABLE 363 BECTON, DICKINSON AND COMPANY: DEALS
  • TABLE 364 BECTON, DICKINSON AND COMPANY: EXPANSIONS
  • TABLE 365 WATERS CORPORATION: COMPANY OVERVIEW
  • TABLE 366 WATERS CORPORATION: PRODUCTS OFFERED
  • TABLE 367 WATERS CORPORATION: DEALS
  • TABLE 368 WATERS CORPORATION: EXPANSIONS
  • TABLE 369 SIEMENS HEALTHINEERS: COMPANY OVERVIEW
  • TABLE 370 SIEMENS HEALTHINEERS: PRODUCTS OFFERED
  • TABLE 371 SIEMENS HEALTHINEERS: PRODUCT LAUNCHES AND APPROVALS
  • TABLE 372 SIEMENS HEALTHINEERS: EXPANSIONS
  • TABLE 373 ABBOTT LABORATORIES: COMPANY OVERVIEW
  • TABLE 374 ABBOTT LABORATORIES: PRODUCTS OFFERED
  • TABLE 375 BIOMÉRIEUX: COMPANY OVERVIEW
  • TABLE 376 BIOMÉRIEUX: PRODUCTS OFFERED
  • TABLE 377 HAMILTON COMPANY: COMPANY OVERVIEW
  • TABLE 378 HAMILTON COMPANY: PRODUCTS OFFERED
  • TABLE 379 HAMILTON COMPANY: PRODUCT LAUNCHES AND APPROVALS
  • TABLE 380 HAMILTON COMPANY: DEALS
  • TABLE 381 HUDSON ROBOTICS: COMPANY OVERVIEW
  • TABLE 382 HUDSON ROBOTICS: PRODUCTS OFFERED
  • TABLE 383 HUDSON ROBOTICS: DEALS
  • TABLE 384 GILSON, INC : COMPANY OVERVIEW
  • TABLE 385 BMG LABTECH : COMPANY OVERVIEW
  • TABLE 386 FESTO AG & CO. KG: COMPANY OVERVIEW
  • TABLE 387 AURORA BIOMED INC : COMPANY OVERVIEW
  • TABLE 388 HIGHRES BIOSOLUTIONS : COMPANY OVERVIEW
  • TABLE 389 OPENTRONS LABWORKS INC. : COMPANY OVERVIEW
  • TABLE 390 PEAK ANALYSIS AND AUTOMATION: COMPANY OVERVIEW
  • TABLE 391 QIAGEN N.V.: COMPANY OVERVIEW
  • TABLE 392 LABVANTAGE SOLUTIONS, INC: COMPANY OVERVIEW
  • TABLE 393 BIO-RAD LABORATORIES, INC: COMPANY OVERVIEW
  • TABLE 394 LABWARE: COMPANY OVERVIEW
  • TABLE 395 SYSMEX CORPORATION: COMPANY OVERVIEW
  • TABLE 396 UNIVERSAL ROBOTS: COMPANY OVERVIEW
  • TABLE 397 AB CONTROLS, INC.: COMPANY OVERVIEW
  • TABLE 398 AUTOMATA: COMPANY OVERVIEW
  • TABLE 399 SPT LABTECH: COMPANY OVERVIEW
  • TABLE 400 BIOSERO, INC.: COMPANY OVERVIEW
LIST OF FIGURES
 
  • FIGURE 1 LAB AUTOMATION MARKET SEGMENTATION
  • FIGURE 2 LAB AUTOMATION MARKET: RESEARCH DESIGN
  • FIGURE 3 BREAKDOWN OF PRIMARY INTERVIEWS: SUPPLY-SIDE AND DEMAND-SIDE PARTICIPANTS
  • FIGURE 4 BREAKDOWN OF PRIMARY INTERVIEWS: BY COMPANY TYPE, DESIGNATION, AND REGION
  • FIGURE 5 RESEARCH METHODOLOGY: HYPOTHESIS BUILDING
  • FIGURE 6 LAB AUTOMATION MARKET SIZE ESTIMATION: APPROACH 1 (COMPANY REVENUE ESTIMATION)
  • FIGURE 7 AUTOMATION MARKET SIZE ESTIMATION: BOTTOM-UP APPROACH
  • FIGURE 8 TOP-DOWN APPROACH
  • FIGURE 9 DATA TRIANGULATION
  • FIGURE 10 LAB AUTOMATION MARKET, BY PRODUCT, 2025 VS. 2030 (USD MILLION)
  • FIGURE 11 LAB AUTOMATION MARKET, BY END USER, 2025 VS. 2030 (USD MILLION)
  • FIGURE 12 GEOGRAPHICAL SNAPSHOT OF LAB AUTOMATION MARKET
  • FIGURE 13 RISE IN DEMAND FOR HIGH-THROUGHPUT AND EFFICIENT TESTING TO DRIVE MARKET
  • FIGURE 14 NORTH AMERICA TO CONTINUE TO LEAD MARKET DESPITE HIGH ASIA PACIFIC CAGR
  • FIGURE 15 CHINA AND HOSPITALS LED IN ASIA PACIFIC MARKET IN 2024
  • FIGURE 16 CHINA TO REGISTER HIGHEST GROWTH DURING FORECAST PERIOD
  • FIGURE 17 LAB AUTOMATION MARKET: DRIVERS, RESTRAINTS, OPPORTUNITIES, AND CHALLENGES
  • FIGURE 18 MQTT'S CENTRAL ROLE IN COORDINATING COMMUNICATIONS BETWEEN DATA ACQUISITION MODULES AND USER INTERFACES
  • FIGURE 19 TRANSFORMING LABS WITH DIGITAL TWINS
  • FIGURE 20 LAB AUTOMATION MARKET: SUPPLY CHAIN ANALYSIS
  • FIGURE 21 LABORATORY AUTOMATION MARKET: VALUE CHAIN ANALYSIS
  • FIGURE 22 LAB AUTOMATION MARKET: PORTER'S FIVE FORCES ANALYSIS
  • FIGURE 23 INFLUENCE OF KEY STAKEHOLDERS ON BUYING PROCESS
  • FIGURE 24 KEY BUYING CRITERIA FOR TOP FOUR END USERS
  • FIGURE 25 PATENT ANALYSIS FOR LAB AUTOMATION, JANUARY 2015–APRIL 2025
  • FIGURE 26 LAB AUTOMATION MARKET: IMPORT DATA (HS CODE 8479)
  • FIGURE 27 LAB AUTOMATION MARKET: EXPORT DATA (HS CODE 8479)
  • FIGURE 28 LAB AUTOMATION MARKET: ECOSYSTEM ANALYSIS
  • FIGURE 29 LAB AUTOMATION MARKET: TRENDS/DISRUPTIONS IMPACTING CUSTOMER BUSINESS
  • FIGURE 30 INVESTMENT AND FUNDING SCENARIO, 2018–2024 (USD MILLION)
  • FIGURE 31 NUMBER OF INVESTOR DEALS, BY KEY PLAYER, 2019–2023
  • FIGURE 32 DEAL VALUE OF INVESTMENT, BY KEY PLAYER, 2019–2023 (USD MILLION)
  • FIGURE 33 AVERAGE SELLING PRICE TREND OF PRODUCTS BY REGION, 2021–2024 (USD)
  • FIGURE 34 AVERAGE SELLING PRICE OF ROBOTIC ARMS, BY KEY PLAYER, 2024 (USD THOUSAND)
  • FIGURE 35 NORTH AMERICA: LAB AUTOMATION MARKET SNAPSHOT
  • FIGURE 36 ASIA PACIFIC: LAB AUTOMATION MARKET SNAPSHOT
  • FIGURE 37 REVENUE ANALYSIS OF KEY PLAYERS IN LAB AUTOMATION MARKET, 2020–2023 (USD BILLION)
  • FIGURE 38 MARKET SHARE ANALYSIS OF KEY PLAYERS IN LAB AUTOMATION MARKET, 2023
  • FIGURE 39 RANKING OF KEY PLAYERS IN LAB AUTOMATION MARKET, 2023
  • FIGURE 40 LAB AUTOMATION MARKET: COMPANY EVALUATION MATRIX (KEY PLAYERS)
  • FIGURE 41 LAB AUTOMATION MARKET: COMPANY FOOTPRINT, 2024
  • FIGURE 42 LAB AUTOMATION MARKET: COMPANY EVALUATION MATRIX (STARTUPS/SMES), 2024
  • FIGURE 43 EV/EBITDA OF KEY VENDORS, 2024
  • FIGURE 44 5-YEAR STOCK BETA OF KEY VENDORS, 2024
  • FIGURE 45 LAB AUTOMATION MARKET: BRAND/PRODUCT COMPARATIVE ANALYSIS
  • FIGURE 46 THERMO FISHER SCIENTIFIC: COMPANY SNAPSHOT, 2023
  • FIGURE 47 TECAN TRADING AG: COMPANY SNAPSHOT, 2024
  • FIGURE 48 DANAHER CORPORATION: COMPANY SNAPSHOT, 2024
  • FIGURE 49 AGILENT TECHNOLOGIES: COMPANY SNAPSHOT, 2024
  • FIGURE 50 F. HOFFMANN-LA ROCHE LTD.: COMPANY SNAPSHOT, 2024
  • FIGURE 51 METTLER TOLEDO: COMPANY SNAPSHOT, 2023
  • FIGURE 52 REVVITY, INC.: COMPANY SNAPSHOT, 2024
  • FIGURE 53 EPPENDORF AG: COMPANY SNAPSHOT, 2023
  • FIGURE 54 BECTON, DICKINSON, AND COMPANY: COMPANY SNAPSHOT, 2024
  • FIGURE 55 WATERS CORPORATION: COMPANY SNAPSHOT, 2023
  • FIGURE 56 SIEMENS HEALTHINEERS: COMPANY SNAPSHOT, 2024
  • FIGURE 57 ABBOTT LABORATORIES: COMPANY SNAPSHOT, 2024
  • FIGURE 58 BIOMÉRIEUX: COMPANY SNAPSHOT, 2023

The lab automation market sizing was based on four primary studies to ensure accuracy. Secondary research provided the initial data from the lab automation market and related sectors, which was gathered from 3-5 sources. This information was validated through primary research to confirm the assumptions and market sizing. Both top-down and bottom-up approaches were used to determine the overall market size, which was then refined into segment and subsegment sizes. Finally, data triangulation was performed to ensure the accuracy of the findings.

Secondary Research

Secondary research sources included directories, Factiva, white papers, Bloomberg Businessweek, annual reports, SEC filings, business filings, and investor presentations. These sources provided valuable insights into market leaders, sector divisions, and technological differences within various segments of the lab automation industry.

Primary Research

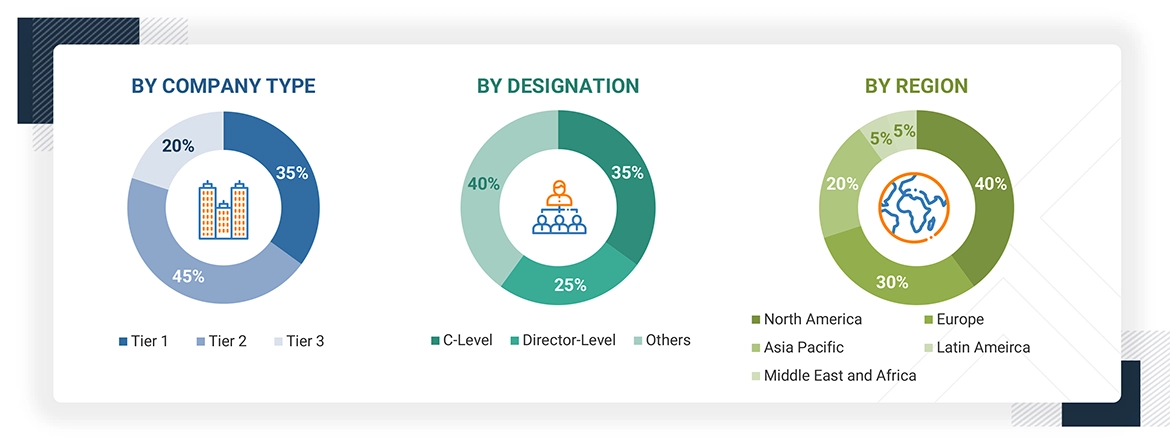
Primary research included both, quantitative and qualitative insights gathered through interviews with key stakeholders. On the demand side, participants comprised physicians, researchers, department heads, and staff from diagnostic centers, hospitals, and research institutes. On the supply side, interviews were conducted with CEOs, area sales managers, territory and regional sales managers, and other top executives from relevant companies. These direct conversations helped validate the findings from secondary research and allowed assumptions to be directly questioned and confirmed.

A breakdown of the primary respondents is provided below.
Lab Automation Market

Note: Others include sales managers, marketing managers, business development managers, product managers, distributors, and suppliers.

Note: Companies are classified into tiers based on their total revenue. As of 2023, Tier 1 = >USD 1 billion, Tier 2 = < USD 500 million, and Tier 3 = < USD 100 million.

To know about the assumptions considered for the study, download the pdf brochure

Market Size Estimation

The revenue share analysis of major companies was used in this report to assess the size of the global lab automation market. This analysis involved identifying key market participants and calculating their lab automation revenue based on a variety of data collected during the primary and secondary research phases. One component of the secondary research was examining the annual and financial reports of leading market players. In contrast, primary research included detailed interviews with significant thought leaders, such as directors, CEOs, and key marketing executives.

To determine the overall market value, the segmental revenue was calculated by mapping the revenue of the leading solution and service providers. The process involved several steps.

  • Making a list of leading international companies in lab automation industry
  • Charting annual profits made by leading companies in lab automation sector (or the closest stated business unit/product category)
  • 2024 revenue mapping of leading companies to cover a significant portion of global market
  • Calculating global value of lab automation industry

Global Lab Automation Market: Bottom-up and Top-down approach

Lab Automation Market

Data Triangulation

To ensure accurate data, the lab automation market was divided into various segments and subsegments. A data triangulation process that used both top-down and bottom-up approaches was applied. This involved analyzing factors and trends from both, the demand and supply sides to validate the findings for each segment. The combination of this segmentation with the triangulation process helps ensure that the market data is both accurate and reliable.

Market Definition

The lab automation market includes a variety of solutions designed to improve efficiency, productivity, and accuracy in laboratories. This market encompasses automated workstations, ready-to-use automated work cells, robotics, automated storage and retrieval systems, and software. These technologies streamline various laboratory processes, making complex operations, data collection, and repetitive tasks easier to manage. Key applications for lab automation solutions are found in drug discovery, diagnostics, proteomics, genomics, microbiology, and other fields, particularly within life sciences, academic institutions, diagnostics, and pharmaceutical research.

Stakeholders

  • Lab automation solution manufacturers, suppliers, and providers
  • Lab automation equipment and software solution providers
  • Lab automation integrated solution providers
  • Academic institutions and private research institutions
  • Environmental testing laboratories
  • Food & beverage testing centers
  • Hospitals and diagnostic centers
  • Forensic laboratories
  • CROs and CDMOs
  • Pharmaceutical & biopharmaceutical companies
  • Consulting firms

Report Objectives

  • To define, describe, and forecast the lab automation market based on product, application, end user, and region
  • To provide detailed information regarding the major factors influencing the growth of the market (drivers, restraints, opportunities, and industry-specific challenges)
  • To strategically analyze micromarkets with respect to individual growth trends, prospects, and contributions to the total market
  • To analyze opportunities in the market for stakeholders and provide details of the competitive landscape for market leaders
  • To forecast the revenue of the market segments with respect to five regions: North America, Europe, the Asia Pacific, Latin America, and the Middle East & Africa
  • To profile the key players and comprehensively analyze their market ranking and core competencies
  • To benchmark players within the market using a proprietary competitive leadership mapping framework, which analyzes market players on various parameters within the broad categories of business strategy excellence and strength of product portfolio
  • To analyze competitive developments such as product launches, agreements, expansions, collaborations, and acquisitions in the lab automation market

Previous Versions of this Report

Lab Automation Market by Product (Robotic Arm, Microplate Readers, Workstation, LIMS, ELN), Application (Drug Discovery, Diagnostics, Genomics, Proteomics, Microbiology), End-User (Pharma, Diagnolab, Forensics, Environmental) - Global Forecast to 2028

Report Code AST 5764
Published in Feb, 2023, By MarketsandMarkets™

Lab Automation Market by Product (Robotic Arm, Microplate Readers, Workstation, LIMS, ELN), Application (Drug Discovery, Diagnostics, Genomics, Proteomics, Microbiology), End-User (Pharma, Diagnolab, Forensics, Environmental) - Global Forecast to 2025

Report Code AST 5764
Published in Nov, 2020, By MarketsandMarkets™

Lab Automation Market by Equipment and Software (Robotic Arms, Microplate Readers, LIMS), Applications (Drug Discovery, Clinical Diagnostics, Genomics), End Users (Biotechnology and Pharmaceuticals, Diagnostic Labs) - Global Forecast to 2022

Report Code MD 3365
Published in Nov, 2017, By MarketsandMarkets™

Lab Automation Market by Equipment & Software (Robotic Arm, Microplate Readers, LIMS), Applications (Drug Discovery, Clinical Diagnostics), Type (Modular, Total Lab), & End Users (Biotechnology & Pharmaceuticals, Private Labs) - Global Forecasts to 2021

Report Code MD 3365
Published in Oct, 2016, By MarketsandMarkets™

Lab Automation Market by Equipment & Software (Robotic Arm, Microplate Readers, LIMS), Applications (Drug Discovery, Clinical Diagnostics), Type of Automation (Modular, Total Lab), & End Users (Biotechnology & Pharmaceuticals) - Global Forecasts to 2020

Report Code MD 3365
Published in Apr, 2015, By MarketsandMarkets™

Lab Automation Market by Equipment & Software (Robotic Arm, Microplate Readers, LIMS), Applications (Drug Discovery, Clinical Diagnostics), Type of Automation (Modular, Total Lab), & End Users (Biotechnology & Pharmaceuticals) - Global Forecasts to 2020

Report Code MD 3365
Published in Jan, 2011, By MarketsandMarkets™
"Our USP is "providing game-changing business opportunities reports with free customization" - so please feel free to provide us with your specific areas of interest / business challenges in much greater detail !!"

We appreciate your interest in this report. Once you fill out the form, you'll be immediately directed to an exclusive solution tailored to your needs. This high-value offering can help boost your revenue by 30% - a must-see opportunity for anyone looking to maximize growth.


By clicking the "Submit" button, you are agreeing to the Terms of Use and Privacy Policy.

Custom Market Research Services

We Will Customise The Research For You, In Case The Report Listed Above Does Not Meet With Your Requirements

Get 10% Free Customisation

Growth opportunities and latent adjacency in Lab Automation Market

DMCA.com Protection Status