
LiDAR Market Size, Share & Trends

LiDAR Market Size, Share & Trends by Installation (Airborne, Ground-based), Type (Mechanical, Solid-state), Range (Short, Medium, Long), Service Aerial Surveying, Asset Management, GIS Services, Ground-based Surveying), Region - Global Forecast to 2030


LIDAR MARKET SIZE, SHARE & TRENDS
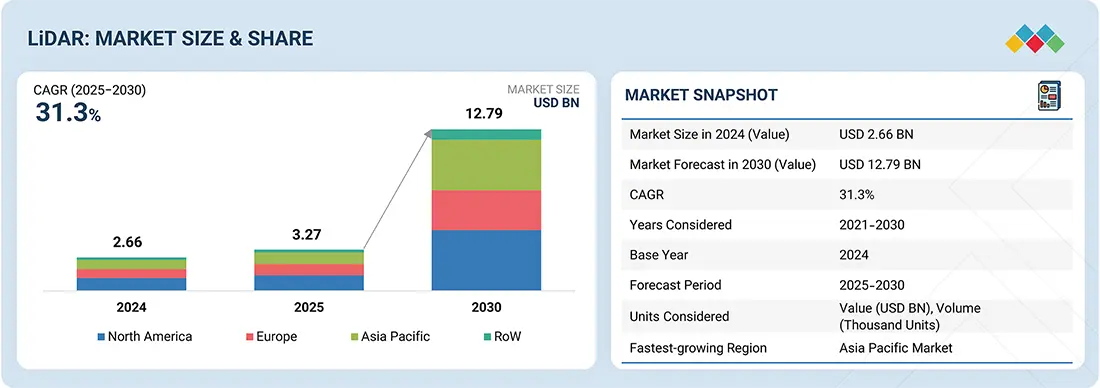
According to Marketsandmarkets, The global LiDAR market size was valued at USD 3.27 billion in 2025 and is projected to reach USD 12.79 billion by 2030, growing at a CAGR of 31.3%. from 2025 to 2030. . The LiDAR market is witnessing robust growth driven by rising adoption in autonomous vehicles, environmental mapping, and smart infrastructure projects. Segments such as automotive (ADAS), corridor mapping, and urban planning are positively influencing market expansion. Government initiatives supporting smart city development and investments in digital twin and 3D mapping technologies are fueling demand. Additionally, regulatory approvals for autonomous navigation and increased defense spending on surveillance systems are further accelerating LiDAR adoption.
MARKET SNAPSHOT TABLE
| REPORT METRIC | DETAILS |
|---|---|
| Market Size in 2025 (Value) | USD 3.27 Billion |
| Market Forecast in 2030 (Value) | USD 12.79 Billion |
| Growth Rate | CAGR of 31.3% from 2025–2030 |
| Years Considered | 2021–2030 |
| Base Year | 2024 |
| Forecast Period | 2025–2030 |
| Units Considered | Value (USD Billion), Volume (Thousand Units) |
| Report Coverage | Revenue forecast, company ranking, competitive landscape, growth |
| Top Companies |
|
| Growth Drivers |
|
| Segments Covered |
|
| Regions Covered | North America, Asia Pacific, Europe, and RoW |
Market Size & Forecast
• 2025 Market Size: USD 3.27 Billion
• 2030 Projected Market Size: USD 12.79 Billion
• CAGR (2025-2030): 31.3%
• Ground-based LiDAR : Larger Market Share
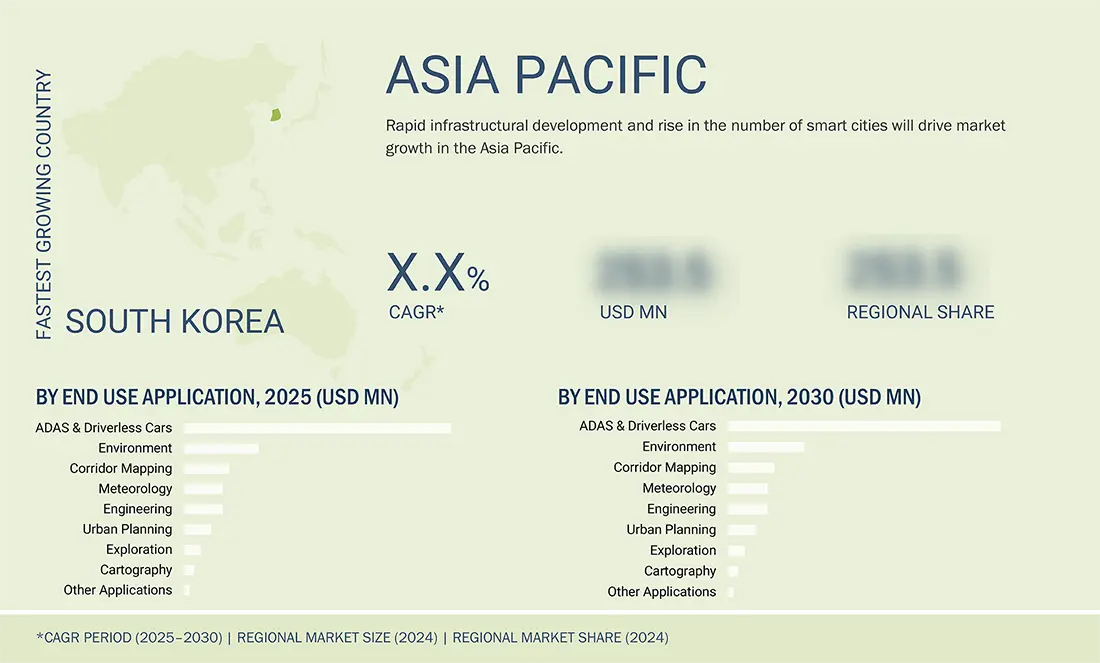
• Asia Pacific : Fastest growing market
LIDAR MARKET KEY TAKEAWAYS
-
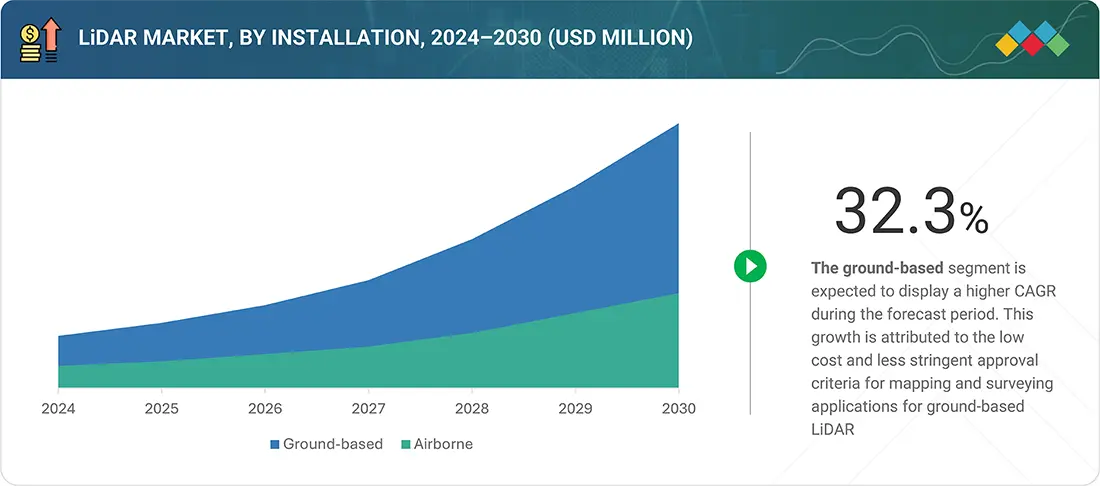
BY INSTALLATIONGround-based LiDAR holds a larger market share and is expected to grow faster than airborne LiDAR due to its lower cost and simpler approval requirements for mapping and surveying. Its increasing use in applications such as meteorology, corridor mapping, ADAS, and autonomous vehicles is driving this growth.
-
BY TYPEThe mechanical LiDAR segment dominated the market in 2024, driven by its extensive use in applications like corridor mapping, military, and engineering. Its wide field of view and long-range capability make it ideal for large-scale mapping, contributing to its larger market share.
-
BY RANGEThe short-range LiDAR segment is projected to lead the market due to its adoption in applications such as automobiles, security, and robotics
-
BY SERVICEAerial surveying is projected to dominate the LiDAR market, as it enables precise inspection of roads, railways, highways, and bridges using manned or unmanned systems like drones and aircraft. Its accuracy and wide adoption by government bodies further drive its market share.
-
BY END USE APPLICATIONThe ADAS & driverless cars segment is expected to lead the LiDAR market, driven by the adoption of solid-state LiDAR to enhance safety in autonomous vehicles. With major automakers like Mercedes-Benz, Volvo, NIO, and others launching L2–L4 models, rising demand for intelligent vehicles is accelerating LiDAR adoption and market growth.
-
BY REGIONLiDAR market in the Asia Pacific is projected to grow at the highest CAGR during the forecast period. This market's growth can be attributed to the increase in surveying and mapping operations due to the increasing infrastructural development, focus on forest management, and an increase in mining activities.
-
COMPETITIVE LANDSCAPEMajor vendors in the LiDAR market includes Hesai Group (China), RoboSense Technology Co., Ltd. (China), Sick AG (Germany), Ouster, Inc. (US), Luminar Technologies (US), Leica Geosystems AG (Sweden), Trimble Inc. (US), Teledyne Optech (Canada), FARO Technologies, Inc. (US) and RIEGL Laser Measurement Systems GmbH (Austria). Key strategies adopted by the players in the LiDAR market ecosystem to enhance their product portfolios, increase their market share, and expand their presence in the market mainly include new product launches and partnerships, and acquisitions.
Key drivers of the LiDAR industry include the rising adoption of autonomous vehicles and advanced driver assistance systems (ADAS) for safety and navigation. Increasing use of LiDAR in surveying, mapping, and smart city applications is boosting demand. Additionally, technological advancements leading to cost reduction and improved accuracy are further propelling market growth The LiDAR Market is experiencing remarkable growth as industries increasingly adopt advanced sensing technologies for precision mapping, autonomous vehicles, and smart infrastructure projects.
The LiDAR Market size is expanding rapidly, driven by rising demand in urban planning, environmental monitoring, and transportation sectors. Recent studies show that the LiDAR Market share is being captured by key players investing in high-resolution sensors, UAV integration, and next-generation software solutions. Current LiDAR Market trends indicate a shift toward lightweight, high-speed scanning systems and cloud-enabled data processing, which are enabling faster deployments and more efficient operations. Overall, the LiDAR Market growth is being supported by technological innovation and expanding applications across multiple sectors.
The LiDAR Industry is also seeing significant opportunities in geospatial intelligence and mapping applications. The LiDAR in mapping Market is gaining momentum as surveyors, urban planners, and infrastructure developers adopt LiDAR for accurate topographical analysis and 3D modeling. Regionally, the Europe LiDAR Market is emerging as a major hub due to strong smart city initiatives, government support, and high adoption of autonomous vehicle technologies. These factors collectively enhance the LiDAR Market growth, while continued investment in AI integration and edge computing is expected to further boost the LiDAR Market size and strengthen the LiDAR Market share globally.
Source: Secondary Research, Interviews with Experts, MarketsandMarkets Analysis
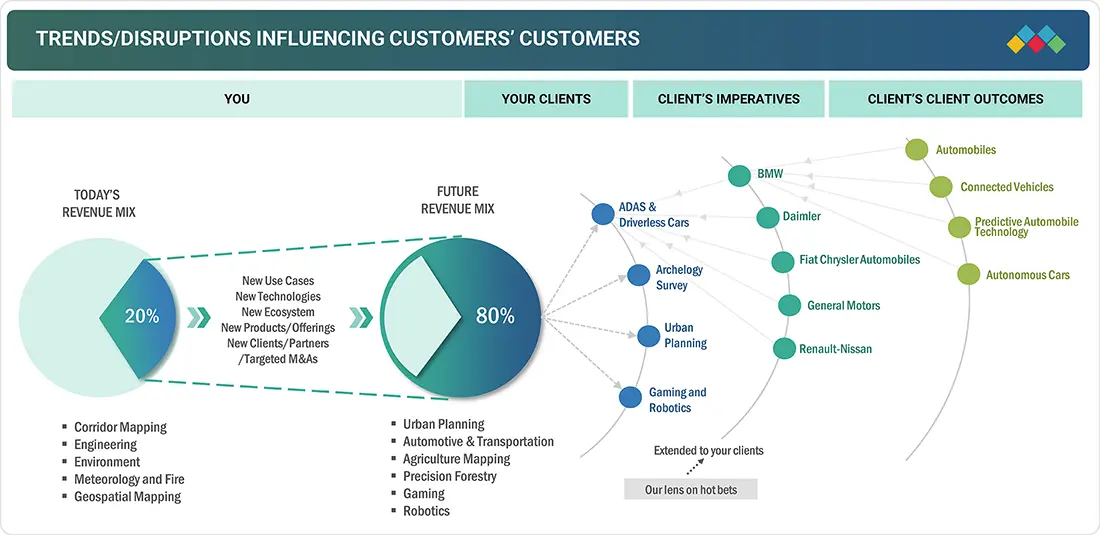
TRENDS & DISRUPTIONS IMPACTING CUSTOMERS' CUSTOMERS
The visual highlights how disruptive trends are reshaping customer business models, shifting revenue from traditional to emerging sources. Adopting mechanical LiDAR solutions in autonomous vehicles is expected to disrupt the LiDAR market in the coming years. LiDAR is currently being incorporated into advanced driver assistance systems to enhance the safety features of some semi-autonomous cars. Apart from this, the emergence of LiDAR technology has offered huge growth potential to a range of enterprises engaged in R&D and working toward introducing innovative solutions in the LiDAR market.
Source: Secondary Research, Interviews with Experts, MarketsandMarkets Analysis
MARKET DYNAMICS
Level
-
Rising adoption of UAV LiDAR systems to capture accurate evaluation data

-
Surging demand for 3D imaging solutions areas

Level
-
Availability of low-cost and lightweight alternatives

Level
-
Rising investments in ADAS systems by automotive giants

-
Increasing development of quantum dot detectors

Level
-
High cost of post-processing LiDAR software

-
Complexities related to miniaturized LiDAR sensing

Source: Secondary Research, Interviews with Experts, MarketsandMarkets Analysis
Driver: Rising adoption of UAV LiDAR systems to capture accurate evaluation data
LiDAR-based UAVs are increasingly used in surveying and mapping as they offer cost-effective, portable, and versatile solutions compared to manual methods. Mounted on drones, LiDAR systems enable accurate data collection in inaccessible or hazardous terrains, supporting applications in infrastructure, environmental monitoring, and corridor mapping. Their ability to create digital elevation models and 3D representations makes them vital for complex engineering and remote area surveys.
Restraint: Availability of low-cost and lightweight alternatives
The growth of the LiDAR market size is restrained by the availability of low-cost and lightweight photogrammetry systems for mapping and surveying. While LiDAR drones offer higher accuracy and faster data acquisition, they are far more expensive due to costly sensors and hardware. In contrast, photogrammetry systems provide easily interpretable, colored 2D/3D models at significantly lower costs, making them a more accessible alternative.
Opportunity: Rising investments in ADAS systems by automotive giants
LiDAR technology is expanding its role in automobiles beyond ADAS to applications like self-driving taxis, shuttles, and mobility-on-demand fleets managed by companies such as Uber and Lyft. Automakers, including Volkswagen, which signed a USD 4 billion deal with Innoviz in 2022—are investing heavily in LiDAR for advanced driver assistance and autonomous driving. Major car manufacturers worldwide, from BMW and Toyota to GM and Hyundai, are partnering with LiDAR providers like Cepton, Innoviz, Ouster, and Waymo to advance Level 2 and Level 3 automation.
Challenge: High cost of post-processing LiDAR software
LiDAR surveying remains costly compared to traditional methods, with systems priced around USD 75,000 and post-processing software adding another USD 20,000–30,000 per license. While prices are expected to decline with market competition, high costs limit adoption in small-scale projects. Additionally, limited availability, uncertain accuracy, and privacy restrictions on geospatial data in many countries pose challenges to LiDAR market growth.
LiDAR Market: COMMERCIAL USE CASES ACROSS INDUSTRIES
| COMPANY | USE CASE DESCRIPTION | BENEFITS |
|---|---|---|
|
|
LiDAR sensors for autonomous vehicles to enable safe navigation and object detection | Enhanced accuracy in obstacle detection, improved safety, reliable performance in diverse environments |
|
|
Long-range LiDAR systems for ADAS and self-driving applications | 250m+ detection range, high-resolution mapping, better night and adverse weather visibility |
Logos and trademarks shown above are the property of their respective owners. Their use here is for informational and illustrative purposes only.
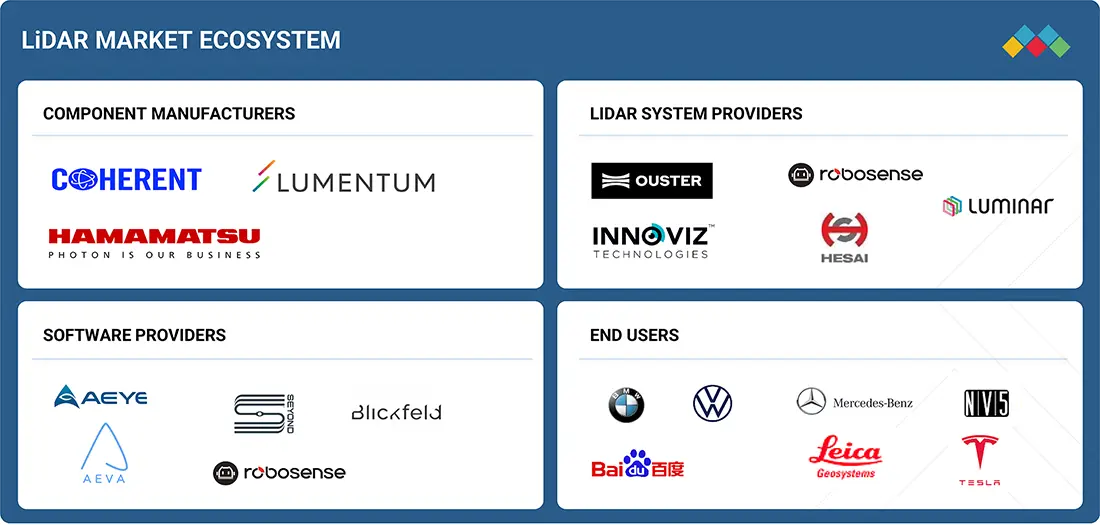
LIDAR MARKET ECOSYSTEM
The LiDAR market ecosystem consists of several key players, including component manufacturers like Coherent, Hamamatsu, and Lumentum, system providers such as Ouster, Innoviz, and Hesai, and software providers such as AEye and Robosense. These companies collectively develop and deliver the essential hardware, complete LiDAR systems, and intelligent software solutions that enable diverse applications. End-users from automotive industrial, and technology sectors, like BMW, Tesla, and Mercedes-Benz, drive adoption and innovation within this interconnected ecosystem.
Logos and trademarks shown above are the property of their respective owners. Their use here is for informational and illustrative purposes only.
LIDAR MARKET SEGMENTS
Source: Secondary Research, Interviews with Experts, MarketsandMarkets Analysis
LiDAR Market, By Installation
The market for ground-based LiDAR accounted for a larger market share and is projected to grow at a higher CAGR than the airborne LiDAR segment during the forecast period. This growth is attributed to the low cost and less stringent approval criteria for mapping and surveying applications for ground-based LiDAR. Moreover, the high adoption of ground-based LiDAR in various applications, such as environment, meteorology, corridor mapping, advanced driver-assistance systems (ADAS), and driverless cars, is expected to drive the market soon.
LiDAR Market, By Type
The mechanical LiDAR segment accounted for a larger market share in 2024. By type, the LiDAR market is expected to be driven by the mechanical segment due to the widespread use of mechanical LiDAR in various applications, such as corridor mapping, military, volumetric mapping, and engineering. This leads to the larger size of the mechanical LiDAR market. The main advantage of mechanical Lidar is its ability to cover a wide field of view. A single sensor can cover an area of several square kilometers with a single scan, making it ideal for large-scale mapping applications. Mechanical LiDAR sensors can operate over long distances, with ranges of up to several kilometers.
LiDAR Market, By Range
The short-range LiDAR segment is projected to lead the market due to its adoption in applications such as automobiles, security, and robotics. The market for medium-range LiDAR is projected to grow at the highest rate, driven by its use in engineering and construction applications.
LiDAR Market, By Service
Aerial surveying is expected to hold the largest share of the LiDAR market during the forecast period. These services are widely deployed to monitor any mishaps in areas such as roads, railways, highways, and bridges. This surveying method can provide accurate results when inspecting the site and can be done using manned or unmanned aerial systems, such as drones and aircraft. Government bodies generally conduct these services.
LiDAR Market, By End Use Application
The market for ADAS & driverless cars is projected to have largest market share during the forecast period. The rising adoption of solid-state LiDAR in ADAS & driverless cars for assuring safety is expected to boost the market. Moreover, automotive giants are adopting LiDAR systems for their Level 3 automated vehicles, positively impacting the sales of these vehicle types. Mercedes-Benz, Volvo, NIO, and Xiaopeng have successfully released several models with L3-level autonomous driving capability since 2021. BYD also signed a strategic cooperation agreement with RoboSense, and BAIC ARCFOX and Huawei also jointly launched new models of the L2-L4 class. With the increased demand for intelligent autonomous vehicles, the advantages of LiDAR products are becoming more evident, and their market is undergoing massive development.
REGION
Asia Pacific to be the fastest-growing region in the global LiDAR market during the forecast period
The LiDAR market in the Asia Pacific is projected to grow at the highest CAGR during the forecast period. This market's growth can be attributed to the increase in surveying and mapping operations resulting from growing infrastructural development, a focus on forest management, and rising mining activities. The increasing applications of airborne and ground-based LiDAR systems, along with the growing number of surveying and mapping activities, are expected to drive demand for LiDAR in the region.
The Europe LiDAR market is projected to reach USD 3.16 billion by 2030 from USD 0.87 billion in 2025, at a CAGR of 29.6% during the period from 2025 to 2030. The proliferation of LiDAR technology in Europe is attributable to the robust adoption of autonomous driving, smart mobility solutions, and advanced mapping initiatives endorsed by European Union regulations. Furthermore, the expanding range of applications in environmental monitoring, agriculture, and infrastructure planning is fostering increased deployment throughout the region.
The LiDAR market in North America is projected to reach USD 4.8 billion by 2030 from USD 1.25 billion in 2025, growing at a CAGR of 30.9% from 2025 to 2030. The regional market is primarily driven by the rising deployment of autonomous and ADAS-enabled vehicles, as automotive OEMs and technology companies increasingly integrate LiDAR through supply agreements and partnerships. For instance, Luminar’s production contracts with global automakers and Ouster’s collaborations with robotics and mobility players play a major role in market expansion in the region.
The Asia Pacific LiDAR market is projected to reach USD 4.01 billion by 2030 from USD 0.92 billion in 2025, at a CAGR of 34.1% from 2025 to 2030. Segments, such as automotive (ADAS), corridor mapping, and urban planning, positively influence the market expansion. Growth is further supported by rising investments in autonomous and electric vehicles, large-scale smart city and infrastructure development programs across China, Japan, and Southeast Asia, and increasing adoption of LiDAR in industrial automation, robotics, and drone-based surveying applications across the region.
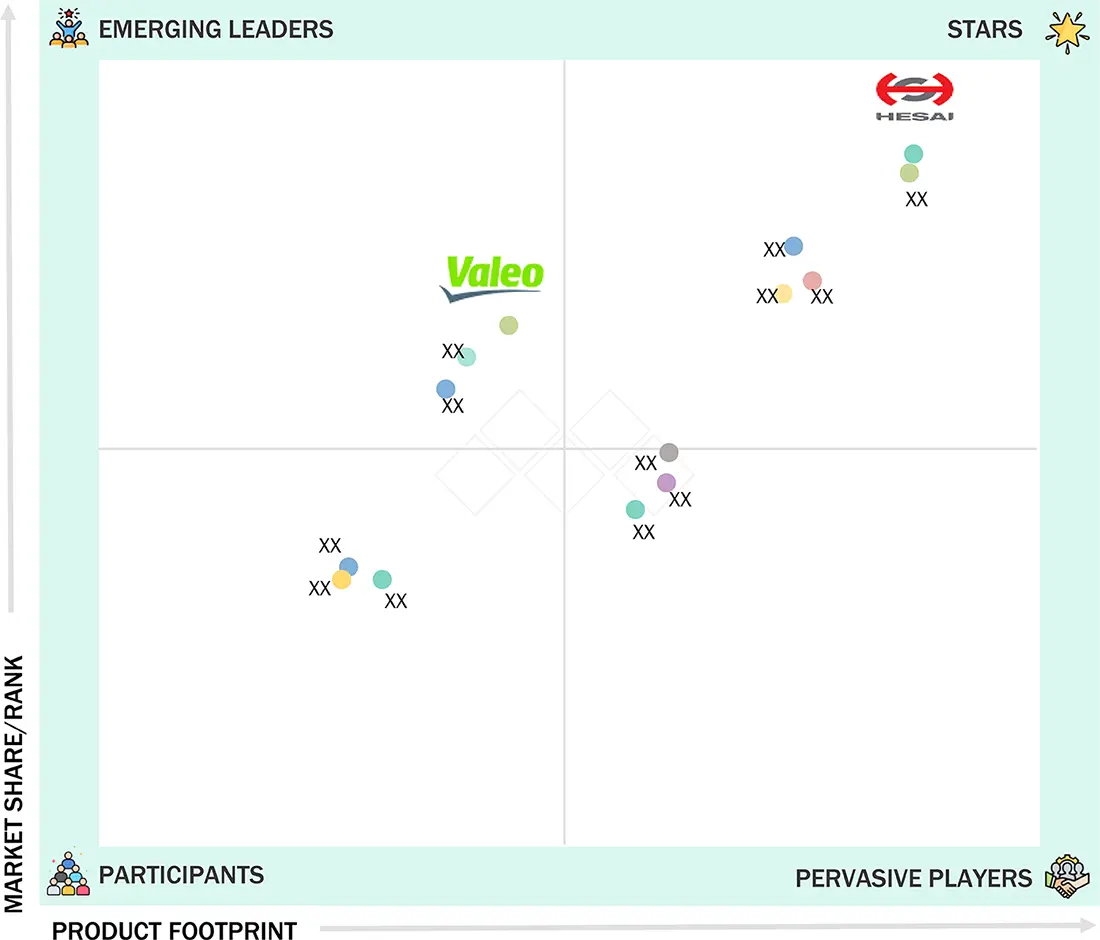
LiDAR Market: COMPANY EVALUATION MATRIX
Stars are the leading market players in new developments, such as product launches, innovative technologies, and the adoption of growth strategies. These players have a broad portfolio, innovative product offerings, and a global presence. They have well-established channels throughout the value chain. Hesai Group (China) comes under this category. Emerging Leaders demonstrate more substantial product innovations than their competitors. LiDAR Companies are investing more in R&D to launch several products in the market. A few players have a unique portfolio, while some have heavily invested in R&D or recently launched several products or innovative products. Valeo (France) comes under this category.
Source: Secondary Research, Interviews with Experts, MarketsandMarkets Analysis
KEY MARKET PLAYERS
- Hesai Group (China)
- RoboSense Technology Co., Ltd. (China)
- Sick AG (Germany)
- Ouster, Inc. (US)
- Luminar Technologies (US)
- Leica Geosystems AG (Sweden)
- Trimble Inc. (US)
- Teledyne Optech (Canada)
- FARO Technologies, Inc. (US)
- RIEGL Laser Measurement Systems GmbH(Austria)
- NV5 Geospatial (US)
- Beijing SureStar Technology Co., Ltd. (China)
- YellowScan (France)
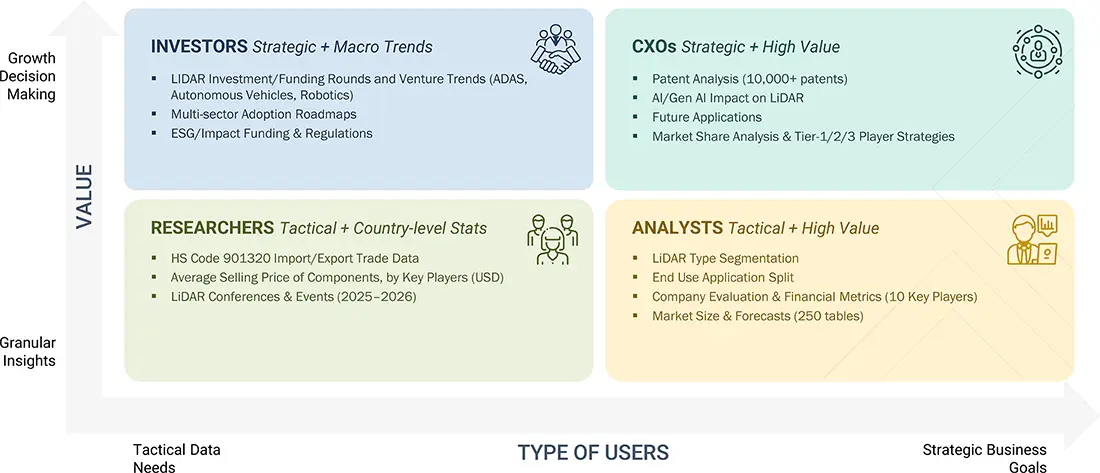
WHAT IS IN IT FOR YOU: LiDAR Market REPORT CONTENT GUIDE
DELIVERED CUSTOMIZATIONS
We have successfully delivered the following deep-dive customizations:
| CLIENT REQUEST | CUSTOMIZATION DELIVERED | VALUE ADDS |
|---|---|---|
| Automotive OEM | Competitive benchmarking of LiDAR suppliers (cost, range, resolution), Assessment of LiDAR integration in ADAS & autonomous driving,Forecast of adoption levels across L2–L4 automation | Enable strategic sourcing for autonomous vehicle programs, Identify leading suppliers for long-term partnerships,Support technology roadmap for advanced mobility solutions |
| Defense & Security Contractor | Evaluation of LiDAR for surveillance, terrain mapping, and autonomous military vehicles,Adoption analysis in major defense programs | Strengthen positioning in defense modernization initiatives,Support entry into government-funded LiDAR programs |
RECENT DEVELOPMENTS
- March 2025 : Ouster introduced an important new feature called 3D Zone Monitoring for its REV7 digital LiDAR sensor lineup (including OS0, OS1, and OSDome models). This feature allows the sensor to detect objects within customized 3D zones on-sensor and trigger real-time alerts or actions, significantly enhancing collision avoidance capabilities in applications such as warehouse automation and industrial robotics. This update is delivered via firmware and represents a step towards Ouster's push to become an autonomy company by expanding sensor usability and simplifying development for customers.
- February 2025 : Leica Geosystems, part of Hexagon, introduced the Leica CoastalMapper, a next-generation airborne bathymetric LiDAR system. With a wider field of view and higher altitude operation, coastal and river survey efficiency is boosted by 250% compared to previous models. This advanced solution supports diverse applications, including infrastructure monitoring, flood assessment, and environmental studies in both shallow and deep waters.
- September 2023 : Trimble Inc. introduced the new Trimble R580 Global Navigation Satellite System (GNSS) receiver, the next generation in its Trimble ProPoint GNSS positioning engine-enabled receiver portfolio. The system’s survey-grade GNSS performance enables professionals in surveying, mapping, Geographic Information System (GIS), civil construction, and utilities to quickly and easily capture centimeter-level positioning and boost productivity in the field.
- February 2022 : Hexagon AB’s Geosystems division announced a strategic partnership with LocLab, a 3D digital content creator, to accelerate the adoption of smart digital realities in transportation, construction, and urban planning.
- June 2021 : Teledyne Optech and Teledyne CARIS launched the next-generation bathymetric lidar, the CZMIL SuperNova. The SuperNova provided a range of inputs for climate change modeling and was ideal for inland water environments and base mapping for coastal zones and shorelines.
Table of Contents
 Exclusive indicates content/data unique to MarketsandMarkets and not available with any competitors.
Methodology
The study involved four major activities in estimating the size of the LiDAR market. Exhaustive secondary research was done to collect information on the market, peer market, and parent market. The next step was to validate these findings, assumptions, and sizing with industry experts across value chains through primary research. The bottom-up approach was employed to estimate the overall market size. After that, market breakdown and data triangulation were used to estimate the market size of segments and subsegments.
Secondary Research
In the secondary research process, various sources were used to identify and collect information important for this study. These include annual reports, press releases & investor presentations of companies, white papers, technology journals, and certified publications, articles by recognized authors, directories, and databases.
Secondary research was mainly used to obtain key information about the supply chain of the industry, the total pool of market players, classification of the market according to industry trends to the bottom-most level, regional markets, and key developments from the market and technology-oriented perspectives.
Primary research was also conducted to identify the segmentation types, key players, competitive landscape, and key market dynamics such as drivers, restraints, opportunities, challenges, and industry trends, along with key strategies adopted by players operating in the LiDAR market. Extensive qualitative and quantitative analyses were performed on the complete market engineering process to list key information and insights throughout the report.
Primary Research
Extensive primary research has been conducted after acquiring knowledge about the LiDAR market scenario through secondary research. Several primary interviews have been conducted with experts from both the demand (end users) and supply (LiDAR solution providers) sides across four major geographic regions: North America, Europe, Asia Pacific, and RoW. Approximately 80% and 20% of the primary interviews have been conducted from the supply and demand sides, respectively. These primary data have been collected through questionnaires, emails, and telephone interviews.

Note: The 3 tiers of the companies have been defined based on their total/segmental revenue as of 2024; Tier 1 = >USD 1 billion, Tier 2 = USD 1 billion–USD 500 million, and Tier 3 = USD 500 million. Others includes sales, marketing, and product managers.
To know about the assumptions considered for the study, download the pdf brochure
Market Size Estimation
In the complete market engineering process, both the top-down and bottom-up approaches were implemented, along with several data triangulation methods, to estimate and validate the size of the LiDAR market and various other dependent submarkets. Key players in the market were identified through secondary research, and their market share in the respective regions was determined through primary and secondary research. This entire research methodology included the study of annual and financial reports of the top players, as well as interviews with experts (such as CEOs, VPs, directors, and marketing executives) for key insights (quantitative and qualitative).
All percentage shares, splits, and breakdowns were determined using secondary sources and verified through primary sources. All the possible parameters that affect the markets covered in this research study were accounted for, viewed in detail, verified through primary research, and analyzed to obtain the final quantitative and qualitative data. This data was consolidated and supplemented with detailed inputs and analysis from MarketsandMarkets and presented in this report.
LiDAR Market : Top-Down and Bottom-Up Approach

Data Triangulation
After arriving at the overall market size from the market size estimation process as explained above, the total market has been split into several segments and subsegments. To complete the overall market engineering process and arrive at the exact statistics for all segments and subsegments, market breakdown and data triangulation procedures have been employed, wherever applicable. The data has been triangulated by studying various factors and trends from both demand and supply sides. Along with this, the market has been validated using top-down and bottom-up approaches.
Market Definition
LiDAR, or light detection and ranging, works on the time of flight principle. The system uses light waves or a light source as a pulsed laser to measure the distance between objects. Measuring distances helps create 3D maps of terrains or earth surfaces that are not visible to the human eye or cannot be created through photogrammetry. The light waves are combined with other data recorded by the system (airborne or ground-based) to generate precise 3D information about the shape and characteristics of the targeted object.
Key Stakeholders
- Senior Management
- End User
- Finance/Procurement Department
- R&D Department
Report Objectives
- To describe, segment, and forecast the overall size of the LiDAR market by type, installation, range, service, end-use application, and region, in terms of value
- To describe and forecast the market size for various segments with regard to four main regions—North America, Europe, Asia Pacific, and the Rest of the World (RoW), in terms of value
- To provide detailed information regarding major factors, such as drivers, restraints, opportunities, and challenges influencing the market growth
- To analyze the supply chain, trends/disruptions impacting customer business, market/ecosystem map, pricing analysis, and regulatory landscape pertaining to the LiDAR market
- To analyze opportunities in the market for stakeholders by identifying the high-growth segments of the market
- To briefly describe the value chain of light detection and ranging (LiDAR) solutions
- To strategically analyze micromarkets1 with respect to individual growth trends, prospects, and contributions to the overall market
- To profile key players and comprehensively analyze their market position in terms of their ranking and core competencies, along with the detailed competitive landscape of the market
- To analyze competitive developments, such as product launches and developments, partnerships, agreements, expansions, acquisitions, contracts, alliances, and research & development (R&D)undertaken in the LiDAR market
- To benchmark market players using the proprietary ‘Company Evaluation Matrix,’ which analyzes market players on various parameters within the broad categories of business strategy excellence and strength of product portfolio
- To analyze the probable impact of the recession on the market
Key Questions Addressed by the Report
What is the current size of the LiDAR Market?
The global LiDAR Market is estimated at around USD 3.27 billion in 2025 and is projected to reach USD 12.79 billion by 2030.
What is the expected growth rate of the LiDAR Market?
The LiDAR Market is expected to grow at a CAGR of 31.3% from 2025 to 2030 due to increasing demand for 3D sensing and mapping technologies.
What are the major growth drivers of the LiDAR Market?
Key drivers include adoption of autonomous vehicles, UAV LiDAR systems, smart infrastructure projects, 3D mapping demand, and environmental monitoring applications.
What are the key trends shaping the LiDAR Market?
Major trends include solid-state LiDAR adoption, AI-based data processing, LiDAR integration in autonomous vehicles, and growth of digital twins and smart cities.
Which region dominates the LiDAR Market?
Asia Pacific is expected to be the fastest-growing region due to infrastructure development, mapping activities, mining, and smart city initiatives.
Which LiDAR installation segment holds a major market share?
Ground-based LiDAR holds a significant market share due to increasing use in surveying, corridor mapping, and engineering applications.
Which application segment is driving LiDAR Market growth?
The ADAS and driverless cars segment is a major growth contributor due to increasing demand for accurate sensing and vehicle safety technologies.
Which industries are adopting LiDAR technology?
Major industries include automotive, construction, aerospace, defense, mining, agriculture, environmental monitoring, and surveying & mapping.
Who are the major companies in the LiDAR Market?
Leading companies include Hesai Group, RoboSense Technology Co., Ltd., SICK AG, Luminar Technologies, and Trimble Inc..
What does the LiDAR Market report analyze?
The report covers market size, forecast, installation type, technology, range, services, applications, end-use industries, regional analysis, competitive landscape, and growth opportunities through 2030.
Need a Tailored Report?
Customize this report to your needs
Get 10% FREE Customization
Customize This ReportPersonalize This Research
- Triangulate with your Own Data
- Get Data as per your Format and Definition
- Gain a Deeper Dive on a Specific Application, Geography, Customer or Competitor
- Any level of Personalization
Let Us Help You
- What are the Known and Unknown Adjacencies Impacting the LiDAR Market
- What will your New Revenue Sources be?
- Who will be your Top Customer; what will make them switch?
- Defend your Market Share or Win Competitors
- Get a Scorecard for Target Partners

Custom Market Research Services
We Will Customise The Research For You, In Case The Report Listed Above Does Not Meet With Your Requirements
Get 10% Free CustomisationTESTIMONIALS

Tetsuya Ohhira
Business Development Manager-Technology Business
Nikon Corporation,
Leading Japanese MNC specializing in optics and imaging productswww.nikon.com
MarketsandMarkets™ response
is quick. Their attitude is flexible and positive. Analyst Insights are globally considered and
significant. Client Services quickly respond to our inquiry and demand. Their wide range of global
surveys help us make our strategic plan.
We hope Knowledge Store will be easier to search
for a report.
VP - Marketing & Business Development
Leading Provider of Process Control Solutions
We engaged with MarketsandMarkets on a study to perform an analysis and recommend a Go-To-Market strategy for metrology and process control in the semiconductor market. The study was tailored to our targets and needs with well-defined milestones. Our overall experience with the MarketsandMarkets team was very good throughout the project in all aspects including the analysis methodologies used, the quality and depth of primary and secondary data sets, the professionalism and flexibility of the team and the ability to meet the target schedule and milestones. We want to thank MarketsandMarkets team for a job well done.
- US LiDAR Market
- Canada LiDAR Market
- Mexico LiDAR Market
- UK LiDAR Market
- Germany LiDAR Market
- France LiDAR Market
- Italy LiDAR Market
- Spain LiDAR Market
- Poland LiDAR Market
- China LiDAR Market
- Japan LiDAR Market
- South Korea LiDAR Market
- India LiDAR Market
- Australia LiDAR Market
- Indonesia LiDAR Market
- Malaysia LiDAR Market
- Thailand LiDAR Market
- Vietnam LiDAR Market
Growth opportunities and latent adjacency in LiDAR Market


Sunghun
Mar, 2016
Do you have technical report to focusing the components of 3D laser scanner for autonomous vehicle? If you have please send me the sample file. I'm little bit confusing with your reports. In your report contents, the meaning of LIDAR is little bit different as my understanding. Eventually the LIDAR components section, the components include GPS, Navigation. It's not only LIDAR sensor, kind of full system for autonomous vehicle. So, the other reports also mention the LIDAR components are same as yours. I think the 3D Laser scanner is mostly same as what I want to searching. So, I need not only market survey, but also technology reports..
Martin
Mar, 2019
We are looking to buy the LiDAR report and wanted to take a look at the sample to get a feeling on what we can expect..
Sanmeet
Nov, 2017
I am doing a school project on LIDAR and need a sample of the report to look at the potential market size..
Cameron
Apr, 2026
Which end-use industries are expected to dominate the LiDAR market by 2030, and how are applications such as urban planning, mining, agriculture, and infrastructure development evolving?.
Jason
Apr, 2026
What are the major factors driving the growth of the global LiDAR market, and how are advancements in 3D imaging, smart city projects, and autonomous vehicles contributing to this expansion?.
Alejandro
Apr, 2017
I am interested in the following topics Lidar bathymetry & topography services application mapping, cartography, exploration, urban planning..
Robbie
Feb, 2018
I am interested in knowing the key players in the LiDAR market specifically catering in the US..
Marcus
Aug, 2019
We are looking to quickly get smart on the LiDAR space to understand companies and their growth trajectory. .
Harris
Aug, 2015
I am interested to speak with the team that helped put together this report to explore the possibility to establish a relationship for future collaboration on such reports in the LiDAR market. It would be of mutual benefit to combine the views of the broader market with that of the leading 3-D real-time LiDAR manufacture..
Taylor
Nov, 2013
Hoping to see a bit more than what is on the website. Wanting to know if information has been gathered on LiDAR service providers, not just equipment. Also LiDAR systems now operate in the 500 kHz range (article says as high as 100 kHz)..
User
Sep, 2019
ADAS and Autonomus vehicles are expected to disrrupt the solid-state LiDAR market. What are the other applications that would impact our revenues? Who are the leading manufacturers for solid-state LiDAR? .
andy
Sep, 2019
I want the latest news about materials solutions to the new components on vehicles, such as ADAS sensors, integration of parts, HUD, future interior designs. .
Mateusz
Aug, 2015
I am interested in the following sections Market Analysis, By Application (Page No. - 79) Premium Insights (Page No. - 31) Market Overview (Page No. - 37) Industry Trends (Page No. - 46) Airborne LiDAR.
greg
May, 2015
We are interested only in the applications part of the LiDAR report. Do you provide it separately?.
Jake
Oct, 2017
Specifically interested in ADAS & Driverless car markets for LIDAR and its future growth. How is that market distinct from the other projected markets? .
Roberto
Dec, 2017
I am interested in offering my knowledge in the fields I have experience, such as Sales Manager, Trainer and Technology Transfer in Geomatics tools like Lidar. I am also interested in knowing about how does the Lidar Market work in some regions of the world and the latest updates on this interesting field..
User
Sep, 2019
Will government mandates really help in achieving a significant position in the market? What would be impact of government mandates in long term like after 3 years and 5 years and its impact on the use of drones in next 3-5 years? .
Zheenbek
Nov, 2013
We would like to conduct field surveys of mining areas, tailing sites and land use/cover analysis. We are interested in price of LIDAR's..
Zheenbek
Nov, 2013
We would like to conduct field surveys of mining areas, tailing sites and land use/cover analysis. We are interested in price of LIDAR's..
Tyson
Oct, 2014
Can you tell us the Lidar market size in 2014? We need to know if it's worth is to investigate this market more and purchase the full report..
User
Sep, 2019
Ground-based LiDAR being the dominant LiDAR type does airborne LiDAR have a significant penitration in LiDAR offerings? Do you have any estimations for use of airborne LiDAR in next 3 to 5 years? .
YSK
Jul, 2020
Which wavelength of Lidar will be chosen for both automotive and non-automotive applications?.
John
Jun, 2019
I need LIDAR data for an AOI for a small in southeast Nigeria, for a PhD research on forest carbon mapping..
Md
Jun, 2019
Which UAV is Best for aerial photography & LiDAR Survey? Which software is Best for those data analysis and aerial triangulation, stereo plotting, DTM & Orth photo generation for 1:1000 scale topographic mapping?.
David
Dec, 2017
We are suppling in-line processing technology to the transportation industry (automotive/trucking ADAS and other navigation applications). Are you covering only the sensor portion of the market, or the entire system including the processing elements (silicon) that pair with LiDAR?.
Shigeru
Oct, 2015
LiDAR is expected to expand its application to ADAS which has enormous market size. In parallel with increasing the market, unit price is going to be lowered. We are interested in this price/quantity trend in each application..
balu
Dec, 2014
I want info only related to Airborne, Corridor Mapping, Forestry of LiDAR market.
Aigul
Dec, 2015
Can we only get the data of urban planning in countries with developing economy (central Asian, if available) with emphasis of water resources and hazardous industrial waste storage/management?.
Aigul
Dec, 2015
Can we only get the data of urban planning in countries with developing economy (central Asian, if available) with emphasis of water resources and hazardous industrial waste storage/management?.
Darren
Dec, 2015
LiDAR for automotive ADAS and industry automation applications. Any discount can be available besides the list fee?.
Ana
Dec, 2019
When did the LiDAR Market was last comprehensively researched? Is the complete market information updated as of now? Actual data/Historic Data for which years? Base year estimates for which year? Forecasts years? Does the report contains Market size in terms of number of units? What is the content of the report? When does the next version come out? .
Guest
Nov, 2024
Can I get a LIDAR custom report?.
User
Nov, 2019
LiDAR has a highest revenue from aerial surveying applications. Is there a significant presence in GIS services and ground-based surveying applications too? What all have you considered for GIS services and ground-based surveying applications? .
Kizito
Oct, 2019
I am a surveyor engaged in both Land and Hydrographic surveying. I would like to know how I can use Lidar for mapping shallow waters in Hydrographic surveying project..
Dave
Oct, 2019
Can we get the data only for US LiDAR market?.
Md
Oct, 2019
Proper specification of LiDAR, RGB camera & Drone. Who are the major players for purchasing those devices?.
Robert
Sep, 2019
We are a small, seed-stage Lidar developer working on chip-scale Lidar. We'd greatly appreciate access to "LiDAR Market by Type (Mechanical LiDAR and Solid-State LiDAR), Installation (Airborne and Ground-Based), Application (Corridor Mapping, ADAS & Driverless Car, and Engineering), Range, Component, Service, and Geography - Global Forecast to 2023". We would also appreciate the opportunity to talk to and connect your researchers to see if we can be of mutual benefit to each other. We'd love to learn a bit more about your research process..
Mark
Aug, 2019
My company is looking to get into LiDAR marketspace. Research studies such as these could help us plan more effectively. .
Adrian
Aug, 2019
What can one expect under cartography application of LiDAR report?.
Bryan
Mar, 2016
This report, "LiDAR Market by Product (Aerial, Ground-based, and UAV LiDAR), Component, Application (Corridor Mapping, Engineering, Environment, ADAS, Urban Planning, Exploration, and Metrology), Services and Geography - Global Forecast to 2022", Who is the author of this report? .
User
Mar, 2019
North America is the leader in the LiDAR market. How do you look towards the market in Middle East, and use of LiDAR in exploration application in this region? Have you provided the estimates for LiDAR in Middle East region for oil & gas applications.
Janina
Jan, 2014
I am looking for the following: Size of LiDAR market by industry (road vehicle based, UAV based, manned aircraft based...) and by territory (country)..
Keith
Jan, 2015
Do you provide the LiDAR report only on Alternative materials for solid state laser host media, blue & UV laser diodes, and non linear optics sections?.