Lipase Market by Source (Microbial Lipases, Animal Lipases), Application (Animal Feed, Dairy, Bakery, Confectionery, Others), & by Geography (North America, Europe, Asia-Pacific, Latin America, RoW) - Global Forecast to 2020


Lipase is one of the rapidly growing markets in the industrial enzymes market, mainly due to its numerous health and industrial benefits. It helps in the digestion of fats by breaking them down into fatty acids and glycerol. It also helps in controlling appetite and regulates cholesterol levels in the body. Furthermore, lipase performs several functions, such as texturants, flavorants, cleaning agents, and shelf life enhancers and has a range of applications in food & non-food industries.
The global market has been categorized into source, application, and geography. On the basis of source, the lipase market has been segmented into microbial lipases and animal lipases. On the basis of application, the segmentation includes animal feed, dairy, bakery, confectionery, and others. The market has also been segmented on the basis of regions into North America, Europe, Asia-Pacific, Latin America, and Rest of the World (RoW).
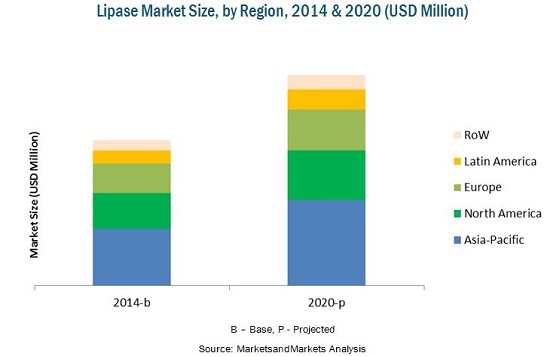
The global market is projected to reach $590.5 Million by 2020, at a CAGR of 6.5% between 2015 and 2020. In 2014, the market was dominated by Asia-Pacific, followed by North America. The Asia-Pacific market is projected to grow at the highest CAGR, with rapid growth in the lipase market in developing countries such as China and India. The growing awareness about animal health and the rising consumption of meat and processed milk products are the major factors anticipated to drive the growth the market in this region.
This report includes market sizes in terms of value (USD Million) and volume (MT). Both top-down and bottom-up approaches were used to arrive at the market sizes and obtain the market forecast. Extensive secondary research was conducted to understand the market insights and trends, which was further validated through primary interviews. The report provides both, qualitative and quantitative analysis of the lipase market, the competitive landscape, and the preferred development strategies of key players.
The key players were observed to prefer new product launches & developments, acquisitions, agreements, and expansions as strategies to capture a larger share in the market. The report also analyzes the market dynamics, winning imperatives, and issues faced by leading players.
Scope of the Report
The research study has categorized the market on the basis of source, application, and geography.
On the basis of source, the market has been segmented as follows:
- Microbial Lipases
- Animal Lipases
On the basis of application, the market has been segmented as follows:
- Animal Feed
- Dairy
- Bakery
- Confectionery
- Others
On the basis of geography, the market has been segmented as follows:
- North America
- Europe
- Asia-Pacific
- Latin America
- RoW
The growth of the lipase market is fueled by the growing awareness about animal health and rising consumption of meat and processed milk products. Numerous health benefits of lipases to improve health of the livestock have led to a large-scale adoption of lipase in various animal feeds in the global market. As an ingredient in food industry, it helps improving food quality and enhances the flavor of certain food items, improves their texture, prolongs shelf life, and increases the softness in some food products. The increasing demand for improved quality of meat and processed dairy products is driving the demand for lipases in animal feed and dairy application segments. Lipases are largely used in the animal feed, dairy, bakery, and confectionery industries.
The lipase market has been segmented based on source into microbial lipases and animal lipases. Based on application, the market has been segmented into animal feed, dairy, bakery, confectionery, and others. The market has also been segmented on the basis of regions, into North America, Europe, Asia-Pacific, Latin America, and Rest of the World (RoW), and has been further segmented on the basis of their key countries. This report includes market sizes in terms of value (USD Million) and volume (MT).
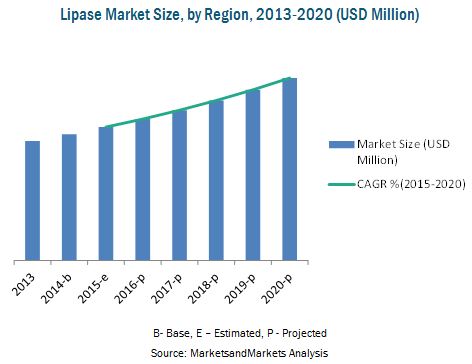
The global market size of lipase is projected to reach $590.5 Million by 2020, at a CAGR of 6.5% between 2015 and 2020, with the increasing use of lipase in numerous feeds for livestock. Furthermore, the rising opportunities in emerging markets such as India, China, and Brazil are anticipated to augment the market size of lipases over the forecast period. In 2014, Asia-Pacific was the largest market for lipase. The Asia-Pacific market is projected to grow at the highest CAGR during the forecast period.
The lipase market is oligopolistic & competitive in nature, with few players dominating the market and many small players operating at regional and local levels. The key players in the market adopted new product launches and expansions as their preferred strategies. Key players such as Novozymes A/S (Denmark), E. I. du Pont de Nemours and Company (Genencor) (U.S.), Koninklijke DSM N.V. (Netherlands), and Chr. Hansen Holdings A/S (Denmark) have been profiled in the report.
 Exclusive indicates content/data unique to MarketsandMarkets and not available with any competitors.
Table of Contents
1 Introduction (Page No. - 14)
1.1 Objectives of the Study
1.2 Market Definition
1.3 Markets Scope
1.3.1 Years Considered in the Report
1.3.2 Currency & Pricing
1.4 Stakeholders
2 Research Methodology (Page No. - 17)
2.1 Market Share Estimation
2.1.1 Secondary Data
2.1.2 Primary Data
2.1.2.1 Key Industry Insights
2.1.2.2 Breakdown of Primaries
2.2 Market Size Estimation
2.3 Market Breakdown & Data Triangulation
2.3.1 Assumptions
3 Executive Summary (Page No. - 26)
4 Premium Insights (Page No. - 29)
4.1 Attractive Market Opportunity for Lipase Manufacturers
4.2 Lipase Market Growing at A Fast Pace
4.3 Lipase Market in Asia-Pacific
4.4 Global Lipase Market, By Type: Value & Volume
4.5 Lipase Market Attractiveness
5 Market Overview (Page No. - 33)
5.1 Introduction
5.2 Market Segmentation
5.2.1 By Source
5.2.2 By Application
5.3 Market Dynamics
5.3.1 Drivers
5.3.1.1 Increasing Awareness About Animal Health
5.3.1.2 Rise in Global EMC & EMDI Consumption
5.3.1.3 Increased Demand for Quality Animal Produce
5.3.1.4 Multiple Health Benefits
5.3.2 Restraints
5.3.2.1 Lack of Transparency in Patent Protection Laws
5.3.3 Opportunities
5.3.3.1 Large Number of Emerging Applications
5.3.4 Challenges
5.3.4.1 Creating Awareness About Benefits of Lipases
6 Regulatory Environment Analysis (Page No. - 39)
6.1 North America: Regulatory Framework
6.2 Europe: Regulatory Framework
6.3 Asia-Pacific: Regulatory Framework
6.4 Latin America: Regulatory Framework
7 Industry Trends (Page No. - 42)
7.1 Introduction
7.2 Value Chain Analysis
7.3 Global Lipase Market : Porters Five Forces Analysis
7.3.1 Intensity of Competitive Rivalry
7.3.2 Bargaining Power of Suppliers
7.3.3 Bargaining Power of Buyers
7.3.4 Threat of Substitutes
7.3.5 Threat of New Entrants
8 Lipase Market, By Source (Page No. - 47)
8.1 Introduction
8.2 Microbial Lipases
8.3 Animal Lipases
9 Lipase Market, By Application (Page No. - 53)
9.1 Introduction
9.2 Lipase in Animal Feed
9.3 Lipase in Dairy
9.4 Lipase in Bakery
9.5 Lipase in Confectionery
9.6 Lipase in Others
10 Regional Analysis (Page No. - 75)
10.1 Introduction
10.2 North America
10.2.1 North America Lipase Market, By Application
10.2.2 North America Lipase Market, By Source
10.2.3 U.S. Lipase Market, By Application
10.2.4 Canada Lipase Market, By Application
10.2.5 Mexico Lipase Market, By Application
10.3 Europe
10.3.1 Europe Lipase Market, By Application
10.3.2 Europe Lipase Market, By Source
10.3.3 Germany Lipase Market, By Application
10.3.4 U.K. Lipase Market, By Application
10.3.5 France Lipase Market, By Application
10.3.6 Spain Lipase Market, By Application
10.3.7 Russia Lipase Market, By Application
10.4 Asia-Pacific
10.4.1 Asia-Pacific Lipase Market, By Application
10.4.2 Asia-Pacific Lipase Market, By Source
10.4.3 China Lipase Market, By Application
10.4.4 India Lipase Market, By Application
10.4.5 Indonesia Lipase Market, By Application
10.4.6 Japan Lipase Market, By Application
10.4.7 Australia Lipase Market, By Application
10.5 Latin America
10.5.1 Latin America Lipase Market, By Application
10.5.2 Latin America Lipase Market, By Source
10.5.3 Brazil Lipase Market, By Application
10.5.4 Argentina Lipase Market, By Application
10.6 RoW
10.6.1 RoW Lipase Market, By Application
10.6.2 RoW Lipase Market, By Source
10.6.3 South Africa Lipase Market, By Application
11 Competitive Landscape (Page No. - 137)
11.1 Overview
11.2 Developments, By Region
11.3 Developments, By Year
11.4 Market Share, By Key Players
11.5 Competitive Situation and Trends
11.5.1 New Product Launch
11.5.2 Expansions and Investments
11.5.3 Mergers & Acquisitions
11.5.4 Agreements and Joint Ventures
12 Company Profiles (Page No. - 143)
(Company at A Glance, Recent Financials, Products & Services, Strategies & Insights, & Recent Developments)*
12.1 Introduction
12.2 Novozymes A/S
12.3 Koninklijke DSM N.V.
12.4 Chr. Hansen Holdings A/S
12.5 Amano Enzymes Inc.
12.6 Associated British Foods PLC
12.7 E. I. Du Pont De Nemours and Company (Genencor)
12.8 Advanced Enzymes
12.9 Clerici-Sacco Group
12.10 Renco New Zealand
12.11 Enzyme Development Corporation
*Details on Company at A Glance, Recent Financials, Products & Services, Strategies & Insights, & Recent Developments Might Not Be Captured in Case of Unlisted Companies.
13 Appendix (Page No. - 166)
13.1 Discussion Guide
13.2 Company Developments
13.2.1 New Product Launch
13.2.2 Expansions and Investments
13.2.3 Mergers & Acquisitions
13.3 Introducing RT: Real Time Market Intelligence
13.4 Available Customization
13.5 Related Reports
List of Tables (122 Tables)
Table 1 Potential Impact of Opportunities on the Lipase Market
Table 2 Lipase Market Size, By Source, 2013-2020 (USD Million)
Table 3 Lipase Market Size, By Source, 2013-2020 (MT)
Table 4 Microbial Lipases Market Size, By Geography, 2013-2020 (USD Million)
Table 5 Microbial Lipases Market Size, By Geography, 2013-2020 (MT)
Table 6 Animal Lipases Market Size, By Geography, 2013-2020 (USD Million)
Table 7 Animal Lipases Market Size, By Geography, 2013-2020 (MT)
Table 8 Lipase Market Size, By Application, 2013-2020 (USD Million)
Table 9 Lipase Market Size, By Application, 2013-2020 (MT)
Table 10 Lipase in Animal Feed Market Size, By Geography, 2013-2020 (USD Million)
Table 11 Lipase in Animal Feed Market Size, By Geography, 2013-2020 (MT)
Table 12 Lipase in Poultry Feed Market Size, By Geography, 2013-2020 (USD Million)
Table 13 Lipase in Poultry Feed Market Size, By Geography, 2013-2020 (MT)
Table 14 Lipase in Aqua Feed Market Size, By Geography, 2013-2020 (USD Million)
Table 15 Lipase in Aqua Feed Market Size, By Geography, 2013-2020 (MT)
Table 16 Lipase in Swine Feed Market Size, By Geography, 2013-2020 (USD Million)
Table 17 Lipase in Swine Feed Market Size, By Geography, 2013-2020 (MT)
Table 18 Lipase in Ruminant Feed Market Size, By Geography, 2013-2020 (USD Million)
Table 19 Lipase in Ruminant Feed Market Size, By Geography, 2013-2020 (MT)
Table 20 Lipase in Dairy Market Size, By Geography, 2013-2020 (USD Million)
Table 21 Lipase in Dairy Market Size, By Geography, 2013-2020 (MT)
Table 22 Lipase in Cheese/ EMC Market Size, By Geography, 2013-2020 (USD Million)
Table 23 Lipase in Cheese/EMC Market Size, By Geography, 2013-2020 (MT)
Table 24 Lipase in EMDI Market Size, By Geography, 2013-2020 (USD Million)
Table 25 Lipase in EMDI Market Size, By Geography, 2013-2020 (MT)
Table 26 Lipase in Bakery Market Size, By Geography, 2013-2020 (USD Million)
Table 27 Lipase in Bakery Market Size, By Geography, 2013-2020 (MT)
Table 28 Lipase in Confectionery Market Size, By Geography, 2013-2020 (USD Million)
Table 29 Lipase in Confectionery Market Size, By Geography, 2013-2020 (MT)
Table 30 Lipase in Others Market Size, By Geography, 2013-2020 (USD Million)
Table 31 Lipase in Others Market Size, By Geography, 2013-2020 (MT)
Table 32 Lipase Market Size, By Geography, 2013-2020 (USD Million)
Table 33 Lipase Market Size, By Geography, 2013-2020 (MT)
Table 34 North America: Lipase Market Size, By Geography 2013-2020 (USD Million)
Table 35 North America: Market Size, By Geography 2013-2020 (MT)
Table 36 North America: Market Size, By Application, 2013-2020 (USD Million)
Table 37 North America: Market Size, By Application, 2013-2020 (MT)
Table 38 Lipase in Animal Feed in North America, 2013-2020 (USD Mn)
Table 39 Lipase in Animal Feed in North America, 2013-2020 (MT)
Table 40 Lipase in Dairy in North America, 2013-2020 (USD Mn)
Table 41 Lipase in Dairy in North America, 2013-2020 (MT)
Table 42 North America: Lipase Market Size, By Application, 2013-2020 (USD Million)
Table 43 North America: Market Size, By Application, 2013-2020 (MT)
Table 44 U.S.: Lipase Market Size, By Application, 2013-2020 (USD Million)
Table 45 U.S.: Market Size, By Application, 2013-2020 (MT)
Table 46 Canada: Lipase Market Size, By Application, 2013-2020 (USD Million)
Table 47 Canada: Market Size, By Application, 2013-2020 (MT)
Table 48 Mexico: Lipase Market Size, By Application, 2013-2020 (USD Million)
Table 49 Mexico: Market Size, By Application, 2013-2020 (MT)
Table 50 Europe: Lipase Market Size, By Geography 2013-2020 (USD Million)
Table 51 Europe: Market Size, By Geography, 2013-2020 (MT)
Table 52 Europe: Market Size, By Application, 2013-2020 (USD Million)
Table 53 Europe: Market Size, By Application, 2013-2020 (MT)
Table 54 Europe: Lipase Market in Animal Feed, 2013-2020 (USD Mn)
Table 55 Europe: Market in Animal Feed, 2013-2020 (MT)
Table 56 Europe: Lipase Market in Dairy in Europe, 2013-2020 (USD Mn)
Table 57 Europe: Market in Dairy, 2013-2020 (MT)
Table 58 Europe: Lipase Market Size, By Source, 2013-2020 (USD Million)
Table 59 Europe: Market Size, By Source, 2013-2020 (MT)
Table 60 Germany: Lipase Market Size, By Application, 2013-2020 (USD Million)
Table 61 Germany: Market Size, By Application, 2013-2020 (MT)
Table 62 U.K.: Lipase Market Size, By Application, 2013-2020 (USD Million)
Table 63 U.K.: Market Size, By Application, 2013-2020 (MT)
Table 64 France: Lipase Market Size, By Application, 2013-2020 (USD Million)
Table 65 France: Market Size, By Application, 2013-2020 (MT)
Table 66 Spain: Lipase Market Size, By Application, 2013-2020 (USD Million)
Table 67 Spain: Market Size, By Application, 2013-2020 (MT)
Table 68 Russia: Lipase Market Size, By Application, 2013-2020 (USD Million)
Table 69 Russia: Market Size, By Application, 2013-2020 (MT)
Table 70 Asia-Pacific: Lipase Market Size, By Geography 2013-2020 (USD Million)
Table 71 Asia-Pacific: Market Size, By Geography 2013-2020 (MT)
Table 72 Asia-Pacific: Market Size, By Application, 2013-2020 (USD Million)
Table 73 Asia-Pacific: Market Size, By Application, 2013-2020 (MT)
Table 74 Lipase in Animal Feed in Asia-Pacific, 2013-2020 (USD Mn)
Table 75 Lipase in Animal Feed in Asia-Pacific, 2013-2020 (MT)
Table 76 Lipase in Dairy in Asia-Pacific, 2013-2020 (USD Mn)
Table 77 Lipase in Dairy in Asia- Pacific, 2013-2020 (MT)
Table 78 Asia-Pacific: Lipase Market Size, By Source, 2013-2020 (USD Million)
Table 79 Asia-Pacific: Market Size, By Source, 2013-2020 (MT)
Table 80 China: Lipase Market Size, By Application, 2013-2020 (USD Million)
Table 81 China: Market Size, By Application, 2013-2020 (MT)
Table 82 India: Lipase Market Size, By Application, 2013-2020 (USD Million)
Table 83 India: Market Size, By Application, 2013-2020 (MT)
Table 84 Indonesia: Lipase Market Size, By Application, 2013-2020 (USD Million)
Table 85 Indonesia: Market Size, By Application, 2013-2020 (MT)
Table 86 Japan: Lipase Market Size, By Application, 2013-2020 (USD Million)
Table 87 Japan: Market Size, By Application, 2013-2020 (MT)
Table 88 Australia: Lipase Market Size, By Application, 2013-2020 (USD Million)
Table 89 Australia: Market Size, By Application, 2013-2020 (MT)
Table 90 Latin America Lipase: Market Size, By Geography 2013-2020 (USD Million)
Table 91 Latin America: Market Size, By Geography 2013-2020 (MT)
Table 92 Latin America: Market Size, By Application, 2013-2020 (USD Million)
Table 93 Latin America: Market Size, By Application, 2013-2020 (MT)
Table 94 Lipase in Animal Feed in Latin America, 2013-2020 (USD Mn)
Table 95 Lipase in Animal Feed in Latin America, 2013-2020 (MT)
Table 96 Lipase in Dairy in Latin America, 2013-2020 (USD Mn)
Table 97 Lipase in Dairy in Latin America, 2013-2020 (MT)
Table 98 Latin America Lipase Market Size, By Source, 2013-2020 (USD Million)
Table 99 Latin America Lipase Market Size, By Source, 2013-2020 (MT)
Table 100 Brazil: Lipase Market Size, By Application, 2013-2020 (USD Million)
Table 101 Brazil: Market Size, By Application, 2013-2020 (MT)
Table 102 Argentina: Lipase Market Size, By Application, 2013-2020 (USD Million)
Table 103 Argentina: Market Size, By Application, 2013-2020 (MT)
Table 104 RoW: Lipase Market Size, By Geography 2013-2020 (USD Million)
Table 105 RoW: Market Size, By Geography 2013-2020 (MT)
Table 106 RoW: Market Size, By Application, 2013-2020 (USD Million)
Table 107 RoW: Market Size, By Application, 2013-2020 (MT)
Table 108 Lipase in Animal Feed in RoW, 2013-2020 (USD Mn)
Table 109 Lipase in Animal Feed in RoW, 2013-2020 (MT)
Table 110 Lipase in Dairy in RoW, 2013-2020 (USD Mn)
Table 111 Lipase in Dairy in RoW, 2013-2020 (MT)
Table 112 RoW: Lipase Market Size, By Source, 2013-2020 (USD Million)
Table 113 RoW: Market Size, By Source, 2013-2020 (MT)
Table 114 South Africa: Lipase Market Size, By Application, 2013-2020 (USD Million)
Table 115 South Africa: Market Size, By Application, 2013-2020 (MT)
Table 116 New Product Launches, 2011–2015
Table 117 Expansions and Investments, 2010–2015
Table 118 Mergers & Acquisitions, 2010–2015
Table 119 Agreements and Joint Ventures, 2010–2015
Table 120 New Product Launches, 2011–2015
Table 121 Expansions and Investments, 2010–2015
Table 122 Mergers & Acquisitions, 2010–2015
List of Figures (92 Figures)
Figure 1 Research Design
Figure 2 Key Data From Secondary Sources
Figure 3 Key Data From Primary Sources
Figure 4 Breakdown of Primary Interviews, By Company Type, Designation & Region
Figure 5 Market Size Estimation Methodology: Bottom-Up Approach
Figure 6 Market Size Estimation Methodology: Top-Down Approach
Figure 7 Market Breakdown & Data Triangulation
Figure 8 Animal Feed to Dominate the Application Segment of this Market
Figure 9 Microbial Lipases Segment to Register the Highest CAGR Between 2015 & 2020
Figure 10 Asia-Pacific is Estimated to Be the Largest Market for Lipase, in Terms of Volume (2015-2020)
Figure 11 Lipase Market is Lucrative for Enzyme Manufacturers
Figure 12 Asia Pacific to Witness the Highest Growth During the Forecast Period
Figure 13 China Emerges as the Largest Consumer of Lipase in Asia-Pacific
Figure 14 Microbial Lipases is Projected to Be the Faster-Growing Segment and Contribute A Major Market Share During the Forecast Period
Figure 15 Asia-Pacific to Command the Largest Share of this Market (2015)
Figure 16 Lipase Market Segmentation, By Source
Figure 17 Lipase Market Segmentation, By Application
Figure 18 Increased Animal Health Awareness and Rising Demand of EMC & EMDI to Lead the global market in Future
Figure 19 Authorities & Regulations for the Lipase Market
Figure 20 Lipase Production and Processing Adds Major Value to the Final Product
Figure 21 Global Lipase Market: Porters Five Forces Analysis
Figure 22 Lipase Market, By Type
Figure 23 Microbial Lipases to See the Fastest Growth, From 2015
Figure 24 Asia-Pacific to Grow at the Fastest Pace, From 2015
Figure 25 Asia-Pacific to Be the Largest Segment for Microbial Lipases (2015)
Figure 26 Lipase Market, By Application
Figure 27 Animal Feed to Be the Largest Segment By 2020
Figure 28 Asia-Pacific is the Largest Sub-Segment for the Animal Feed Application
Figure 29 Asia-Pacific Led the Lipase Market in Poultry Feed Application
Figure 30 Asia-Pacific is the Largest Sub-Segment for the Aqua Feed Application
Figure 31 Asia-Pacific to Witness the Fastest Growth in Lipase in Swine Feed Market, From 2015
Figure 32 Asia-Pacific to Lead Lipase in Ruminant Feed Market
Figure 33 Asia-Pacific Estimated to Be the Largest Market for Lipase in Diary Application
Figure 34 Asia-Pacific to Grow at the Fastest CAGR From 2015 to 2020
Figure 35 Asia-Pacific Estimated to Be the Largest Market for Lipase in Cheese/EMC Application, From 2014
Figure 36 Lipase Market in Bakery Segment to Witness Highest Growth in Asia-Pacific
Figure 37 Asia-Pacific is Projected to Be the Largest Market for Lipase in Confectionery Application Segment
Figure 38 Lipase Market in Confectionary Anticipated to Witness the Fastest Growth in Asia-Pacific
Figure 39 Lipase Market in Asia-Pacific Expected to Witness Significant Growth Due to Increasing Demand From Emerging Economies
Figure 40 Regional Snapshot: Asia-Pacific Driving the Growth in the Lipase Market
Figure 41 North America:Lipase Market Snapshot, (2014-2020)
Figure 42 U.S. Expected to Be the Largest Market for Lipase During the Forecast Period
Figure 43 Animal Feed Segment to Witness Fastest Growth in North American Lipase Market
Figure 44 Microbial Lipases to Remain the Largest Segment By 2020
Figure 45 Animal Feed Segment Leads the U.S. Lipase Market By Application
Figure 46 Animal Feed Segment Leads the Lipase Application Market in Canada,
Figure 47 Animal Feed Segment Leads the Lipase Market in Mexico,
Figure 48 Spain is Expected to Be the Fastest-Growing Market for Lipase in Europe
Figure 49 Animal Feed is the Largest Application for Lipase in Europe
Figure 50 Microbial Lipase Segment to Lead the European Lipase Market
Figure 51 Confectionery to See the Fastest Growth in Germany, From 2015
Figure 52 Confectionery to See the Fastest Growth in U.K., From 2015
Figure 53 Animal Feed to Lead the Lipase Application Market in France, From 2014
Figure 54 Animal Feed Segment to Lead the Lipase Application Market in France
Figure 55 Animal Feed to Lead the Lipase Application Market in Russia, From 2014
Figure 56 Asia-Pacific: Lipase Market Snapshot, (2014 – 2020)
Figure 57 Indonesia is Expected to Be the Fastest Growing Market for Lipase
Figure 58 Dairy Segment to Closely Follow Animal Feed in Asia-Pacific Lipase Market
Figure 59 Bio-Lipase Segment to Witness the Fastest Growth in Asia-Pacific
Figure 60 Confectionery Segment to Be the Fastest-Growing Segment of the Market in China
Figure 61 Bakery Application of Lipase to Witness the Fastest Growth in India
Figure 62 Animal Feed Segment to Lead the Lipase Market in the Indonesia
Figure 63 Animal Feed Segment to Lead the Lipase Market in the Japan
Figure 64 Animal Feed Application Segment to Lead the Lipase Market in Australia
Figure 65 Brazil is Expected to Be the Fastest-Growing Market for Lipase
Figure 66 Animal Feed to Be the Largest Application Segment for Lipase Market in Latin America
Figure 67 Microbial Lipases Segment to Witness the Fastest Growth in Latin America
Figure 68 Confectionery to Witness the Fastest Growth in Brazil
Figure 69 Animal Feed to Be the Largest Application Segment in Brazil
Figure 70 South Africa is Expected to Be the Largest Market for Lipase
Figure 71 Animal Feed to Be the Largest Application Segment of Lipase Market Growth in RoW
Figure 72 Microbial Lipase to Witness the Fastest Growth in RoW
Figure 73 Confectionery to Witness the Fastest Growth in South Africa
Figure 74 Companies Adopted New Product Launch as the Key Growth Strategy During the Studied Period (2010-2015)
Figure 75 Key Growth Strategies in Global Lipase Market, 2010-2015
Figure 76 New Product Launches in Europe has Made It the Most Active Region From 2012–2015
Figure 77 Maximum Developments Observed During the Year 2013
Figure 78 Novozymes A/S the Largest Player in the Market
Figure 79 Geographic Revenue Mix of Top 5 Market Players
Figure 80 Novozymes A/S: Company Snapshot
Figure 81 SWOT Analysis
Figure 82 Koninklijke DSM N.V.: Company Snapshot
Figure 83 SWOT Analysis
Figure 84 Chr. Hansen Holdings A/S: Company Snapshot
Figure 85 SWOT Analysis
Figure 86 Amano Enzymes Inc.: Key Financials
Figure 87 Associated British Food PLC: Company Snapshot
Figure 88 SWOT Analysis
Figure 89 E. I. Du Pont De Nemours and Company (Genencor): Company Snapshot
Figure 90 SWOT Analysis
Figure 91 Advanced Enzymes: Company Snapshot
Figure 92 SWOT Analysis


Growth opportunities and latent adjacency in Lipase Market