Process Analyzer Market (Liquid), by Type (pH/ORP, Conductivity, Near-Infrared, Turbidity, Dissolved Oxygen, Chlorine, Liquid Density, MLSS, TOC, Aluminium, and Ammonia), Service (Pre-sale and Post-sale), Industry, and Geography - Global Forecast to 2035


Process Analyzer Market Summary
The Process Analyzer Market is witnessing sustained expansion as industries increasingly adopt advanced monitoring and analytical solutions to improve operational efficiency, regulatory compliance, and production quality. The global Process Analyzer Market is estimated to be valued at USD 8–9 billion in 2025 and is projected to reach approximately USD 15–17 billion by 2035, registering a CAGR of 6%–8% during the forecast period. The growing implementation of Industry 4.0 initiatives, rising investments in industrial automation, and increasing demand for real-time process monitoring across oil & gas, chemicals, pharmaceuticals, food & beverages, water treatment, and power generation are major growth drivers. Furthermore, the integration of artificial intelligence (AI), Industrial Internet of Things (IIoT), cloud-based analytics, and predictive maintenance platforms is transforming conventional process analyzers into intelligent systems capable of delivering continuous operational insights, minimizing downtime, and improving process efficiency.
Key Market Trends & Insights
-
North America remains the leading regional market due to widespread adoption of industrial automation and smart manufacturing technologies.
-
Asia Pacific is projected to record the fastest growth owing to rapid industrialization and expanding manufacturing activities.
-
Gas analyzers continue to dominate the product segment because of increasing environmental monitoring and emission control regulations.
-
AI-enabled predictive analytics and cloud-connected process analyzers are becoming standard features across industrial facilities.
-
Increasing demand for continuous emission monitoring systems (CEMS) and digital process optimization is accelerating market innovation.
-
Integration of IoT sensors and edge computing is enhancing real-time process visibility and operational intelligence.
Market Size & Forecast
-
Base Year Market Size (2025): USD 8–9 billion
-
Forecast Market Value (2035): USD 15–17 billion
-
Expected CAGR (2025–2035): 6%–8%
-
Growth Outlook: Market expansion is supported by stricter environmental regulations, industrial digitalization, AI-powered process optimization, predictive maintenance, and growing investments in automation across manufacturing industries.
Process Analyzer Market Top 10 key takeaway
-
The Process Analyzer Market is expected to nearly double in value by 2035.
-
AI-driven predictive monitoring is transforming industrial process optimization.
-
Gas analyzers represent the largest product category globally.
-
North America continues to lead global market revenue.
-
Asia Pacific is expected to register the fastest CAGR throughout the forecast period.
-
Oil & gas remains the largest end-use application segment.
-
Cloud-enabled remote monitoring is improving operational efficiency.
-
Environmental compliance regulations continue to stimulate market demand.
-
Industrial IoT integration is enhancing analyzer performance and reliability.
-
Leading companies are investing heavily in smart digital analyzer platforms.
Product Insights
Gas analyzers account for the largest share of the Process Analyzer Market owing to increasing environmental regulations, industrial safety requirements, and continuous emission monitoring initiatives. Industries such as oil & gas, petrochemicals, power generation, and chemicals depend heavily on gas analyzers for monitoring oxygen, carbon dioxide, sulfur compounds, hydrocarbons, and other industrial gases to maintain safe and efficient operations.
Liquid analyzers also represent a significant portion of the market, particularly for monitoring pH, conductivity, dissolved oxygen, turbidity, chlorine, and chemical composition in water treatment, pharmaceuticals, food processing, and wastewater management. Spectroscopic analyzers, chromatography systems, and hybrid multi-parameter analyzers are emerging rapidly due to their superior analytical capabilities and accuracy.
Manufacturers are increasingly integrating AI algorithms into analyzer platforms to detect anomalies, recommend maintenance schedules, optimize calibration cycles, and improve measurement precision. Smart diagnostic capabilities significantly reduce maintenance costs while maximizing operational uptime.
Technology / Component Insights
Technological innovation remains a primary growth catalyst within the Process Analyzer Market. Advanced sensor technologies, laser spectroscopy, gas chromatography, infrared analysis, ultraviolet spectroscopy, electrochemical sensing, and mass spectrometry continue to improve analytical accuracy across industrial processes.
Artificial intelligence has become a major differentiator, enabling predictive analytics, automated diagnostics, and intelligent calibration. AI-powered software continuously analyzes process variables, identifies abnormal operating conditions, and provides predictive recommendations before equipment failures occur.
Industrial IoT platforms allow process analyzers to transmit real-time operational data to centralized cloud environments where advanced analytics improve production efficiency and decision-making. Cloud computing enables remote monitoring, software updates, historical trend analysis, and enterprise-wide process optimization.
Automation systems integrated with distributed control systems (DCS), programmable logic controllers (PLC), and supervisory control and data acquisition (SCADA) platforms further improve plant productivity while reducing manual intervention. Future innovations are expected to include digital twins, autonomous process optimization, edge AI computing, and self-learning analytical instruments capable of adaptive monitoring.
Application Insights
Oil & gas continues to represent the leading application segment due to increasing demand for process optimization, refinery monitoring, gas quality measurement, and environmental compliance. Process analyzers help improve operational efficiency while minimizing safety risks and reducing emissions.
Chemical manufacturing represents another significant application area as manufacturers require continuous monitoring of chemical reactions, raw materials, and product quality. Pharmaceutical companies increasingly deploy advanced analyzers to ensure strict quality control and regulatory compliance throughout manufacturing processes.
Water and wastewater treatment facilities are rapidly adopting intelligent analyzers for continuous monitoring of water quality parameters. Food & beverage manufacturers utilize process analyzers to maintain product consistency, hygiene, and compliance with food safety regulations.
Growing industrial digitalization is expected to create new opportunities across renewable energy, hydrogen production, semiconductor manufacturing, and biotechnology industries, where precision process monitoring is becoming increasingly essential.
Regional Insights
North America dominates the Process Analyzer Market due to its mature industrial automation ecosystem, advanced manufacturing infrastructure, and strong environmental regulations. The United States leads regional demand through widespread adoption of smart factories, AI-powered industrial monitoring, and investments in digital process optimization.
Europe maintains substantial market share driven by strict emission standards, sustainability initiatives, and widespread adoption of Industry 4.0 technologies. Chemical processing, pharmaceuticals, and renewable energy sectors continue driving regional investments.
Asia Pacific is projected to experience the fastest growth owing to rapid industrialization across China, India, Japan, and Southeast Asia. Government support for smart manufacturing, expanding chemical production, infrastructure development, and increasing environmental awareness are fueling market expansion.
Latin America and the Middle East & Africa continue witnessing gradual adoption as oil & gas production, mining operations, water treatment infrastructure, and industrial modernization projects increase throughout these regions.
Regional Highlights
-
North America leads global market revenue.
-
Asia Pacific records the fastest regional CAGR.
-
Europe benefits from strict industrial emission regulations.
-
Industrial digitalization supports growth across all regions.
-
Smart manufacturing investments continue expanding regional opportunities.
Country-Specific Market Trends
China (CAGR: 8%–10%) continues investing heavily in smart manufacturing, petrochemical expansion, and industrial automation under advanced manufacturing initiatives. Increasing deployment of AI-enabled industrial monitoring systems is accelerating analyzer demand.
Japan (CAGR: 6%–8%) remains a major technology innovator with strong investments in robotics, precision manufacturing, semiconductor production, and intelligent industrial automation.
United States (CAGR: 6%–7%) leads technological innovation through widespread implementation of Industrial IoT, cloud analytics, AI-driven manufacturing, and predictive maintenance platforms.
Canada (CAGR: 5%–7%) experiences increasing demand from oil sands, mining operations, environmental monitoring, and water treatment infrastructure modernization.
Mexico (CAGR: 6%–8%) benefits from expanding manufacturing activities, automotive production, and foreign investments in industrial automation.
Germany (CAGR: 5%–7%) remains Europe's industrial automation leader, supported by Industry 4.0 adoption, engineering excellence, and advanced chemical manufacturing.
France (CAGR: 5%–6%) continues investing in pharmaceutical manufacturing, energy transition projects, and sustainable industrial operations requiring advanced analytical monitoring.
Country Highlights
-
China drives Asia Pacific market expansion.
-
United States remains the global innovation leader.
-
Japan focuses on high-precision manufacturing automation.
-
Germany leads European industrial digitalization.
-
Canada and Mexico continue expanding industrial automation investments.
Key Process Analyzer Market Company Insights
Leading companies continue strengthening their competitive positions through continuous innovation, AI integration, strategic partnerships, and expansion of digital service offerings. Major market participants include Emerson Electric Co., ABB Ltd., Siemens AG, Yokogawa Electric Corporation, Endress+Hauser Group, Honeywell International Inc., Thermo Fisher Scientific Inc., AMETEK Inc., Mettler Toledo, and SICK AG.
These companies are investing significantly in cloud-enabled process analytics, intelligent sensing technologies, predictive maintenance software, and integrated industrial automation solutions. AI-enabled diagnostics, remote asset management, cybersecurity enhancements, and digital lifecycle services are becoming key competitive differentiators. Strategic collaborations with industrial software providers and automation companies are enabling comprehensive smart manufacturing ecosystems.
Company Strategy Highlights
-
Heavy investment in AI-enabled industrial analytics.
-
Expansion of cloud-connected analyzer platforms.
-
Focus on predictive maintenance capabilities.
-
Strategic acquisitions strengthen technology portfolios.
-
Development of integrated Industry 4.0 solutions.
Recent Developments
Manufacturers have introduced next-generation AI-powered gas analyzers featuring predictive diagnostics, automated calibration, and remote cloud connectivity to improve industrial process reliability and reduce maintenance costs.
Several leading automation companies have announced strategic collaborations with industrial software providers to integrate process analyzers into enterprise-wide digital manufacturing platforms, enabling real-time operational intelligence.
New laser-based spectroscopy analyzers offering higher analytical precision, lower energy consumption, and faster response times have been launched for applications in hydrogen production, carbon capture, and semiconductor manufacturing.
Market Segmentation
The Process Analyzer Market is segmented by Product, Technology, Application, and Region. Product segmentation includes gas analyzers, liquid analyzers, spectroscopic analyzers, chromatographs, and other analytical instruments. Technology segmentation covers electrochemical sensing, infrared spectroscopy, ultraviolet spectroscopy, laser-based analysis, gas chromatography, mass spectrometry, and AI-enabled smart analytical systems. Application areas include oil & gas, chemicals, pharmaceuticals, food & beverages, water & wastewater treatment, power generation, mining, and other industrial sectors. Regionally, the market covers North America, Europe, Asia Pacific, Latin America, and the Middle East & Africa, with Asia Pacific expected to demonstrate the strongest long-term growth due to industrial expansion and digital transformation initiatives.
Segmentation Highlights
-
Gas analyzers dominate product demand.
-
AI-enabled analytical systems are growing rapidly.
-
Oil & gas remains the leading application.
-
Asia Pacific offers the highest future growth potential.
-
Smart industrial automation continues driving demand across all segments.
The Process Analyzer Market is positioned for healthy long-term growth as industries increasingly prioritize operational efficiency, environmental sustainability, and digital transformation. Artificial intelligence, Industrial IoT, cloud computing, and advanced automation technologies are fundamentally reshaping industrial analytical systems by enabling predictive maintenance, autonomous process optimization, and real-time operational intelligence. With the market projected to expand from USD 8–9 billion in 2025 to approximately USD 15–17 billion by 2035, organizations investing in intelligent process monitoring technologies will be well positioned to improve productivity, reduce operational costs, ensure regulatory compliance, and achieve sustainable competitive advantages in the evolving industrial landscape.
FAQs - Process Analyzer Market
1. What is the current size of the Process Analyzer Market?
The global Process Analyzer Market is estimated at USD 8–9 billion in 2025.
2. What is the expected growth rate of the Process Analyzer Market?
The market is projected to grow at a CAGR of 6%–8% between 2025 and 2035.
3. What are the major drivers of the Process Analyzer Market?
Key growth drivers include industrial automation, AI integration, Industrial IoT adoption, predictive maintenance, stricter environmental regulations, and increasing investments in digital manufacturing.
4. Which region leads the Process Analyzer Market?
North America currently leads the global market due to advanced industrial automation, digital transformation initiatives, and strong regulatory compliance requirements.
5. Who are the leading companies in the Process Analyzer Market?
Major companies include Emerson Electric Co., ABB Ltd., Siemens AG, Yokogawa Electric Corporation, Endress+Hauser Group, Honeywell International Inc., Thermo Fisher Scientific Inc., AMETEK Inc., Mettler Toledo, and SICK AG.
 Exclusive indicates content/data unique to MarketsandMarkets and not available with any competitors.
Table of Contents
1 Introduction (Page No. - 15)
1.1 Study Objectives
1.2 Market Definition
1.3 Study Scope
1.3.1 Markets Covered
1.3.2 Years Considered for the Study
1.4 Currency & Pricing
1.5 Limitations
1.6 Stakeholders
2 Research Methodology (Page No. - 19)
2.1 Research Data
2.1.1 Secondary Data
2.1.1.1 Key Data From Secondary Sources
2.1.2 Primary Data
2.1.2.1 Key Data From Primary Sources
2.1.2.2 Key Industry Insights
2.1.2.3 Breakdown of Primaries Interviews: By Company Type, Designation, and Region
2.2 Factor Analysis
2.2.1 Introduction
2.2.2 Demand-Side Analysis
2.2.2.1 Stringent Regulations Would Drive the Demand for Process Liquid Analyzers in the Food Processing Industry
2.2.3 Supply-Side Analysis
2.2.3.1 Increase in the Number of Products Launched in the Market
2.3 Market Size Estimation
2.3.1 Bottom-Up Approach
2.3.2 Top-Down Approach
2.4 Market Breakdown and Data Triangulation
2.5 Research Assumptions
2.5.1 Assumptions
3 Executive Summary (Page No. - 29)
4 Premium Insights (Page No. - 33)
4.1 Attractive Opportunities for the Process Liquid Analyzers Market
4.2 Process Liquid Analyzers Market, By Industry
4.3 Process Liquid Analyzers Market in APAC
4.4 Life Cycle Analysis, By Geography
5 Market Overview (Page No. - 36)
5.1 Market Segmentation
5.1.1 Process Liquid Analyzer Market: By Component
5.1.2 Process Liquid Analyzer Market: By Service
5.1.3 Process Liquid Analyzer Market, By Process Analysis
5.1.4 Process Liquid Analyzer Market, By Type
5.1.5 Process Liquid Analyzer Market, By Industry
5.1.6 Process Liquid Analyzer Market, By Geography
5.2 Market Evolution
5.3 Market Dynamics
5.3.1 Drivers
5.3.1.1 Increase in the U.S. Shale Gas Production
5.3.1.2 Growing Demand for Water & Wastewater Treatment Plants in China
5.3.1.3 High Competition Among Key Players Leading to Technologically Advanced and Better-Quality Products
5.3.2 Restraints
5.3.2.1 Lack of Skilled Professionals
5.3.2.2 Declining Oil Prices
5.3.2.3 High Capital Expenditure and Infrastructure Costs
5.3.3 Opportunities
5.3.3.1 Increasing Demand for Analytical Instruments in Emerging Markets
5.3.3.2 Growth in the Pharmaceuticals Industry in India
5.3.4 Challenges
5.3.4.1 Issues Related to Instrumentation Safety
5.4 Burning Issue
5.4.1 Need for Continuous Support and Maintenance of Installed Analyzers
6 Industry Trends (Page No. - 48)
6.1 Introduction
6.2 Value Chain Analysis
6.3 Porter’s Five Forces Analysis
6.3.1 Intensity of Competitive Rivalry
6.3.2 Threat of Substitutes
6.3.3 Bargaining Power of Buyers
6.3.4 Bargaining Power of Suppliers
6.3.5 Threat of New Entrants
6.4 Strategic Benchmarking
6.4.1 Technology Integration and Product Enhancement
7 Market, By Service (Page No. - 58)
7.1 Introduction
7.2 Pre-Sale Services
7.2.1 Start-Up & Commissioning Services
7.2.2 Technical Support Services
7.3 Post-Sale Services
7.3.1 Parts & Spares Services
7.3.2 Preventive Maintenance Services
7.3.3 On-Site Training Services
8 Market, By Type (Page No. - 63)
8.1 Introduction
8.2 PH/ORP Analyzers
8.3 Conductivity Analyzers
8.4 Near-Infrared Analyzers
8.5 Turbidity Analyzers
8.6 Dissolved Oxygen Analyzers
8.7 Chlorine Analyzers
8.8 Liquid Density Analyzers
8.9 MLSS Analyzers
8.10 TOC Analyzers
8.11 Aluminum Analyzers
8.12 Ammonia Analyzers
8.13 Fluoride Analyzers
8.14 Others
9 Market, By Industry (Page No. - 93)
9.1 Introduction
9.2 Oil & Gas
9.3 Petrochemical
9.4 Pharmaceutical
9.5 Water & Wastewater
9.6 Power Generation
9.7 Food & Beverages
9.8 Semiconductor Processing
9.9 Pulp & Paper
9.10 Metal & Mining
9.11 Others
10 Market, By Geography (Page No. - 121)
10.1 Introduction
10.2 Americas
10.2.1 North America
10.2.1.1 U.S.
10.2.1.1.1 Discovery of Large Gas Shales in the U.S.
10.2.1.2 Canada
10.2.1.2.1 Process Driven Industries to Stimulate the Liquid Analyzers Growth
10.2.1.3 Mexico
10.2.1.3.1 Growing Semiconductor Exports May Further Drive the Liquid Analyzers Market
10.2.2 South America
10.3 Europe
10.3.1 Germany
10.3.1.1 Known for Manufacturing Capabilities
10.3.2 U.K.
10.3.2.1 Highest Growth Rate in the Process Liquid Analyzers Market in Europe
10.3.3 France
10.3.3.1 Third-Largest Market in the Process Liquid Analyzers Market in Europe
10.3.4 Italy
10.3.4.1 Chemicals and Food Processing Industries to Significantly Contribute to the Process Liquid Analyzers Market in Italy
10.3.5 Spain
10.3.5.1 Chemicals and Food Processing Industries to Significantly Contribute to the Process Liquid Analyzers Market in Spain
10.3.6 Rest of Europe
10.3.6.1 Growing Economic Conditions
10.4 Asia-Pacific
10.4.1 Japan
10.4.1.1 A Substantial Mature Market
10.4.2 China
10.4.2.1 Second Largest Market in the Asia-Pacific Process Liquid Analyzers
10.4.3 South Korea
10.4.3.1 Growth From Chemical & Petrochemical Industries
10.4.4 India
10.4.4.1 Prominent Growth in Food & Beverages and Water Treatment Industries
10.4.5 Rest of APAC
10.4.5.1 Australia & Indonesia are Emerging Markets With Significant Potential
10.5 Rest of the World (RoW)
10.5.1 Middle East
10.5.1.1 Israel
10.5.1.1.1 Industrial Sector May Propel the Growth of Process Liquid Analyzers Market
10.5.1.2 Saudi Arabia
10.5.1.2.1 Huge Oil & Gas Reserves Would Drive the Process Liquid Analyzers Market
10.5.1.3 Qatar
10.5.1.3.1 Petroleum & Liquefied Natural Gas Sectors are the Major Contributors for Process Liquid Analyzers Market
10.5.2 Africa
10.5.2.1 Emerging Region for Various Process Sectors
11 Competitive Landscape (Page No. - 145)
11.1 Overview
11.2 Market Ranking of Players in the Process Liquid Analyzers Market, 2015
11.3 Competitive Scenario
11.4 Recent Developments
12 Company Profiles (Page No. - 152)
(Overview, Products and Services, Financials, Strategy & Development)*
12.1 Introduction
12.2 ABB Ltd.
12.3 Endress+Hauser AG
12.4 GE Analytical Instruments
12.5 Hach Lange GmbH
12.6 Honeywell International, Inc.
12.7 Mettler-Toledo International Inc.
12.8 Teledyne Technologies, Inc.
12.9 The Emerson Electric Company
12.10 Thermo Fisher Scientific, Inc.
12.11 Yokogawa Electric Corp.
*Details on Overview, Products and Services, Financials, Strategy & Development Might Not Be Captured in Case of Unlisted Companies.
13 Appendix (Page No. - 180)
13.1 Insights of Industry Experts
13.2 Discussion Guide
13.3 Knowledge Store: Marketsandmarkets’ Subscription Portal
13.4 Introducing RT: Real Time Market Intelligence
13.5 Available Customizations
13.6 Related Reports
List of Tables (72 Tables)
Table 1 Growing Shale Gas Production in the U.S. Expected to Drive the Process Liquid Analyzers Market
Table 2 Lack of Skilled Professionals Act as A Hindrance to the Growth of the Process Liquid Analyzers Market
Table 3 Growing Demand From Emerging Markets Such as China and India Expected to Propel the Growth of the Process Liquid Analyzers Market
Table 4 Porter’s Five Forces Analysis: Threat of New Entrants has Minimum Impact on the Overall Market in 2015
Table 5 Process Liquid Analyzer Market, By Service, 2013–2022 ( USD Million)
Table 6 Process Liquid Analyzer Market, By Pre-Sale Service, 2013–2022 ( USD Million)
Table 7 Process Liquid Analyzer Market, By Post-Sale Service, 2013–2022 ( USD Million)
Table 8 Process Liquid Analyzer Market, By Type, 2013–2022 (USD Million)
Table 9 Process Liquid Analyzer Market, By Type, 2013–2022 (Thousand Units)
Table 10 PH/ORP Analyzers Market, By Industry, 2013–2022 (USD Million)
Table 11 PH/ORP Analyzers Market, By Region, 2013–2022 (USD Million)
Table 12 Conductivity Analyzer Market, By Industry, 2013–2022 (USD Million)
Table 13 Conductivity Analyzer Market, By Region, 2013–2022 (USD Million)
Table 14 Near-Infrared Analyzer Market, By Industry, 2013–2022 (USD Million)
Table 15 Near-Infrared Analyzer Market, By Region, 2013–2022 (USD Million)
Table 16 Turbidity Analyzers Market, By Industry, 2013–2022 (USD Million)
Table 17 Turbidity Analyzers Market, By Region, 2013–2022 (USD Million)
Table 18 Dissolved Oxygen Analyzers Market, By Industry, 2013–2022 (USD Million)
Table 19 Dissolved Oxygen Analyzers Market, By Region, 2013–2022 (USD Million)
Table 20 Chlorine Analyzer Market, By Industry, 2013–2022 (USD Million)
Table 21 Chlorine Analyzer Market, By Region, 2013–2022 (USD Million)
Table 22 Liquid Density Analyzers Market, By Industry, 2013–2022 (USD Million)
Table 23 Liquid Density Analyzers Market, By Region, 2013–2022 (USD Million)
Table 24 MLSS Analyzer Market, By Industry, 2013–2022 (USD Million)
Table 25 MLSS Analyzers Market, By Region, 2013–2022 (USD Million)
Table 26 TOC Analyzers Market, By Industry, 2013–2022 (USD Million)
Table 27 TOC Analyzers Market, By Region, 2013–2022 (USD Million)
Table 28 Aluminum Analyzers Market, By Industry, 2013–2022 (USD Million)
Table 29 Aluminum Analyzers Market, By Region, 2013–2022 (USD Million)
Table 30 Ammonia Analyzers Market, By Industry, 2013–2022 (USD Million)
Table 31 Ammonia Analyzers Market, By Region, 2013–2022 (USD Million)
Table 32 Fluoride Analyzers Market, By Industry, 2013–2022 (USD Million)
Table 33 Fluoride Analyzers Market, By Region, 2013–2022 (USD Million)
Table 34 Other Analyzers Market, By Industry, 2013–2022 (USD Million)
Table 35 Other Analyzers Market, By Region, 2013–2022 (USD Million)
Table 36 Market, By Industry, 2013–2022 (USD Million)
Table 37 Market, By Industry, 2013–2022 (Thousand Units)
Table 38 Market for Oil & Gas Industry, By Type, 2013–2022 (USD Million)
Table 39 Market for Oil & Gas Industry, By Region, 2013–2022 (USD Million)
Table 40 Market for Petrochemical Industry, By Type, 2013–2022 (USD Million)
Table 41 Market for Petrochemical Industry, By Region, 2013–2022 (USD Million)
Table 42 Market for Pharmaceutical Industry, By Type, 2013–2022 (USD Million)
Table 43 Market for Pharmaceutical Industry, By Region, 2013–2022 (USD Million)
Table 44 Market for Water & Wastewater Industry, By Type, 2013–2022 (USD Million)
Table 45 Market for Water & Wastewater Industry, By Region, 2013–2022 (USD Million)
Table 46 Market for Power Generation Industry, By Type, 2013–2022 (USD Million)
Table 47 Market for Power Generation Industry, By Region, 2013–2022 (USD Million)
Table 48 Market for Food & Beverages Industry, By Type, 2013–2022 (USD Million)
Table 49 Market for Food & Beverages Industry, By Region, 2013–2022 (USD Million)
Table 50 Market for Semiconductor Processing Industry, By Type, 2013–2022 (USD Million)
Table 51 Market for Semiconductor Processing Industry, By Region, 2013–2022 (USD Million)
Table 52 Market for Pulp & Paper Industry, By Type, 2013–2022 (USD Million)
Table 53 Market for Pulp & Paper Industry, By Region, 2013–2022 (USD Million)
Table 54 Market for Metal & Mining Industry, By Type, 2013–2022 (USD Million)
Table 55 Market for Metal & Mining Industry, By Region, 2013–2022 (USD Million)
Table 56 Market for Others Industry, By Type, 2013–2022 (USD Million)
Table 57 Market for Other Industries, By Region, 2013–2022 (USD Million)
Table 58 Market, By Region, 2013–2022 (USD Million)
Table 59 Americas: Process Liquid Analyzers Market, By Region, 2013–2022 (USD Million)
Table 60 North America: Process Liquid Analyzers Market, By Country, 2013–2022 (USD Million)
Table 61 Process Liquid Analyzer Market in Americas, By Industry, 2013–2022 (USD Million)
Table 62 Europe: Process Liquid Analyzers Market, By Geography, 2013–2022 (USD Million)
Table 63 Process Liquid Analyzers Market in Europe, By Industry, 2013–2022 (USD Million)
Table 64 APAC: Process Liquid Analyzers Market, By Geography, 2013–2022 (USD Million)
Table 65 Process Liquid Analyzers Market in APAC, By Industry, 2013–2022 (USD Million)
Table 66 RoW: Process Liquid Analyzers Market, By Region, 2013–2022 (USD Million)
Table 67 Middle East: Process Liquid Analyzers Market, By Country, 2013–2022 (USD Million)
Table 68 Process Liquid Analyzers Market in RoW, By Industry, 2013–2022 (USD Million)
Table 69 Market Ranking of the Top 5 Players in the Process Liquid Analyzers Market in 2015
Table 70 Contracts, Agreements, Partnerships, 2014-2015
Table 71 New Product Launches, 2014-2015
Table 72 Mergers and Acquisitions, 2014-2015
List of Figures (108 Figures)
Figure 1 Research Design & Factor Analysis
Figure 2 Product Launches in the Process Liquid Analyzers Market, 2014–2015
Figure 3 Market Size Estimation Methodology: Bottom-Up Approach
Figure 4 Market Size Estimation Methodology: Top-Down Approach
Figure 5 Data Triangulation
Figure 6 Process Liquid Analyzer Market for the Water & Wastewater Industry Expected to Witness the Highest Growth During the Forecast Period
Figure 7 PH/ORP Analyzers Expected to Have the Highest Market Value Between 2016 and 2022
Figure 8 Post-Sale Services of Process Liquid Analyzers Expected to Have High Demand During the Forecast Period
Figure 9 Process Liquid Analyzer Market, By Region, 2015
Figure 10 Increasing Adoption of Liquid Process Analyzers for Various Applications Expected to Drive the Market During the Forecast Period
Figure 11 Water & Wastewater Industry Expected to Dominate the Process Liquid Analyzers Market in 2016
Figure 12 Water & Wastewater Industry Expected to Dominate the Process Liquid Analyzers Market in APAC in 2016
Figure 13 APAC Process Liquid Analyzers Market Was at Growth Phase in 2015
Figure 14 By Geography
Figure 15 Evolution of the Process Analyzer Market
Figure 16 Market Dynamics: Overview
Figure 17 Shale Gas Production in Us, 2009-2014
Figure 18 Decline in Oil Prices, 2014-2015
Figure 19 Value Chain Analysis: Major Value is Added During the Manufacturing and Assembly Phases
Figure 20 Porter’s Five Forces Analysis (2015):
Figure 21 Process Liquid Analyzer Market: Porter’s Five Forces Analysis
Figure 22 Intensity of Competitive Rivalry: Medium Competition in the Market Due to Presence of Large and Established Companies
Figure 23 Threat of Substitutes Would Be Medium Due to Unavailability of A Direct Substitute Technology
Figure 24 Bargaining Power of Buyers is Medium Due to the Availability of Numerous Players in the Process Liquid Analyzers Market
Figure 25 Bargaining Power of Suppliers is Low Due to the Presence of Major Players
Figure 26 New Entrants are Less Likely to Enter This Market Due to the High Capital Requirements and Technological Costs
Figure 27 Strategic Benchmarking: Key Players Largely Adopted Organic Growth Strategies for New Product and Technology Development
Figure 28 Process Liquid Analyzers Market, By Service
Figure 29 Start-Up & Commissioning Services Expected to Have the Highest Demand During the Forecast Period
Figure 30 Parts & Spare Services Expected to Have the Highest Demand Between 2016 and 2022
Figure 31 Process Liquid Analyzers Market, By Type
Figure 32 PH/ORP Analyzers Typeexpected to Hold the Largest Market Size in Terms of Value of the Process Liquid Analyzer Market During the Forecast Period
Figure 33 Water & Wastewater Indsutry is Expected to Hold the Largest Market Size for PH/ORP Analyzers During the Forecast Period
Figure 34 Americas Expected to Hold the Larget Market Size Forph/ORP Analzyers During the Forecast Period
Figure 35 Water & Wastewater Industry Estimated to Hold the Largest Market Size for Conducitivty Analyzers Between 2016 and 2022
Figure 36 Conductivity Analyzers are Expected to Dominate the Process Liquid Analyzers Market in Americas Between 2016 and 2020
Figure 37 The Near-Infrared Analyzers Market for Petrochemical Industry Estimated to Grow at the Highest CAGR During the Forecast Period
Figure 38 The Near-Infrared Analyzers Market in APAC Expected to Witness the Highest CAGR Between 2016 and 2022
Figure 39 Turbidity Analyzers Expected to Dominate the Market for Water & Wastewater Industry in During the Forecast Period
Figure 40 The Turbidity Analyzer Market in APAC Estimated to Witness the Highest CAGR Between 2016 and 2022
Figure 41 The Dissolved Oxygen Analzyers Market for Water & Wastewater Industry Expected to Grow at the Highest Rate During the Forecast Period
Figure 42 Americas Expected to Dominate the Dissolved Oxygen Analyzers Market Between 2016 and 2022
Figure 43 The Chlorine Analyzers Market for Water & Wastewater Industry is Estimated to Grow at the Highest Rate During the Forecst Period
Figure 44 The Chlorine Analyzers Market in APAC Estimated to Witness the Highest Growth Rate During the Forecast Period
Figure 45 The Liquid Density Analyzers Market in APAC Estimated to Grow at the Highest Rate Between 2016 and 2022
Figure 46 Americas is Estimated to Dominate the MLSS Analyzers Market During the Forecast Period
Figure 47 Water & Wastewater Industry is Estimated to Grow at the Highest CAGR Rate in the TOC Analyzers Market During the Forecast Period
Figure 48 The TOC Analyzers Market in APAC Estimated to Grow at the Highest Rate During the Forecast Period
Figure 49 Americas Estimated to Dominatethe Aliminium Analyzers Market Between 2016 and 2022
Figure 50 The Ammonia Analyzers Market in APAC Expected to Grow at the Highest Rate During the Forecast Period
Figure 51 Americas Expected to Dominate the Fluoride Analyzers Market During the Forecast Period
Figure 52 Process Liquid Analyzer Market: Segmentation
Figure 53 Water & Wastewater Industry Expected to Dominate the Process Liquid Analyzers Market Between 2016 and 2022
Figure 54 PH/ORP Analyzers Expected to Dominate the Market for Oil & Gas Industry During the Forecast Period
Figure 55 The Market in APAC for Oil & Gas Industry Expected to Witness the Highest Growth Rate During the Forecast Period
Figure 56 Near-Infrared Analyzers Market for Petrochemical Industry Expected to Grow at the Highest Ratebetween 2016 and 2022
Figure 57 Americas Expected to Dominate the Market for Petrochemical Industry Between 2016 and 2022
Figure 58 PH/ORP Analyzers Market in Pharmaceutical Industry Expected to Grow at the Highest Rate During the Forecast Period
Figure 59 APAC Market for Pharmaceutical Industryexpected to Grow at the Highest Rate Between 2016 and 2022
Figure 60 PH/ORP Analyzers Market for Water & Wastewater Industry Expected to Grow at the Highest Ratebetween 2016 and 2022
Figure 61 Americas is Expected to Dominate the Market for Water & Wastewater Industry During the Forecast Period
Figure 62 TOC Analyzers Expected to Dominate the Market for Power Generation Industry During the Forecast Period
Figure 63 APAC Market for Power Generation Industry Expected to Grow at the Highest Rate Between 2016 and 2022
Figure 64 Conductivity Analyzers Market for Food & Beverages Industry Expected to Grow at the Highest Rate During the Forecast Period
Figure 65 Americas Expected to Dominate the Market Forfood & Beverages Industry During the Forecast Period
Figure 66 TOC Analyzers Expected to Dominate the Market Forsemiconductor Processing Industry Between 2016 and 2022
Figure 67 APAC Market for Semiconductor Processing Industry Expected to Grow at the Highest Rate Between 2016 and 2022
Figure 68 PH/ORP Analyzers Marketfor Pulp & Paper Industry Expected to Grow at the Highest CAGR During the Forecast Period
Figure 69 Americas is Expected to Dominate the Market for Pulp & Paper Industry During the Forecast Period
Figure 70 Conductivity Analyzers Expected to Dominate the Market for Metal & Mining Industry Between 2016 and 2022
Figure 71 APAC Market for Metal & Mining Industry Expected to Grow at the Highest Rate Between 2016 and 2022
Figure 72 PH/ORP Analyzers Market for Other Industries is Expected to Grow at the Highest Rate Between 2016 and 2022
Figure 73 APAC Market for Other Industries Expected to Witness the Highest Growth Rate During the Forecast Period
Figure 74 Process Liquid Analyzers Market, By Region
Figure 75 Americas Expected to Dominate the Global Process Liquid Analyzers Market During the Forecast Period
Figure 76 Snapshot of the Process Liquid Analyzers Market in the Americas: Expected to Be Driven By the Growing Demand From Water & Wastewater and Food & Beverage Industries During the Forecast Period
Figure 77 The Process Liquid Analyzers Market in the Americas
Figure 78 The Process Liquid Analyzers Market in the U.S. Expected to Hold the Largest Market Value During the Forecast Period
Figure 79 Water & Wastewater Industry Expected to Dominate the Americas Process Liquid Analyzers Market Between 2016 and 2022
Figure 80 Snapshot of the Process Analyzers Market in Europe: Demand to Be Driven By the Potential Growth Opportunities Pertaining to the Water & Wastetwater Treatment Plants
Figure 81 The Process Liquid Analyzers Market in Europe
Figure 82 U.K. Expected to Witness the Highest Growth Rate in the Process Liquid Analyzers Market in Europe Between 2016 and 2022
Figure 83 Water & Wastewater to Hold the Largest Market for Process Liquid Analyzers in Europe During the Forecast Period
Figure 84 APAC Market Snapshot: Demand to Be Driven By the Growing Usage of Process Liquid Analyzers in Food & Beverages Industry
Figure 85 The Process Liquid Analyzers Market in Asia-Pacific
Figure 86 India Expected to Witness the Highest Growth Rate in the Process Liquid Analyzers Market in APAC Between 2016 and 2022
Figure 87 The Process Liquid Analyzer Markets in the RoW
Figure 88 Middle East to Hold the Largest Market for Process Liquid Analyzers Market in RoW During the Forecast Period
Figure 89 Qatar Expected to Witness the Highest Growth Rate in the Process Liquid Analzyers Market in Middle East Between 2016 and 2022
Figure 90 Key Growth Strategies Adopted By the Top Companies Between 2013 and 2015
Figure 91 Market Evaluation Framework: New Product Launches Fuelled the Growth and Innovation in 2014 and 2015
Figure 92 Battle for Market Share: Contracts, Agreements, & Partnerships Was the Key Strategy
Figure 93 Geographic Revenue Mix of Major Players in the Process Liquid Analyzers Market, 2014
Figure 94 ABB Ltd.: Company Snapshot
Figure 95 ABB Ltd: SWOT Analysis
Figure 96 Endress+Hauser AG: Company Snapshot
Figure 97 Hach Lange GmbH: SWOT Analysis
Figure 98 Honeywell International, Inc.: Company Snapshot
Figure 99 Mettler-Toledo International Inc.: Company Snapshot
Figure 100 Mettler-Toledo International Inc.: SWOT Analysis
Figure 101 Teledyne Technologies, Inc.: Company Snapshot
Figure 102 The Emerson Electric Company: Company Snapshot
Figure 103 The Emerson Electric Company: SWOT Analysis
Figure 104 Thermo Fisher Scientific, Inc.: Company Snapshot
Figure 105 Yokogawa Electric Corp.: Company Snapshot
Figure 106 Yokogawa Electric Corp.: SWOT Analysis
Figure 107 Marketsandmarkets Knowledge Store Snapshot
Figure 108 Marketsandmarkets Knowledge Store: Semiconductor & Electronics Industry Snapshot
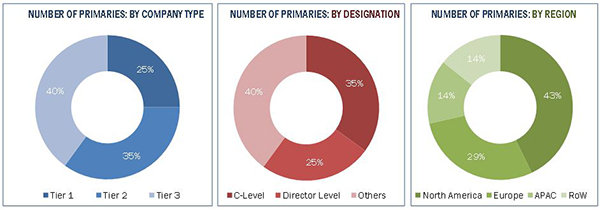
The research methodology used to estimate and forecast the process analyzer market (liquid) begins with gathering data on key vendor revenues through secondary research. The top-down and bottom-up approaches have been used to estimate and validate the size of the global process analyzers market (liquid). The research methodology also includes the study of annual and financial reports of top market players as well as interviews of industry experts (such as CEOs, VPs, directors, and marketing executives) for key insights (both, quantitative and qualitative) on the process analyzers market (liquid). All percentage shares, splits, and breakdowns have been determined by using secondary sources and verified through primary sources. The data triangulation and market breakdown procedures have been employed to complete the overall market engineering process and arrive at the exact statistics for all segments and subsegments. The breakdown of profiles of primary is depicted in the following figure.
To know about the assumptions considered for the study, download the pdf brochure
The process analyzers (liquid) ecosystem comprises hardware component manufacturers, prototype designers, software developers, and original equipment manufacturers (OEMs). The prototype designers design process equipment pertaining to the industry needs, and the hardware component manufacturers provide I/O boards, power supply units, and process probes among others. The software developers provide analytical software solutions required for automated control of instrumentation, data acquisition, and analysis. The OEMs integrate these hardware and software components into final product.
Target Audience of the Report:
The intended audience for this report includes:
- Process analyzer (liquid) equipment products and solutions providers
- Process analyzer (liquid) systems related service providers
- Research organizations and consulting companies
- Associations, organizations, forums, and alliances related to process liquid analyzers
- Government bodies such as regulating authorities and policy makers
- Venture capitalists, private equity firms, and start-up companies
- End-users who want to know more about the process liquid analyzers market
Scope of the Report:
This report categorizes the global process analyzers market (liquid) on the basis of type, industry, service, and geography.
By Type:
- pH/ORP Analyzers
- Conductivity Analyzers
- Near-Infrared Analyzers
- Turbidity Analyzers
- Dissolved Oxygen Analyzers
- Chlorine Analyzers
- Liquid Density Analyzers
- MLSS Analyzers
- TOC Analyzers
- Aluminum Analyzers
- Ammonia Analyzers
- Fluoride Analyzers
- Others
By Industry:
- Oil & Gas
- Petrochemical
- Pharmaceuticals
- Water & Wastewater
- Power Generation
- Food & Beverages
- Semiconductor Processing
- Pulp & Paper
- Metal & Mining
- Others
By Service:
-
Pre-Sales
- Start-Up & Commissioning Services
- Technical Support Services
-
Post-Sales
- Parts & Spares Services
- Preventive Maintenance Services
- On-Site Training Services
Available customizations:
With the given market data, MarketsandMarkets offers customizations as per the company’s specific needs. The following customization options are available for the report:
Market Analysis
- Further breakdown of the global process analyzers market (liquid), by geography
Company Information
- Detailed analysis and profiling of additional market players (up to five)













Growth opportunities and latent adjacency in Process Analyzer Market