Location of Things Market by Location Type (Indoor, Outdoor), Application (Mapping & Navigation, Location-Based Social Media Monitoring, IoT Asset Management, IoT Location Intelligence), Vertical, and Region - Global Forecast to 2022


[145 Pages Report] The overall location of things market is expected to grow from USD 5.47 billion in 2017 to USD 27.23 billion by 2022, at a CAGR of 37.9% from 2017 to 2022. The key factors contributing to the growth of the market include the commercialization of location-based services, increasing use of location-based applications across various verticals, evolution of IoT, and increase in the adoption of cloud-based technology. Location-based technology is adopted by numerous organizations across the globe to minimize complexities in the organization�s ecosystem and to maximize operational efficiency within the organization. The base year considered for the study is 2016, and the forecast has been provided for the period between 2017 and 2022.
Location of Things Market Dynamics
Drivers
- Increasing importance of spatial data
- Commercialization of Location based services
- Democratization of geospatial data for IoT applications
- Increasing use of location-based applications across different industry verticals
Restraints
- Privacy Issues regarding user identity
Opportunities
- Increase in the adoption of cloud based technology
- Evolution of IoT
- Real-time location data analysis and asset management
Challenges
- Information security concerns
Increasing importance of spatial data drives the global location of things market
Spatial data or geospatial data is a graphic representation of data that helps to understand or interpret data from across the globe. Industries using traditional tools for the operations or marketing purpose face difficulties in analyzing proper location-based data. With technological advancements, organizations are focusing towards the use of spatial data from general data which significantly drives the location of things market. The International Telecommunication Union (ITU) estimates that currently 40% of the global population is connected to the Internet and roughly 57% will be connected by 2019. This increase in connectivity will lead to a larger base of individuals interested in purchasing IoT devices. Large amounts of data are being generated with the increase in the use of connected devices across verticals. Increasing awareness among business executives about the benefits of location-based services and real-time location analytics has further bolstered the use of spatial data. The use of connected location-based spatial data reduces the time taken and helps avoid poor decision-making in an organization. The increasing use of spatial data, GIS & database tools, and web mapping has been driving the market. The concept of Spatial Data Infrastructure (SDI) was introduced to encompass the efficient and effective collation, management, access, and use of spatial data.
The following are the major objectives of the study.
- To define, describe, and forecast the location of things market based on location type, application, vertical, and region
- To provide detailed information regarding the key factors influencing the market growth (drivers, restraints, opportunities, and challenges)
- To analyze micro-markets with respect to individual growth trends, prospects, and contribution to the total market
- To forecast the market size of market segments based on location type, application, vertical with respect to five main regions, namely, North America, Europe, Asia-Pacific (APAC), Middle East & Africa (MEA), and Latin America
- To analyze opportunities in the market for stakeholders and to draw a competitive landscape of the market
- To profile key players in the market and comprehensively analyze their core competencies
- To track and analyze competitive developments, such as mergers & acquisitions (M&A), new product developments, and research and development (R&D) activities in the market
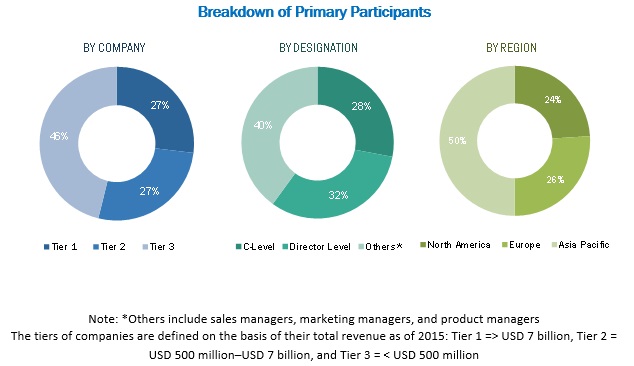
During this research study, major players operating in the location of things market in various regions have been identified, and their offerings, regional presence, and distribution channels have been analyzed through in-depth discussions. Top-down and bottom-up approaches have been used to determine the overall market size. Sizes of the other individual markets have been estimated using the percentage splits obtained through secondary sources such as Hoovers, Bloomberg BusinessWeek, and Factiva, along with primary respondents. The entire procedure includes the study of the annual and financial reports of the top market players and extensive interviews with industry experts such as CEOs, VPs, directors, and marketing executives for key insights (both qualitative and quantitative) pertaining to the market. The figure below shows the breakdown of the primaries on the basis of the company type, designation, and region considered during the research study.
To know about the assumptions considered for the study, download the pdf brochure
The location of things market comprises a network of players involved in the research and product development; raw material supply; component manufacturing; distribution and sale; and post-sales services. Key players considered in the analysis of the market are Bosch Software Innovations GmbH (Germany), Google, Inc. (Alphabet, Inc.) (US), IBM Corporation (US), Microsoft Corporation (US), ESRI (US), Qualcomm Technologies, Inc. (US), Wireless Logic (UK), Ubisense Group Plc (UK), Pitney Bowes (US), HERE (US), Telogis (US), TIBCO Software, Inc. (US), GoBabl (US), Zebra Technologies (US), Awarepoint Corporation (US), Navigine (US), and Geofeedia (US). These Location of Things Solutions Vendors are rated and listed by us on the basis of product quality, reliability, and their business strategy. Please visit 360Quadrants to see the vendor listing of Location of Things Solutions.
Major Market Developments
- In September 2016, GE (US) collaborated with Bosch Software Innovations (Germany) to focus on technology interoperability and platform integration through GE�s Predix operating system and the Bosch IoT Suite.
- In November 2016, Google launched Tango, an augmented reality system for smartphones.
- In August 2016, IBM and VMware (U.S.) expanded their partnership to develop solutions to enable organizations to quickly and easily move enterprise workloads to the cloud. With more than 500 clients engaged, the global partnership between IBM and VMware is helping more organizations extend existing workloads to the cloud in hours, versus weeks or months.
Target Audience:
- LBS Application Developers
- Network Providers
- Wireless Infrastructure Providers
- Mobile Content Developers and Aggregators
- Mobile Commerce and Advertising Companies
- Smart Devices Manufacturers
- Consumer Electronics Manufacturers
- Investors and Venture Capitalists
Report Scope
By Location Type:
- Indoor Location
- Outdoor Location
Location of Things Market By Application
- Mapping & Navigation
- Location-based Customer Engagement & Advertising Platform
- Location-based Social Media Monitoring
- IoT Asset Management
- Location Intelligence
By Vertical:
- BFSI
- Defense
- Government & Public Utilities
- Healthcare & Life Sciences
- Industrial Manufacturing
- Media & Entertainment
- Retail & E-Commerce
- Transportation & Logistics
- Others
By Geography
- North America
- Europe
- Asia Pacific
- Middle East & Africa
- Latin America
Critical questions which the report answers
- What are new application areas which the location of things solution vendors are exploring?
- Which are the key players in the market and how intense is the competition?
Available Customizations
Based on the given market data, MarketsandMarkets offers customizations in the reports as per the client�s specific requirements. The available customization options are as follows:
Geographic Analysis
- Further breakdown of the North American location of things market into countries such as the US and Canada
- Further breakdown of the Europe market into countries such as Germany, the UK, and France
- Further breakdown of the Asia-Pacific market into countries, such as India, China, Japan, and others
Company Information
- Detailed analysis and profiling of additional market players (Up to 5)
The overall location of things market is expected to grow from USD 5.47 billion in 2017 to USD 27.23 billion by 2022, at a CAGR of 37.9% from 2017 to 2022. Increasing importance of spatial data; commercialization of Location based services; democratization of geospatial data for IoT applications; and increasing use of location-based applications across different industry verticals are the key factors driving the growth of this market.
Internet of Things (IoT) acts as an unprecedented tool to bring business transformation and business disruption. IoT enables organizations to achieve efficiency to their existing business processes. Furthermore, adding a Where and when component to IoT utilities adds new context to the information. Location of IoT or location of things or Geo IoT encompasses the ability of �things� to detect, communicate and analyze their geographic position.
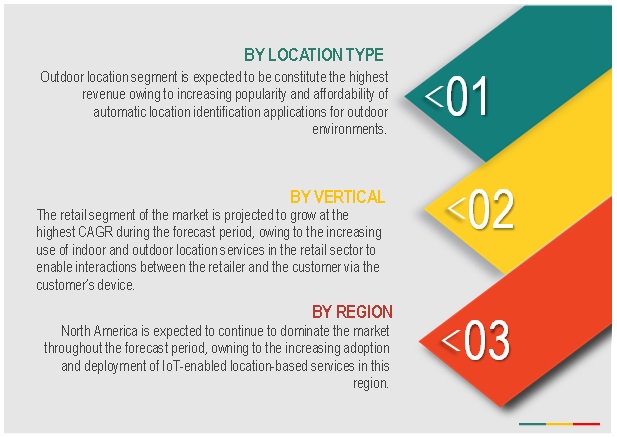
The location of things market has been segmented, on the basis application, into mapping & navigation; location-based customer engagement & advertising platform; location-based social media monitoring; IoT asset management; and location intelligence. The market for IoT location intelligence application is expected to grow at the highest CAGR between 2017 and 2022, owing to increasing use of IoT location intelligence as a tool to get competitive advantage and make insightful business decisions. Furthermore, increasing use of IoT location intelligence for mobile advertising, business planning, and social media marketing has fueled the market growth for the segment.
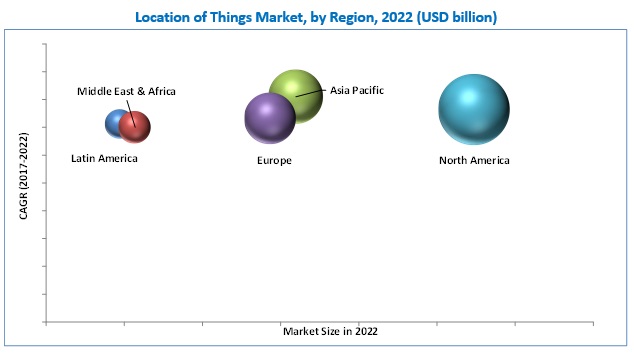
The location of things market in Asia Pacific is expected to grow at the highest CAGR during the forecast period. The geospatial industry across economies such as India, China, Japan, and Malaysia, The Philippines, and New Zealand are undergoing massive transformation. The government across these regions are highly investing in various projects related to the deployment of location-based services and infrastructural projects to promote productivity and economic growth. These factors in turn fuel the market in this region.
Increasing use of location-based applications across different industry verticals drive the growth of location of things market
Government & Public Utilities
Government & public utilities have started using the location of things to exploit the geographic location intelligence. Location-based technology helps integrate location intelligence software with geospatial, IoT, and business data, such as census data, tax information, and video surveillance files. The integration of GIS and interactive mapping technology offers comprehensive solutions for facilities and workforce management. Government & public sector typically operate in an environment marked by severe resource constraints, along with requirements to maintain accountability while observing data security regulations. The sector contains a lot of personal data of users from different regions; the technology will help them streamline the processes. Location-based technologies help the government in the U.S. during elections and redistricting. Oil & gas and mining organizations use location-based solutions to drive operational efficiencies, reduce costs, increase sales & marketing, and manage quality, safety, and risk through the IoT connectivity when integrated with location-based technology. It provides real-time visibility, evacuation monitoring, employee visibility, distress alerting, access control, and gas exposure detection. These systems also track and record the movements of engineers and workers on rigs & mine's based out of different parts of location, and can also save lives of workers using the technology.
Retail
Location of things in retail can be defined as an interconnected system of devices and sensors that retailers use to streamline business through identifying the location of inventory, assets, and even human resources. Thus, location-based solutions are becoming necessary for retailers to understand customer requirements and their purchasing behavior, for improving business strategies and operations to provide a better customer experience.
Transportation & Logistics
The industry requires a transparency and real-time visibility of its activities, which includes asset management, warehouse management, inventory control, workforce management, and transportation. In transportation & logistics, location-based solutions when integrated with IoT technology will improve the operations and business processes. Location-based technology helps optimize transport routes by integrating valuable information such as the property of the vehicle, road network & traffic regulations, and expected delivery time. The technology contributes to the more efficient use of fleet management by increasing the number of distribution points for routes that have extra capacity. In this sector, the technology is used for network planning, actionable operational intelligence, and sales & marketing.
Defense
Location-based technology is widely adopted by the defense sector across the globe for asset tracking & management develops systems and metrics to track location & performance of service military personnel, defense fleet vehicles, and other service assets. All the assets are well equipped with IoT connectivity, resulting in real-time monitoring of all the defense equipment. Location-based data can be used by firms in the defense sector to optimize the execution of service delivery, by helping them allocate their resources required for field services. Asset and defense personnel tracking & management is the ability to measure the benefits of technology deployment and use the results to improve key internal processes. A sophisticated GIS with the help of IoT connectivity, enriched with visualization and analytic tools, can help in gaining better insights. The location of things in this vertical include high-performance algorithms that search through data for geographical behavior and time-based patterns.
Critical questions the report answers:
- Where will all these developments take the industry in the mid to long term?
- What are the upcoming industry applications for location of things?
Privacy Issues regarding user identity is the major factor restraining the growth of the market. The increasing interconnectivity of IoT enabled devices collecting and sharing customer generated data significantly increases the number of potential vulnerabilities within a system. Users have to deal with networks which are outside secure organization networks. These outside networks may not be strongly protected and may generate false information. Also, government agencies, data collectors, and hackers may get unauthorized access to critical information while in transit. This not only interferes with the privacy of the concerned individual, but also poses a security threat to the same.
Organizations extract a user�s data to provide them with suitable offers but in some cases, users receive inappropriate offers due to mistaking their location. A study presented by Pew Research Center in 2015 showed that 35% users turn off their location-tracking feature due to privacy concerns. Users are worried that organizations are selling their location-based data to third parties. Information beyond business use should not be allowed to be accessed by the organization�s server as personal information might get passed on to non-intended recipients, which might be misused and eventually cause a security breach. Such instances, where users keep their location-tracking off or fear a data breach, might restrain the location of things market.
Key players in the location of things market include Bosch Software Innovations GmbH (Germany), Google, Inc. (Alphabet, Inc.) (US), IBM Corporation (US), Microsoft Corporation (US), ESRI (US), Qualcomm Technologies, Inc. (US), Wireless Logic (UK), Ubisense Group Plc (UK), Pitney Bowes (US), HERE (US), Telogis (US), TIBCO Software, Inc. (US), GoBabl (US), Zebra Technologies (US), Awarepoint Corporation (US), Navigine (US), and Geofeedia (US). These players are increasingly undertaking mergers and acquisitions, and product launches to develop and introduce new technologies and products in the market.
To speak to our analyst for a discussion on the above findings, click Speak to Analyst
 Exclusive indicates content/data unique to MarketsandMarkets and not available with any competitors.
Table of Contents
1 Introduction (Page No. - 16)
1.1 Objectives of the Study
1.2 Market Definition
1.3 Market Scope
1.4 Years Considered for the Study
1.5 Currency
1.6 Stakeholders
2 Research Methodology (Page No. - 19)
2.1 Research Data
2.1.1 Secondary Data
2.1.2 Primary Data
2.1.2.1 Breakdown of Primaries
2.1.2.2 Key Industry Insights
2.2 Market Size Estimation
2.3 Research Assumptions & Limitations
2.3.1 Limitations
3 Executive Summary (Page No. - 26)
4 Premium Insights (Page No. - 29)
4.1 Attractive Market Opportunities in the Location of Things Market
4.2 Market By Vertical & Region
4.3 Market By Region
5 Market Overview (Page No. - 32)
5.1 Introduction
5.2 Market Dynamics
5.2.1 Drivers
5.2.1.1 Increasing Importance of Geospatial Data
5.2.1.2 Commercialization of Location-Based Services
5.2.1.3 Democratization of Geospatial Data for IoT Applications
5.2.1.4 Increasing Use of Location-Based Applications Across Various Verticals
5.2.2 Restraints
5.2.2.1 Privacy Issues Regarding User Identity
5.2.3 Opportunities
5.2.3.1 Increase in the Adoption of Cloud-Based Technology
5.2.3.2 Evolution of IoT
5.2.3.3 Real-Time Location Data Analysis and Asset Management
5.2.4 Challenges
5.2.4.1 Security Concerns
6 Industry Trends (Page No. - 38)
6.1 Introduction
6.2 Evolution
6.3 Value Chain Analysis
6.4 Strategic Benchmarking
6.4.1 New Product Development
6.4.2 Partnerships & Acquisitions
7 Location of Things Market Analysis, By Location Type (Page No. - 43)
7.1 Introduction
7.2 Indoor Location
7.3 Outdoor Location
8 Market By Application (Page No. - 47)
8.1 Introduction
8.2 Mapping & Navigation
8.3 Location-Based Customer Engagement & Advertising Platform
8.4 Location-Based Social Media Monitoring
8.5 IoT Asset Management
8.6 IoT Location Intelligence
9 Location of Things Market, By Vertical (Page No. - 53)
9.1 Introduction
9.2 Defense
9.3 Government & Public Utilities
9.4 Healthcare & Life Science
9.5 Industrial Manufacturing
9.6 Media & Entertainment
9.7 Retail
9.8 Transportation & Logistics
9.9 BFSI
9.10 Other Verticals
10 Regional Analysis (Page No. - 64)
10.1 Introduction
10.2 North America
10.3 Europe
10.4 Asia-Pacific
10.5 Middle East & Africa (MEA)
10.6 Latin America
11 Competitive Landscape (Page No. - 84)
11.1 Introduction
11.1.1 Vanguards
11.1.2 Innovator
11.1.3 Dynamic
11.1.4 Emerging
11.2 Competitive Benchmarking
11.2.1 Product Offering
11.2.2 Business Strategy
12 Company Profiles (Page No. - 88)
(Overview, Financials, Products & Services, Strategy, and Developments)*
12.1 Bosch Software Innovations GmbH
12.2 Google, Inc. (Alphabet, Inc.)
12.3 IBM Corporation
12.4 Microsoft Corporation
12.5 ESRI
12.6 Qualcomm Technologies, Inc.
12.7 Wireless Logic
12.8 Ubisense Group PLC.
12.9 Pitney Bowes
12.10 Here
12.11 Telogis
12.12 Tibco Software, Inc.
12.13 Gobabl
12.14 Zebra Technologies
12.15 Awarepoint Corporation
12.16 Navigine
12.17 Geofeedia
*Details on Overview, Financials, Product & Services, Strategy, and Developments Might Not Be Captured in Case of Unlisted Companies.
13 Appendix (Page No. - 136)
13.1 Industry Experts
13.2 Discussion Guide
13.3 Knowledge Store: Marketsandmarkets� Subscription Portal
13.4 Introducing RT: Real-Time Market Intelligence
13.5 Available Customizations
13.6 Related Reports
13.7 Author Details
List of Tables (61 Tables)
Table 1 Location of Things Market Size, By Location Type, 2015-2022 (USD Million)
Table 2 Indoor Location: Market Size, By Region, 2015-2022 (USD Million)
Table 3 Indoor Location: Market Size, By Vertical, 2015-2022 (USD Million)
Table 4 Outdoor Location: Market Size, By Region, 2015-2022 (USD Million)
Table 5 Outdoor Location: Market Size, By Vertical, 2015-2022 (USD Million)
Table 6 Market Size, By Application, 2015-2022 (USD Million)
Table 7 Mapping & Navigation: Market Size, By Region, 2015-2022 (USD Million)
Table 8 Location-Based Customer Engagement & Advertising Platform: Market Size, By Region, 2015-2022 (USD Million)
Table 9 Location-Based Social Media Monitoring: Market Size, By Region, 2015-2022 (USD Million)
Table 10 IoT Asset Management: Market Size, By Region, 2015-2022 (USD Million)
Table 11 IoT Location Intelligence: : Market Size, By Region, 2015-2022 (USD Million)
Table 12 Location of Things Market Size, By Vertical, 2015-2022 (USD Million)
Table 13 Defense: Market Size, By Region, 2015-2022 (USD Million)
Table 14 Defense: Market Size, By Location Type, 2015-2022 (USD Million)
Table 15 Government & Public Utilities: Market Size, By Region, 2015-2022 (USD Million)
Table 16 Government & Public Utilities: Market Size, By Location Type, 2015-2022 (USD Million)
Table 17 Healthcare & Life Science: Market Size, By Region, 2015-2022 (USD Million)
Table 18 Healthcare & Life Science: Market Size, By Location Type, 2015-2022 (USD Million)
Table 19 Industrial Manufacturing: Market Size, By Region, 2015-2022 (USD Million)
Table 20 Industrial Manufacturing: Market Size, By Location Type, 2015-2022 (USD Million)
Table 21 Media & Entertainment: Market Size, By Region, 2015-2022 (USD Million)
Table 22 Media & Entertainment: Market Size, By Location Type, 2015-2022 (USD Million)
Table 23 Retail: Location of Things Market Size, By Region, 2015-2022 (USD Million)
Table 24 Retail: Market Size, By Location Type, 2015-2022 (USD Million)
Table 25 Transportation & Logistics: Market Size, By Region, 2015-2022 (USD Million)
Table 26 Transportation & Logistics: Market Size, By Location Type, 2015-2022 (USD Million)
Table 27 BFSI: Market Size, By Region, 2015-2022 (USD Million)
Table 28 BFSI: Market Size, By Location Type, 2015-2022 (USD Million)
Table 29 Other Verticals: Market Size, By Region, 2015-2022 (USD Million)
Table 30 Other Verticals: Market Size, By Location Type, 2015-2022 (USD Million)
Table 31 Location of Things Market Size, By Region, 2015�2022 (USD Million)
Table 32 North America: Market Size, By Location Type, 2015�2022 (USD Million)
Table 33 North America: Indoor Location Market Size, By Vertical, 2015�2022 (USD Million)
Table 34 North America: Outdoor Location Market Size, By Vertical, 2015�2022 (USD Million)
Table 35 North America: Market Size, By Application, 2015�2022 (USD Million)
Table 36 North America Market Size, By Vertical, 2015�2022 (USD Million)
Table 37 North America: Market Size, By Retail, 2015�2022 (USD Million)
Table 38 Europe Location of Things Market Size, By Location Type, 2015�2022 (USD Million)
Table 39 Europe: Indoor Location Market Size, By Vertical, 2015�2022 (USD Million)
Table 40 Europe: Outdoor Location Market Size, By Vertical, 2015�2022 (USD Million)
Table 41 Europe Market Size, By Application, 2015�2022 (USD Million)
Table 42 Europe Market Size, By Vertical, 2015�2022 (USD Million)
Table 43 Europe: Market Size, By Retail, 2015�2022 (USD Million)
Table 44 Asia-Pacific Market Size, By Location Type, 2015�2022 (USD Million)
Table 45 Asia-Pacific: Indoor Location Market Size, By Vertical, 2015�2022 (USD Million)
Table 46 Asia-Pacific: Outdoor Location Market Size, By Vertical, 2015�2022 (USD Million)
Table 47 Asia-Pacific Market Size, By Application, 2015�2022 (USD Million)
Table 48 Asia-Pacific Market Size, By Vertical, 2015�2022 (USD Million)
Table 49 Asia-Pacific: Market Size, By Retail, 2015�2022 (USD Million)
Table 50 Middle East & Africa: Market Size, By Location Type, 2015�2022 (USD Million)
Table 51 Middle East & Africa: Indoor Location Market Size, By Vertical, 2015�2022 (USD Million)
Table 52 Middle East & Africa: Outdoor Location Size, By Vertical, 2015�2022 (USD Million)
Table 53 Middle East & Africa Market Size, By Application, 2015�2022 (USD Million)
Table 54 Middle East & Africa Market Size, By Vertical, 2015�2022 (USD Million)
Table 55 Middle East & Africa: Market Size, By Retail, 2015�2022 (USD Million)
Table 56 Latin America Location of Things Market Size, By Location Type, 2015�2022 (USD Million)
Table 57 Latin America: Indoor Location Market Size, By Vertical, 2015�2022 (USD Million)
Table 58 Latin America: Outdoor Location Market Size, By Vertical, 2015�2022 (USD Million)
Table 59 Latin America Market Size, By Application, 2015�2022 (USD Million)
Table 60 Latin America Market Size, By Vertical, 2015�2022 (USD Million)
Table 61 Latin America: Market Size, By Retail, 2015�2022 (USD Million)
List of Figures (60 Figures)
Figure 1 Location of Things Market: Market Segmentation
Figure 2 Research Design
Figure 3 Breakdown of Primary Interviews: By Company, Designation, and Region
Figure 4 Data Triangulation
Figure 5 Bottom-Up Approach
Figure 6 Top-Down Approach
Figure 7 Market: Assumptions
Figure 8 The Outdoor Location Segment is Expected to Lead the Market in the Terms of Market Size During the Forecast Period
Figure 9 The IoT Location Intelligence Segment is Expected to Grow at the Highest CAGR During the Forecast Period
Figure 10 The Retail Vertical Segment is Projected to Grow at the Highest CAGR During the Forecast Period
Figure 11 North America is Expected to Contribute Highest Market Share By 2022
Figure 12 Increasing Need to Integrate Location-Based Services With IoT Applications is Expected to Fuel the Growth of the Location of Things Market
Figure 13 North America: the Indoor Location Segment is Projected to Grow at A Higher CAGR During the Forecast Period
Figure 14 Europe: the IoT Location Intelligence Segment is Estimated to Contribute Highest Market Share in 2017
Figure 15 Asia Pacific: the Retail Segment is Projected to Grow at the Highest CAGR During the Forecast Period
Figure 16 The Government & Public Utilities Segment is Estimated to Be the Largest Segment of the Market in 2017
Figure 17 The Market in Asia-Pacific is Projected to Grow at the Highest CAGR During the Forecast Period
Figure 18 Drivers, Restraints, Opportunities, and Challenges
Figure 19 Market Evolution
Figure 20 Value Chain of Market
Figure 21 Strategic Benchmarking: Bosch Software Innovations GmbH, Google, Inc., Microsoft Corporation & IBM Corporation are Focusing on Adopting Inorganic Growth Strategies
Figure 22 Strategic Benchmarking: Bosch Software Innovations GmbH, ESRI, Google, Inc., Microsoft Corporation and IBM Corporation Have Adopted Inorganic Strategies to Grow in the Location of Things Market
Figure 23 The Outdoor Location is Expected to Lead in Terms of Market Size in 2017
Figure 24 The IoT Asset Management Segment to Hold Highest Share in the Market in 2017
Figure 25 The Retail Segment is Expected to Grow at the Highest CAGR During the Forecast Period
Figure 26 The Market in Asia-Pacific is Projected to Grow at the Highest CAGR During the Forecast Period
Figure 27 North America is Estimated to Lead the Market With the Largest Market Share in 2017
Figure 28 North America Market Snapshot
Figure 29 Asia-Pacific Location of Things Market Snapshot
Figure 30 Dive Chart
Figure 31 Bosch Software Innovations GmbH: Product Offering Scorecard
Figure 32 Bosch Software Innovations GmbH: Business Strategy Scorecard
Figure 33 Google, Inc. (Alphabet, Inc.): Company Snapshot
Figure 34 Google, Inc. (Alphabet, Inc.): Product Offering Scorecard
Figure 35 Google, Inc. (Alphabet, Inc.): Business Strategy Scorecard
Figure 36 IBM Corporation: Company Snapshot
Figure 37 IBM Corporation: Product Offering Scorecard
Figure 38 IBM Corporation: Business Strategy Scorecard
Figure 39 Microsoft Corporation: Company Snapshot
Figure 40 Microsoft Corporation: Product Offering Scorecard
Figure 41 Microsoft Corporation: Business Strategy Scorecard
Figure 42 ESRI: Product Offering Scorecard
Figure 43 ESRI: Business Strategy Scorecard
Figure 44 Qualcomm Technologies, Inc.: Company Snapshot
Figure 45 Qualcomm Technologies, Inc.: Products Offering Scorecard
Figure 46 Qualcomm Technologies, Inc.: Business Strategy Scorecard
Figure 47 Wireless Logic: Products Offering Scorecard
Figure 48 Wireless Logic: Business Strategy Scorecard
Figure 49 Ubisense Group PLC. : Company Snapshot
Figure 50 Ubisense Group PLC: Products Offering Scorecard
Figure 51 Ubisense Group PLC: Business Strategy Scorecard
Figure 52 Pitney Bowes: Company Snapshot
Figure 53 Pitney Bowes: Product Offering Scorecard
Figure 54 Pitney Bowes: Business Strategy Scorecard
Figure 55 Here: Product Offering Scorecard
Figure 56 Here: Business Strategy Scorecard
Figure 57 Telogis: Product Offering Scorecard
Figure 58 Telogis: Business Strategy Scorecard
Figure 59 Pitney Bowes: Product Offering Scorecard
Figure 60 Pitney Bowes: Business Strategy Scorecard


Growth opportunities and latent adjacency in Location of Things Market