Location-based Services (LBS) and Real-Time Location Systems (RTLS) Market

Location-based Services (LBS) and Real-Time Location Systems (RTLS) Market by Offering (Platform, Services, Hardware), Location Type, Technology, Application (Tracking & Navigation, Marketing & Advertising), Vertical and Region - Global Forecast to 2028

Report Code: TC 2371 Feb, 2024, by marketsandmarkets.com

[298 Pages Report] MarketsandMarkets forecasts that the LBS and RTLS market size is projected to grow from USD 24.7 billion in 2023 to USD 60.4 billion by 2028, at a CAGR of 19.6% during the forecast period. The LBS market is poised for growth, driven by various factors. This includes the increasing availability of spatial data and analytical tools, a rise in consumer use of social media, smartphones, and location-based apps, and a growing demand for geo-marketing. The advent of 5G and affordable connectivity technologies has contributed to widespread connectivity. Improved connectivity and an increasing interest in customizing services based on users' location information have propelled the LBS and RTLS (Real-Time Location Systems) market. Additionally, recognizing the cost advantages of deploying solutions for tracking and managing assets (such as personnel and vehicles) is expected to fuel the market's expansion further.

Location-based Services (LBS) and Real-Time Location Systems (RTLS) Market

To know about the assumptions considered for the study, Request for Free Sample Report

Location-based Services (LBS) and Real-Time Location Systems (RTLS) Market Opportunities

To know about the assumptions considered for the study, download the pdf brochure

LBS and RTLS Market Dynamics

Driver:  Increasing demand for UWB-based real-time location systems

The prevalence of RTLSs based on UWB technology in the healthcare RTLS industry has increased recently. The primary factor driving the UWB technology-based RTLS market for healthcare is the UWB technology's capacity to offer highly accurate positioning data of a person or object. Compared to most other RTLS technologies, UWB delivers greater precision and range at lower power consumption.

Its high penetration in applications needing great accuracy is a result of this. Patient tracking is one illustration of this. UWB technology can assist in determining the precise positions of both patients in a hospital room if there is a space of no more than one meter between two beds. Previously, the main barrier to its spread in several industries, including healthcare, had been the high price. However, prices have been falling over time, which is anticipated to increase demand for RTLS solutions based on UWB technology. For increased productivity, shortened lead times, and lower prices, several end users of RTLS technology have switched from other technology-based RTLS solutions, such as RFID and Wi-Fi, to UWB technology-based RTLS solutions in recent years.

Restraint: High installation and maintenance costs

Real-time location systems can be expensive to install, costing between USD 2 and 5 million. This varies depending on the installation region and business. The hardware cost of Wi-Fi-based RTLS is higher than that of UWB-enabled systems. Also, the upkeep of Wi-Fi and RFID-based systems is more expensive than that of systems based on UWB and BLE. Wiring, powering, and installing RTLS components increase the overall cost.

Also, many RTLS companies need help with deployment and technology. Many projects fail because they require significant engineering efforts and on-site preferences. Installation of RTLSs requires qualified personnel to be on-site at the installation time.

Opportunity: Growing use of BLE and UWB for indoor proximity services

Due to their long battery life and precision, BLE and UWB are employed for indoor proximity services. Currently, BLE is used when a three to six-second latency is acceptable. BLE tags typically give modest precision (about eight meters) and are inexpensive, simple to install, and incredibly portable. These tags range around 75 meters and have a three- to five-year battery life. They also work with smartphones.

Indoor processes that don't need much precision can employ indoor proximity services. UWB, on the other hand, is utilized in indoor operations that demand exceptional precision because it is more accurate than BLE (up to 30 cm). UW can only keep track of a limited amount of assets, however. UWB has low latency and good accuracy even in interference (measurements can be made up to 100 times per second). The implementation of its infrastructure is expensive and necessitates additional government certifications. Its battery can last up to 2 weeks and ranges up to 150 meters. It is rechargeable.

Challenge: System irreconcilability and lack of standardization

End users have access to a variety of LBS and RTLS solutions. However, it is challenging to combine the current solutions due to the absence of common standards. End users experience issues due to the incompatibility of numerous infrastructures and a lack of interoperability. The availability of solutions, including several interoperable technologies under one roof, is now the main worry in the RTLS market. Installation of an RTLS solution in an enterprise or other institutional setting may call for alterations to the current infrastructure, including adding new servers, middleware, and other components.

Although some businesses, including Zebra Technologies, Stanley Black & Decker, and Identec Group, offer RTLS that support many protocols, most industry participants concentrate on only one protocol. There is no interoperability between different RTLS because different technologies operate on other protocols and frequency bands, except those offered by a select few vendors, such as Zebra Technologies, offering a variety of RTLS technologies supported by the same middleware. Due to financial limitations, small and medium-sized businesses (SMBs) might need help to use these technologies within their enterprises, which would prevent standardization. The lack of standardization of protocols may also result in a lack of interoperability across providers. Moreover, vendors must refrain from complying with the existing standards, and using proprietary technologies for tracking has been identified as one of the significant barriers to adopting RTLS solutions.

LBS and RTLS Market Ecosystem

Prominent companies in this market include well-established, financially stable providers of the LBS and RTLS market. These companies have innovated their offerings and possess a diversified product portfolio, state-of-the-art technologies, and marketing networks. Prominent companies in this market include Cisco (US), Google (US), IBM (US), Microsoft (US), Oracle (US), Ericsson (Sweden), Qualcomm (US), TomTom (Netherlands), Zebra Technologies (US), ESRI (US), Teldio (Canada), HERE (Netherlands), Ubisense (UK), Apple (US), etc.

Top Companies in Location-based Services (LBS) and Real-Time Location Systems (RTLS) Market

By location type, the Outdoor segment is expected to hold the largest market size during the forecast period.

Outdoor positioning involves locating data, assets, or individuals in open spaces using technologies such as GPS, satellites, infrared-based remote sensing, and other positioning methods, along with stylized mapping to facilitate navigation services. This technology is employed to track objects or people over long distances from any given location. Key outdoor positioning technologies encompass GNSS, cellular networks, and wireless networks, with GPS being the most widely used GNSS on mobile devices. Various positioning techniques have been developed, relying on high-accuracy, differential, and assisted GPS chips. The primary outdoor Location-Based Services (LBS) applications include geo-marketing and advertising, asset tracking, personal tracking, customer location tracking, fleet tracking, freight management, route optimization and planning, mapping discovery and infotainment, geographic event alerts, and defense management.

By offering, the services segment is expected to grow with the highest CAGR during the forecast period.

Services play a vital role in the overall implementation process of Location-Based Services (LBS) and Real-Time Location Systems (RTLS), with a particular emphasis on RTLS. Understanding the installation and maintenance details before deploying RTLS is crucial to determining the time and cost investments needed for platform installation. For example, specific RTLS installations may span several months, impacting staff productivity in settings like hospitals by disrupting the performance of existing systems. Conversely, solutions like Wi-Fi-based RTLS can be seamlessly integrated into the facility's existing wireless network infrastructure, leading to a shorter installation time. Beyond installation and maintenance services, the services segment encompasses professional services such as consulting, ROI analysis, and site inspection.

Based on region, Asia Pacific is expected to grow with the highest CAGR during the forecast period.

Asia Pacific LBS and RTLS markets are characterized by various applications, including indoor positioning systems, asset tracking, and workforce management. Industries like retail, healthcare, manufacturing, and logistics leverage these technologies to enhance operational efficiency and gain a competitive edge. Integrating LBS with emerging technologies such as IoT (Internet of Things) and AI (Artificial Intelligence) further amplifies the market's growth potential. Government initiatives supporting digitalization and the rising trend of e-commerce are additional factors contributing to the market's expansion. The dynamic nature of consumer preferences and the need for real-time analytics drive businesses to invest in advanced LBS and RTLS solutions. As the region continues to embrace Industry 4.0 trends, the Asia Pacific LBS and RTLS market are poised for sustained growth, presenting lucrative opportunities for both established players and emerging innovators.

North American Location-based Services (LBS) and Real-Time Location Systems (RTLS) Market Size, and Share

Market Players:

The major players in the LBS and RTLS market are Cisco (US), Google (US), IBM (US), Microsoft (US), and Oracle (US). These players have adopted various growth strategies, such as partnerships, agreements and collaborations, new product launches, enhancements, and acquisitions to expand their footprint in the LBS and RTLS market.

Get online access to the report on the World's First Market Intelligence Cloud

  • Easy to Download Historical Data & Forecast Numbers
  • Company Analysis Dashboard for high growth potential opportunities
  • Research Analyst Access for customization & queries
  • Competitor Analysis with Interactive dashboard
  • Latest News, Updates & Trend analysis
Request Sample

Scope of the Report

Report Metrics

Details

Market size available for years

2017-2028

Base year considered

2022

Forecast period

2023–2028

Forecast units

Value (USD) Million/Billion

Segments Covered

Offering (Platform, Service, Hardware), Service (Deployment and Integration, Application Support and Maintenance, Consulting and Training), Location Type (Outdoor, Indoor), Application (Tracking & Navigation, Marketing & Advertising, Location-Based Social Networks, Location-Based Health Monitoring, Other Applications), Technology (Satellite, Microwave, and Infrared Remote Sensing, OTDOA and E-OTD, RFID and NFC, Context-aware technologies, Wi-Fi/WLAN, Ulta Wide Band, Bluetooth/BLE, Others), Vertical (Transportation & Logistics, Retail, Government, Manufacturing, Healthcare & Life Sciences, Tourism & Hospitality, Media & Entertainment, Other Verticals) and Region

Region covered

North America, Europe, Asia Pacific, Middle East & Africa, Latin America

Companies covered

Cisco (US), Google (US), IBM (US), Microsoft (US), Oracle (US), Ericsson (Sweden), Qualcomm (US), TomTom (Netherlands), Zebra Technologies (US), ESRI (US), Teldio (Canada), HERE (Netherlands), Ubisense (UK), Apple (US), Securitas Healthcare (US), GE Healthcare (US), CenTrak (US), IDENTEC GROUP (Liechtenstein), Infor (US), TeleTracking Technologies (US), MYSPHERA (Spain), Aruba Networks (US), KDDI (Japan), NTT Docomo (Japan), AiRISTA Flow (US), Leantegra (US), Sewio Networks (Czech Republic), Quuppa (Finland), Navigine (US), Living Map (UK)

This research report categorizes the LBS and RTLS market based on offering, technology, service, application, vertical, networking type, and region.

Based on Offering:
  • Platform
  • Service
  • Hardware
Based on Service:
  • Deployment and Integration
  • Application Support and Maintenance
  • Consulting and Training
Based on Location Type:
  • Outdoor
  • Indoor
Based on Application:
  • Tracking & Navigation
  • Marketing & Advertising
  • Location-Based Social Networks
  • Location-Based Health Monitoring
  • Other Applications
Based on Technology:
  • Satellite, Microwave, and Infrared Remote Sensing
  • OTDOA and E-OTD
  • RFID and NFC
  • Context-aware technologies
  • Wi-Fi/WLAN
  • Ulta Wide Band
  • Bluetooth/BLE
  • Others
Based on Vertical:
  • Transportation & Logistics
  • Retail
  • Government
  • Manufacturing
  • Healthcare & Life Sciences
  • Tourism & Hospitality
  • Media & Entertainment
  • Other Verticals
Based on the region:
  • North America
    • US
    • Canada
  • Europe
    • UK
    • Germany
    • France
    • Spain
    • Italy
    • Rest of Europe
  • Asia Pacific
    • China
    • Japan
    • India
    • Australia and New Zealand
    • South Korea
    • Southeast Asia
    • Rest of Asia Pacific
  • Middle East & Africa
    • GCC Countries
      • UAE
      • KSA
      • Rest of GCC Countries
    • South Africa
    • Rest of Middle East Africa
  • Latin America
    • Brazil
    • Mexico
    • Rest of Latin America

Recent Developments

  • In January 2024, TomTom announced the roll-out of its new TomTom Orbis Maps. The maps feature unprecedented coverage, including an industry-leading 86 million kilometers of transportation networks.
  • In November 2023, Esri, a geographic information system (GIS) software leader, partnered with Microsoft to integrate its ArcGIS platform with Microsoft Fabric, a unified analytics platform. This integration will allow users of Microsoft Fabric to access Esri's powerful spatial analytics capabilities directly within their existing workflow.
  • In May 2023, Google launched Geospatial Creator, which empowers individuals to swiftly create, visualize, and share immersive and augmented reality (AR) content using Unity and Adobe Aero
  • In April 2023, Qualcomm and Xiaomi demonstrated mobile meter-level positioning capabilities powered by Snapdragon 8+ Gen 1 Mobile Platform in Germany, unlocking superior location capabilities. Meter-level positioning accuracy can improve smartphone user experience in numerous scenarios, including mapping, driving, and other mobile applications.
  • In January 2023, Google Cloud Marketplace offered ESGSignals, a platform introduced by RS Metrics. It provides access to over 100 real-time environmental, social, governance (ESG), and environmental, climate, and physical (ECP) risk metrics at the asset level.

Frequently Asked Questions (FAQ):

To speak to our analyst for a discussion on the above findings, click Speak to Analyst

TABLE OF CONTENTS
 
1 INTRODUCTION (Page No. - 43)
    1.1 STUDY OBJECTIVES 
    1.2 MARKET DEFINITION 
    1.3 STUDY SCOPE 
           1.3.1 MARKET SEGMENTATION
           1.3.2 INCLUSIONS & EXCLUSIONS
           1.3.3 REGIONS COVERED
    1.4 YEARS CONSIDERED 
    1.5 CURRENCY CONSIDERED 
           TABLE 1 USD EXCHANGE RATES, 2020–2022
    1.6 STAKEHOLDERS 
    1.7 SUMMARY OF CHANGES 
           1.7.1 IMPACT OF RECESSION
 
2 RESEARCH METHODOLOGY (Page No. - 48)
    2.1 RESEARCH DATA 
           FIGURE 1 LBS AND RTLS MARKET: RESEARCH DESIGN
           2.1.1 SECONDARY DATA
           2.1.2 PRIMARY DATA
                    2.1.2.1 Breakdown of primary interviews
                               FIGURE 2 BREAKDOWN OF PRIMARY INTERVIEWS: BY COMPANY TYPE, DESIGNATION, AND REGION
                    2.1.2.2 Key industry insights
    2.2 MARKET BREAKUP AND DATA TRIANGULATION 
    2.3 MARKET SIZE ESTIMATION 
           2.3.1 TOP-DOWN APPROACH
           2.3.2 BOTTOM-UP APPROACH
                    FIGURE 3 MARKET SIZE ESTIMATION METHODOLOGY (DEMAND SIDE): REVENUE OF SOLUTIONS/SERVICES OF MARKET
                    FIGURE 4 MARKET SIZE ESTIMATION: BOTTOM-UP APPROACH, SUPPLY-SIDE ANALYSIS
    2.4 RISK ASSESSMENT 
           TABLE 2 RISK ASSESSMENT
    2.5 RESEARCH ASSUMPTIONS 
           TABLE 3 RESEARCH ASSUMPTIONS
    2.6 LIMITATIONS 
    2.7 IMPLICATIONS OF RECESSION ON LBS AND RTLS MARKET 
 
3 EXECUTIVE SUMMARY (Page No. - 56)
    FIGURE 5 MARKET, 2021–2028 (USD MILLION) 
    FIGURE 6 MARKET, REGIONAL SHARE, 2023 
 
4 PREMIUM INSIGHTS (Page No. - 60)
    4.1 OPPORTUNITIES FOR PLAYERS IN LBS AND RTLS MARKET 
           FIGURE 7 GROWING NEED FOR ADVANCED LOCATION TRACKING TECHNOLOGIES TO DRIVE MARKET
    4.2 NORTH AMERICA: MARKET, BY OFFERING AND COUNTRY 
           FIGURE 8 SERVICES AND US TO ACCOUNT FOR SIGNIFICANT MARKET SHARES IN NORTH AMERICA
    4.3 ASIA PACIFIC: MARKET, BY OFFERING AND KEY COUNTRY 
           FIGURE 9 SERVICES AND CHINA ESTIMATED TO ACCOUNT FOR SIGNIFICANT MARKET SHARES IN ASIA PACIFIC
    4.4 MARKET, BY LOCATION TYPE 
           FIGURE 10 OUTDOOR SEGMENT TO ACCOUNT FOR LARGER MARKET SHARE IN 2023
    4.5 MARKET, BY APPLICATION 
           FIGURE 11 TRACKING & NAVIGATION SEGMENT TO ACCOUNT FOR LARGER MARKET SHARE IN 2023
 
5 MARKET OVERVIEW AND INDUSTRY TRENDS (Page No. - 63)
    5.1 INTRODUCTION 
    5.2 MARKET DYNAMICS 
           FIGURE 12 LBS AND RTLS MARKET: DRIVERS, RESTRAINTS, OPPORTUNITIES, AND CHALLENGES
           5.2.1 DRIVERS
                    5.2.1.1 Increasing demand for UWB-based real-time location systems
                    5.2.1.2 Rising need for geo-marketing
                    5.2.1.3 Increasing competitiveness
                    5.2.1.4 Growing demand for location-based and real-time systems and services in various industries
           5.2.2 RESTRAINTS
                    5.2.2.1 High installation and maintenance costs
                    5.2.2.2 Data security concerns
                    5.2.2.3 Negative feedback from end users
           5.2.3 OPPORTUNITIES
                    5.2.3.1 Growing use of BLE and UWB for indoor proximity services
                    5.2.3.2 Rising focus on IoT in healthcare
                    5.2.3.3 Growing use of 5G for location-based services
                    5.2.3.4 Rising demand for real-time location systems in emerging regions
           5.2.4 CHALLENGES
                    5.2.4.1 System irreconcilability and lack of standardization
    5.3 BRIEF HISTORY OF LBS AND RTLS MARKET 
           5.3.1 2000–2010
           5.3.2 2011–2020
           5.3.3 2021–PRESENT
    5.4 ECOSYSTEM ANALYSIS 
           FIGURE 13 MARKET ECOSYSTEM
           TABLE 4 ECOSYSTEM ANALYSIS
    5.5 CASE STUDY ANALYSIS 
           5.5.1 USE CASE 1: KESKO INCREASED ITS AVERAGE SALES USING NAVIGINE’S INDOOR NAVIGATION SYSTEM
           5.5.2 USE CASE 2: UBER USED TOMTOM’S TRAFFIC DATA AND MAP APIS TO FACILITATE SMOOTH JOURNEYS
           5.5.3 USE CASE 3: BING MAPS HELPED SOLIDARITY ACHIEVE SOUND, REAL-TIME REPORTING
           5.5.4 USE CASE 4: GOOGLE MAPS PLATFORM HELPED IBIBO GROUP OFFER INTELLIGENT TRAVELER SERVICES
           5.5.5 USE CASE 5: BOUMAN MENTAL HEALTHCARE ADOPTED AIRISTA FLOW RTLS TO DEVELOP MOBILE EMERGENCY ALERTING SYSTEM
    5.6 VALUE CHAIN ANALYSIS 
           FIGURE 14 VALUE CHAIN ANALYSIS
    5.7 TARIFF AND REGULATORY LANDSCAPE 
           5.7.1 TARIFF RELATED TO LBS AND RTLS DEVICES
                    TABLE 5 TARIFF RELATED TO ELECTRONIC INTEGRATED CIRCUITS AS PROCESSORS AND CONTROLLERS
           5.7.2 REGULATORY BODIES, GOVERNMENT AGENCIES, AND OTHER ORGANIZATIONS
                    TABLE 6 NORTH AMERICA: REGULATORY BODIES, GOVERNMENT AGENCIES, AND OTHER ORGANIZATIONS
                    TABLE 7 EUROPE: REGULATORY BODIES, GOVERNMENT AGENCIES, AND OTHER ORGANIZATIONS
                    TABLE 8 ASIA PACIFIC: LIST OF REGULATORY BODIES, GOVERNMENT AGENCIES, AND OTHER ORGANIZATIONS
                    TABLE 9 ROW: REGULATORY BODIES, GOVERNMENT AGENCIES, AND OTHER ORGANIZATIONS
                    5.7.2.1 North America
                               5.7.2.1.1 US
                               5.7.2.1.2 Canada
                    5.7.2.2 Europe
                    5.7.2.3 Asia Pacific
                               5.7.2.3.1 South Korea
                               5.7.2.3.2 China
                               5.7.2.3.3 India
                    5.7.2.4 Middle East & Africa
                               5.7.2.4.1 UAE
                               5.7.2.4.2 KSA
                               5.7.2.4.3 Bahrain
                    5.7.2.5 Latin America
                               5.7.2.5.1 Brazil
                               5.7.2.5.2 Mexico
    5.8 PATENT ANALYSIS 
           5.8.1 METHODOLOGY
           5.8.2 DOCUMENT TYPE
                    TABLE 10 PATENTS FILED, 2014–2023
           5.8.3 INNOVATION AND PATENT APPLICATIONS
                    FIGURE 15 LIST OF MAJOR PATENTS IN LBS AND RTLS MARKET
           5.8.4 LIST OF MAJOR PATENTS
                    TABLE 11 LIST OF PATENTS IN MARKET, 2022–2023
    5.9 TECHNOLOGY ANALYSIS 
           5.9.1 SATELLITE, MICROWAVE, AND INFRARED REMOTE SENSING
           5.9.2 OTDOA AND E-OTD
           5.9.3 RFID AND NFC
           5.9.4 CONTEXT-AWARE TECHNOLOGIES
           5.9.5 WI-FI/WLAN, UWB, BT/BLE, BEACONS, AND A-GPS
           5.9.6 OTHER TECHNOLOGIES
    5.10 PRICING ANALYSIS 
           5.10.1 AVERAGE SELLING PRICE TREND OF KEY PLAYERS, BY OFFERING
                    FIGURE 16 AVERAGE SELLING PRICE TREND OF KEY PLAYERS, BY OFFERING
                    TABLE 12 AVERAGE SELLING PRICE TREND OF KEY PLAYERS, BY OFFERING (USD PER MONTH)
           5.10.2 INDICATIVE PRICING ANALYSIS OF KEY PLAYERS, BY OFFERING
                    TABLE 13 INDICATIVE PRICING ANALYSIS OF KEY PLAYERS, BY OFFERING
    5.11 PORTER’S FIVE FORCES MODEL 
                    TABLE 14 PORTER’S FIVE FORCES MODEL
                    FIGURE 17 LBS AND RTLS MARKET: PORTER’S FIVE FORCES MODEL
           5.11.1 THREAT OF NEW ENTRANTS
           5.11.2 THREAT OF SUBSTITUTES
           5.11.3 BARGAINING POWER OF BUYERS
           5.11.4 BARGAINING POWER OF SUPPLIERS
           5.11.5 INTENSITY OF COMPETITIVE RIVALRY
    5.12 TRENDS AND DISRUPTIONS IMPACTING CUSTOMERS’ BUSINESSES 
                    FIGURE 18 TRENDS AND DISRUPTIONS IMPACTING CUSTOMERS’ BUSINESSES
    5.13 KEY STAKEHOLDERS & BUYING CRITERIA 
           5.13.1 KEY STAKEHOLDERS IN BUYING PROCESS
                    FIGURE 19 INFLUENCE OF STAKEHOLDERS ON BUYING PROCESS FOR TOP THREE END USERS
                    TABLE 15 INFLUENCE OF STAKEHOLDERS ON BUYING PROCESS FOR TOP THREE END USERS
           5.13.2 BUYING CRITERIA
                    FIGURE 20 KEY BUYING CRITERIA FOR TOP THREE END USERS
                    TABLE 16 KEY BUYING CRITERIA FOR TOP THREE END USERS
    5.14 KEY CONFERENCES & EVENTS 
                    TABLE 17 LIST OF CONFERENCES & EVENTS, 2023–2024
    5.15 TECHNOLOGY ROADMAP FOR LBS AND RTLS MARKET 
           5.15.1 SHORT-TERM ROADMAP (2023–2025)
           5.15.2 MID-TERM ROADMAP (2026–2028)
           5.15.3 LONG-TERM ROADMAP (2029–2030)
    5.16 BEST PRACTICES TO IMPLEMENT LBS AND RTLS 
           5.16.1 SCALABILITY
           5.16.2 INTEGRATION WITH EXISTING SYSTEMS
           5.16.3 DATA SECURITY AND PRIVACY
           5.16.4 ACCURACY AND RELIABILITY
           5.16.5 USER TRAINING AND ACCEPTANCE
           5.16.6 POWER EFFICIENCY
           5.16.7 REAL-TIME ANALYTICS AND REPORTING
           5.16.8 REGULATORY COMPLIANCE
           5.16.9 CONTINUOUS MONITORING AND IMPROVEMENT
                    5.16.10 COST CONSIDERATIONS
    5.17 CURRENT AND EMERGING BUSINESS MODELS 
           5.17.1 SUBSCRIPTION-BASED SERVICES
           5.17.2 DATA MONETIZATION
           5.17.3 LOCATION-AS-A-SERVICE MODEL
           5.17.4 HARDWARE AND SOFTWARE BUNDLES
           5.17.5 BLOCKCHAIN-ENABLED LOCATION SERVICES
           5.17.6 INDUSTRY-SPECIFIC SOLUTIONS
    5.18 TOOLS, FRAMEWORKS, AND TECHNIQUES USED IN LBS AND RTLS MARKET 
                    FIGURE 21 TOOLS, FRAMEWORKS, AND TECHNIQUES USED IN MARKET
    5.19 HS CODE ANALYSIS 
           5.19.1 EXPORT SCENARIO OF ELECTRONIC INTEGRATED CIRCUITS AND PARTS THEREOF
                    FIGURE 22 EXPORT OF ELECTRONIC INTEGRATED CIRCUITS AND PARTS THEREOF, BY KEY COUNTRY, 2015–2022 (USD BILLION)
           5.19.2 IMPORT SCENARIO OF ELECTRONIC INTEGRATED CIRCUITS AND PARTS THEREOF
                    FIGURE 23 IMPORT OF ELECTRONIC INTEGRATED CIRCUITS AND PARTS THEREOF, BY KEY COUNTRY, 2015–2022 (USD BILLION)
 
6 LBS AND RTLS MARKET, BY OFFERING (Page No. - 99)
    6.1 INTRODUCTION 
           FIGURE 24 SERVICES SEGMENT TO GROW AT HIGHEST CAGR DURING FORECAST PERIOD
           6.1.1 OFFERINGS: MARKET DRIVERS
                    TABLE 18 MARKET, BY OFFERING, 2017–2022 (USD MILLION)
                    TABLE 19 MARKET, BY OFFERING, 2023–2028 (USD MILLION)
    6.2 PLATFORMS 
           6.2.1 GROWING NEED TO ENHANCE FEATURES OF LOCATION-BASED AND REAL-TIME LOCATION PLATFORMS TO FUEL MARKET GROWTH
                    TABLE 20 PLATFORMS: MARKET, BY REGION, 2017–2022 (USD MILLION)
                    TABLE 21 PLATFORMS: MARKET, BY REGION, 2023–2028 (USD MILLION)
    6.3 SERVICES 
           6.3.1 GROWING DEMAND FOR MODERN INFORMATION SERVICES TO BOLSTER MARKET
                    TABLE 22 SERVICES: MARKET, BY REGION, 2017–2022 (USD MILLION)
                    TABLE 23 SERVICES: MARKET, BY REGION, 2023–2028 (USD MILLION)
                    TABLE 24 MARKET, BY SERVICE, 2017–2022 (USD MILLION)
                    TABLE 25 MARKET, BY SERVICE, 2023–2028 (USD MILLION)
           6.3.2 DEPLOYMENT & INTEGRATION
                    TABLE 26 DEPLOYMENT & INTEGRATION: MARKET, BY REGION, 2017–2022 (USD MILLION)
                    TABLE 27 DEPLOYMENT & INTEGRATION: MARKET, BY REGION, 2023–2028 (USD MILLION)
           6.3.3 APPLICATION SUPPORT & MAINTENANCE
                    TABLE 28 APPLICATION SUPPORT & MAINTENANCE: MARKET, BY REGION, 2017–2022 (USD MILLION)
                    TABLE 29 APPLICATION SUPPORT & MAINTENANCE: MARKET, BY REGION, 2023–2028 (USD MILLION)
           6.3.4 CONSULTING & TRAINING
                    TABLE 30 CONSULTING & TRAINING: MARKET, BY REGION, 2017–2022 (USD MILLION)
                    TABLE 31 CONSULTING & TRAINING: MARKET, BY REGION, 2023–2028 (USD MILLION)
    6.4 HARDWARE 
           6.4.1 INCREASING USE OF EMBEDDED SENSORS AND LONG-LASTING INTERNAL BATTERIES TO FUEL MARKET
                    TABLE 32 HARDWARE: MARKET, BY REGION, 2017–2022 (USD MILLION)
                    TABLE 33 HARDWARE: MARKET, BY REGION, 2023–2028 (USD MILLION)
 
7 LBS AND RTLS MARKET, BY LOCATION TYPE (Page No. - 109)
    7.1 INTRODUCTION 
           FIGURE 25 INDOOR SEGMENT TO GROW AT HIGHER CAGR DURING FORECAST PERIOD
           7.1.1 LOCATION TYPES: MARKET DRIVERS
                    TABLE 34 MARKET, BY LOCATION TYPE, 2017–2022 (USD MILLION)
                    TABLE 35 MARKET, BY LOCATION TYPE, 2023–2028 (USD MILLION)
    7.2 OUTDOOR 
           7.2.1 RISING DEMAND FOR OUTDOOR POSITIONING SYSTEMS IN COMPANIES TO ACCELERATE MARKET GROWTH
                    TABLE 36 OUTDOOR: MARKET, BY REGION, 2017–2022 (USD MILLION)
                    TABLE 37 OUTDOOR: MARKET, BY REGION, 2023–2028 (USD MILLION)
    7.3 INDOOR 
           7.3.1 INCREASING NEED TO ACCURATELY TRACK INVENTORY TO BOOST MARKET
                    TABLE 38 INDOOR: MARKET, BY REGION, 2017–2022 (USD MILLION)
                    TABLE 39 INDOOR: MARKET, BY REGION, 2023–2028 (USD MILLION)
 
8 LBS AND RTLS MARKET, BY APPLICATION (Page No. - 114)
    8.1 INTRODUCTION 
           FIGURE 26 LOCATION-BASED HEALTH MONITORING SEGMENT TO GROW AT HIGHEST CAGR DURING FORECAST PERIOD
           8.1.1 APPLICATIONS: MARKET DRIVERS
                    TABLE 40 MARKET, BY APPLICATION, 2017–2022 (USD MILLION)
                    TABLE 41 MARKET, BY APPLICATION, 2023–2028 (USD MILLION)
    8.2 TRACKING & NAVIGATION 
           8.2.1 WAYFINDING APPS TO AID INDOOR NAVIGATION
                    TABLE 42 TRACKING & NAVIGATION: MARKET, BY REGION, 2017–2022 (USD MILLION)
                    TABLE 43 TRACKING & NAVIGATION: MARKET, BY REGION, 2023–2028 (USD MILLION)
    8.3 MARKETING & ADVERTISING 
           8.3.1 INCREASE IN EFFECTIVENESS OF ONLINE ADVERTISEMENTS TO FOSTER MARKET GROWTH
                    TABLE 44 MARKETING & ADVERTISING: MARKET, BY REGION, 2017–2022 (USD MILLION)
                    TABLE 45 MARKETING & ADVERTISING: MARKET, BY REGION, 2023–2028 (USD MILLION)
    8.4 LOCATION-BASED SOCIAL NETWORKS 
           8.4.1 GROWING POPULARITY OF SOCIAL NETWORKING APPS TO DRIVE MARKET
                    TABLE 46 LOCATION-BASED SOCIAL NETWORKS: MARKET, BY REGION, 2017–2022 (USD MILLION)
                    TABLE 47 LOCATION-BASED SOCIAL NETWORKS: MARKET, BY REGION, 2023–2028 (USD MILLION)
    8.5 LOCATION-BASED HEALTH MONITORING 
           8.5.1 RISING NEED FOR ASSISTIVE SYSTEMS TO BOOST DEMAND FOR LOCATION-BASED HEALTH MONITORING
                    TABLE 48 LOCATION-BASED HEALTH MONITORING: MARKET, BY REGION, 2017–2022 (USD MILLION)
                    TABLE 49 LOCATION-BASED HEALTH MONITORING: MARKET, BY REGION, 2023–2028 (USD MILLION)
    8.6 OTHER APPLICATIONS 
           TABLE 50 OTHER APPLICATIONS: MARKET, BY REGION, 2017–2022 (USD MILLION)
           TABLE 51 OTHER APPLICATIONS: MARKET, BY REGION, 2023–2028 (USD MILLION)
 
9 LBS AND RTLS MARKET, BY VERTICAL (Page No. - 122)
    9.1 INTRODUCTION 
           FIGURE 27 HEALTHCARE VERTICAL TO GROW AT HIGHEST CAGR DURING FORECAST PERIOD
           9.1.1 VERTICALS: MARKET DRIVERS
                    TABLE 52 MARKET, BY VERTICAL, 2017–2022 (USD MILLION)
                    TABLE 53 MARKET, BY VERTICAL, 2023–2028 (USD MILLION)
    9.2 TRANSPORTATION & LOGISTICS 
           9.2.1 RISING NEED TO TRACK BUSINESS ASSETS AND REDUCE COSTS TO PROPEL MARKET
                    TABLE 54 TRANSPORTATION & LOGISTICS: MARKET, BY REGION, 2017–2022 (USD MILLION)
                    TABLE 55 TRANSPORTATION & LOGISTICS: MARKET, BY REGION, 2023–2028 (USD MILLION)
           9.2.2 TRANSPORTATION & LOGISTICS: LBS AND RTLS USE CASES
    9.3 RETAIL 
           9.3.1 GROWING IMPORTANCE OF IMPROVING CUSTOMER EXPERIENCE TO BOOST MARKET
                    TABLE 56 RETAIL: LBS AND RTLS MARKET, BY REGION, 2017–2022 (USD MILLION)
                    TABLE 57 RETAIL: MARKET, BY REGION, 2023–2028 (USD MILLION)
           9.3.2 RETAIL: LBS AND RTLS USE CASES
    9.4 GOVERNMENT 
           9.4.1 RISING NEED TO MONITOR DEVELOPMENT AND ALLOCATION OF RESOURCES TO ACCELERATE MARKET GROWTH
                    TABLE 58 GOVERNMENT: MARKET, BY REGION, 2017–2022 (USD MILLION)
                    TABLE 59 GOVERNMENT: MARKET, BY REGION, 2023–2028 (USD MILLION)
           9.4.2 GOVERNMENT: LBS AND RTLS USE CASES
    9.5 MANUFACTURING 
           9.5.1 RISING NEED TO STREAMLINE OPERATIONS AND INCREASE STAFF SECURITY TO BOOST MARKET
                    TABLE 60 MANUFACTURING: LBS AND RTLS MARKET, BY REGION, 2017–2022 (USD MILLION)
                    TABLE 61 MANUFACTURING: MARKET, BY REGION, 2023–2028 (USD MILLION)
           9.5.2 MANUFACTURING: LBS AND RTLS USE CASES
    9.6 TOURISM & HOSPITALITY 
           9.6.1 INCREASING USE OF LOCATION-BASED AND REAL-TIME LOCATION SYSTEMS TO ENHANCE CUSTOMER EXPERIENCE
                    TABLE 62 TOURISM & HOSPITALITY: MARKET, BY REGION, 2017–2022 (USD MILLION)
                    TABLE 63 TOURISM & HOSPITALITY: MARKET, BY REGION, 2023–2028 (USD MILLION)
           9.6.2 TOURISM & HOSPITALITY: LBS AND RTLS USE CASES
    9.7 HEALTHCARE 
           9.7.1 INCREASING ADOPTION OF LOCATION-BASED AND REAL-TIME LOCATION SOLUTIONS TO DRIVE MARKET GROWTH
                    TABLE 64 HEALTHCARE: MARKET, BY REGION, 2017–2022 (USD MILLION)
                    TABLE 65 HEALTHCARE: MARKET, BY REGION, 2023–2028 (USD MILLION)
           9.7.2 HEALTHCARE: LBS AND RTLS USE CASES
    9.8 MEDIA & ENTERTAINMENT 
           9.8.1 PERSONAL LOCATION INTELLIGENCE AND LOCATION ANALYTICS TO DRIVE MARKET
                    TABLE 66 MEDIA & ENTERTAINMENT: MARKET, BY REGION, 2017–2022 (USD MILLION)
                    TABLE 67 MEDIA & ENTERTAINMENT: MARKET, BY REGION, 2023–2028 (USD MILLION)
           9.8.2 MEDIA & ENTERTAINMENT: LBS AND RTLS USE CASES
    9.9 OTHER VERTICALS 
           TABLE 68 OTHER VERTICALS: MARKET, BY REGION, 2017–2022 (USD MILLION)
           TABLE 69 OTHER VERTICALS: MARKET, BY REGION, 2023–2028 (USD MILLION)
 
10 LBS AND RTLS MARKET, BY TECHNOLOGY (Page No. - 137)
     10.1 INTRODUCTION 
             10.1.1 TECHNOLOGIES: MARKET DRIVERS
     10.2 SATELLITE, MICROWAVE, AND INFRARED REMOTE SENSING 
             10.2.1 INCREASING DEMAND FOR THEMATIC MAPPING AND GEOGRAPHIC INTELLIGENCE TO PROPEL MARKET GROWTH
     10.3 OTDOA AND E-OTD 
             10.3.1 RISING NEED FOR LOCATION TRACKING, PARTICULARLY IN CELLULAR NETWORKS, TO DRIVE MARKET
     10.4 RFID AND NFC 
             10.4.1 SPIKE IN DEMAND FOR TRACKING, TRACING, MONITORING, AND EMERGENCY MANAGEMENT APPLICATIONS TO ACCELERATE MARKET GROWTH
     10.5 CONTEXT-AWARE TECHNOLOGIES 
             10.5.1 SURGE IN USE OF SMARTPHONES AND SOCIAL NETWORKING PLATFORMS TO OPEN NEW AVENUES FOR CONTEXTUAL ADVERTISING
     10.6 WI-FI/WLAN 
             10.6.1 NEED FOR APPROXIMATING LOCATION BASED ON KNOWN RADIO PROPAGATION CHARACTERISTICS TO DRIVE MARKET
     10.7 UWB 
             10.7.1 ABILITY TO TRANSMIT EXTREMELY LARGE AMOUNTS OF DATA TO PROPEL MARKET GROWTH
     10.8 BT/BLE 
             10.8.1 INFORMED DECISION-MAKING AND ENHANCED OPERATIONAL CONTROL TO PROPEL MARKET
     10.9 OTHER TECHNOLOGIES 
             10.9.1 A-GPS
             10.9.2 BEACONS
             10.9.3 ZIGBEE
             10.9.4 ULTRASOUND
 
11 LBS AND RTLS MARKET, BY REGION (Page No. - 143)
     11.1 INTRODUCTION 
               FIGURE 28 NORTH AMERICA TO LEAD MARKET DURING FORECAST PERIOD
               TABLE 70 MARKET, BY REGION, 2017–2022 (USD MILLION)
               TABLE 71 MARKET, BY REGION, 2023–2028 (USD MILLION)
     11.2 NORTH AMERICA 
             11.2.1 NORTH AMERICA: MARKET DRIVERS
             11.2.2 NORTH AMERICA: RECESSION IMPACT
                       FIGURE 29 NORTH AMERICA: MARKET SNAPSHOT
                       TABLE 72 NORTH AMERICA: LBS AND RTLS MARKET, BY OFFERING, 2017–2022 (USD MILLION)
                       TABLE 73 NORTH AMERICA: MARKET, BY OFFERING, 2023–2028 (USD MILLION)
                       TABLE 74 NORTH AMERICA: MARKET, BY SERVICE, 2017–2022 (USD MILLION)
                       TABLE 75 NORTH AMERICA: MARKET, BY SERVICE, 2023–2028 (USD MILLION)
                       TABLE 76 NORTH AMERICA: MARKET, BY LOCATION TYPE, 2017–2022 (USD MILLION)
                       TABLE 77 NORTH AMERICA: MARKET, BY LOCATION TYPE, 2023–2028 (USD MILLION)
                       TABLE 78 NORTH AMERICA: MARKET, BY APPLICATION, 2017–2022 (USD MILLION)
                       TABLE 79 NORTH AMERICA: MARKET, BY APPLICATION, 2023–2028 (USD MILLION)
                       TABLE 80 NORTH AMERICA: MARKET, BY VERTICAL, 2017–2022 (USD MILLION)
                       TABLE 81 NORTH AMERICA: MARKET, BY VERTICAL, 2023–2028 (USD MILLION)
                       TABLE 82 NORTH AMERICA: MARKET, BY COUNTRY, 2017–2022 (USD MILLION)
                       TABLE 83 NORTH AMERICA: MARKET, BY COUNTRY, 2023–2028 (USD MILLION)
             11.2.3 US
                       11.2.3.1 Easy availability of indoor and outdoor location technologies to drive market
                                   TABLE 84 US: LBS AND RTLS MARKET, BY OFFERING, 2017–2022 (USD MILLION)
                                   TABLE 85 US: MARKET, BY OFFERING, 2023–2028 (USD MILLION)
                                   TABLE 86 US: MARKET, BY SERVICE, 2017–2022 (USD MILLION)
                                   TABLE 87 US: MARKET, BY SERVICE, 2023–2028 (USD MILLION)
                                   TABLE 88 US: MARKET, BY LOCATION TYPE, 2017–2022 (USD MILLION)
                                   TABLE 89 US: MARKET, BY LOCATION TYPE, 2023–2028 (USD MILLION)
                                   TABLE 90 US: MARKET, BY APPLICATION, 2017–2022 (USD MILLION)
                                   TABLE 91 US: MARKET, BY APPLICATION, 2023–2028 (USD MILLION)
                                   TABLE 92 US: MARKET, BY VERTICAL, 2017–2022 (USD MILLION)
                                   TABLE 93 US: MARKET, BY VERTICAL, 2023–2028 (USD MILLION)
             11.2.4 CANADA
                       11.2.4.1 Rising infrastructural developments and investments to boost market
                                   TABLE 94 CANADA: LBS AND RTLS MARKET, BY OFFERING, 2017–2022 (USD MILLION)
                                   TABLE 95 CANADA: MARKET, BY OFFERING, 2023–2028 (USD MILLION)
                                   TABLE 96 CANADA: MARKET, BY SERVICE, 2017–2022 (USD MILLION)
                                   TABLE 97 CANADA: MARKET, BY SERVICE, 2023–2028 (USD MILLION)
                                   TABLE 98 CANADA: MARKET, BY LOCATION TYPE, 2017–2022 (USD MILLION)
                                   TABLE 99 CANADA: MARKET, BY LOCATION TYPE, 2023–2028 (USD MILLION)
                                   TABLE 100 CANADA: MARKET, BY APPLICATION, 2017–2022 (USD MILLION)
                                   TABLE 101 CANADA: MARKET, BY APPLICATION, 2023–2028 (USD MILLION)
                                   TABLE 102 CANADA: MARKET, BY VERTICAL, 2017–2022 (USD MILLION)
                                   TABLE 103 CANADA: MARKET, BY VERTICAL, 2023–2028 (USD MILLION)
     11.3 EUROPE 
             11.3.1 EUROPE: MARKET DRIVERS
             11.3.2 EUROPE: RECESSION IMPACT
                       TABLE 104 EUROPE: LBS AND RTLS MARKET, BY OFFERING, 2017–2022 (USD MILLION)
                       TABLE 105 EUROPE: MARKET, BY OFFERING, 2023–2028 (USD MILLION)
                       TABLE 106 EUROPE: MARKET, BY SERVICE, 2017–2022 (USD MILLION)
                       TABLE 107 EUROPE: MARKET, BY SERVICE, 2023–2028 (USD MILLION)
                       TABLE 108 EUROPE: MARKET, BY LOCATION TYPE, 2017–2022 (USD MILLION)
                       TABLE 109 EUROPE: MARKET, BY LOCATION TYPE, 2023–2028 (USD MILLION)
                       TABLE 110 EUROPE: MARKET, BY APPLICATION, 2017–2022 (USD MILLION)
                       TABLE 111 EUROPE: MARKET, BY APPLICATION, 2023–2028 (USD MILLION)
                       TABLE 112 EUROPE: MARKET, BY VERTICAL, 2017–2022 (USD MILLION)
                       TABLE 113 EUROPE: MARKET, BY VERTICAL, 2023–2028 (USD MILLION)
                       TABLE 114 EUROPE: MARKET, BY COUNTRY, 2017–2022 (USD MILLION)
                       TABLE 115 EUROPE: MARKET, BY COUNTRY, 2023–2028 (USD MILLION)
             11.3.3 UK
                       11.3.3.1 Growing adoption of smartphones to bolster market growth
                                   TABLE 116 UK: LBS AND RTLS MARKET, BY OFFERING, 2017–2022 (USD MILLION)
                                   TABLE 117 UK: MARKET, BY OFFERING, 2023–2028 (USD MILLION)
                                   TABLE 118 UK: MARKET, BY SERVICE, 2017–2022 (USD MILLION)
                                   TABLE 119 UK: MARKET, BY SERVICE, 2023–2028 (USD MILLION)
                                   TABLE 120 UK: MARKET, BY LOCATION TYPE, 2017–2022 (USD MILLION)
                                   TABLE 121 UK: MARKET, BY LOCATION TYPE, 2023–2028 (USD MILLION)
                                   TABLE 122 UK: MARKET, BY APPLICATION, 2017–2022 (USD MILLION)
                                   TABLE 123 UK: MARKET, BY APPLICATION, 2023–2028 (USD MILLION)
                                   TABLE 124 UK: MARKET, BY VERTICAL, 2017–2022 (USD MILLION)
                                   TABLE 125 UK: MARKET, BY VERTICAL, 2023–2028 (USD MILLION)
             11.3.4 GERMANY
                       11.3.4.1 Growing demand for smart infrastructure systems to accelerate market growth
                                   TABLE 126 GERMANY: LBS AND RTLS MARKET, BY OFFERING, 2017–2022 (USD MILLION)
                                   TABLE 127 GERMANY: MARKET, BY OFFERING, 2023–2028 (USD MILLION)
                                   TABLE 128 GERMANY: MARKET, BY SERVICE, 2017–2022 (USD MILLION)
                                   TABLE 129 GERMANY: MARKET, BY SERVICE, 2023–2028 (USD MILLION)
                                   TABLE 130 GERMANY: MARKET, BY LOCATION TYPE, 2017–2022 (USD MILLION)
                                   TABLE 131 GERMANY: MARKET, BY LOCATION TYPE, 2023–2028 (USD MILLION)
                                   TABLE 132 GERMANY: MARKET, BY APPLICATION, 2017–2022 (USD MILLION)
                                   TABLE 133 GERMANY: MARKET, BY APPLICATION, 2023–2028 (USD MILLION)
                                   TABLE 134 GERMANY: MARKET, BY VERTICAL, 2017–2022 (USD MILLION)
                                   TABLE 135 GERMANY: MARKET, BY VERTICAL, 2023–2028 (USD MILLION)
             11.3.5 ITALY
                       11.3.5.1 Surging demand for advanced technologies to fuel growth
             11.3.6 FRANCE
                       11.3.6.1 Increasing investments by government to propel market
             11.3.7 SPAIN
                       11.3.7.1 Increasing investments by major vendors to drive market
             11.3.8 NORDICS
                       11.3.8.1 Growing adoption of advanced technologies to boost market
             11.3.9 REST OF EUROPE
     11.4 ASIA PACIFIC 
             11.4.1 ASIA PACIFIC: MARKET DRIVERS
             11.4.2 ASIA PACIFIC: RECESSION IMPACT
                       FIGURE 30 ASIA PACIFIC: LBS AND RTLS MARKET SNAPSHOT
                       TABLE 136 ASIA PACIFIC: MARKET, BY OFFERING, 2017–2022 (USD MILLION)
                       TABLE 137 ASIA PACIFIC: MARKET, BY OFFERING, 2023–2028 (USD MILLION)
                       TABLE 138 ASIA PACIFIC: MARKET, BY SERVICE, 2017–2022 (USD MILLION)
                       TABLE 139 ASIA PACIFIC: MARKET, BY SERVICE, 2023–2028 (USD MILLION)
                       TABLE 140 ASIA PACIFIC: MARKET, BY LOCATION TYPE, 2017–2022 (USD MILLION)
                       TABLE 141 ASIA PACIFIC: MARKET, BY LOCATION TYPE, 2023–2028 (USD MILLION)
                       TABLE 142 ASIA PACIFIC: MARKET, BY APPLICATION, 2017–2022 (USD MILLION)
                       TABLE 143 ASIA PACIFIC: MARKET, BY APPLICATION, 2023–2028 (USD MILLION)
                       TABLE 144 ASIA PACIFIC: MARKET, BY VERTICAL, 2017–2022 (USD MILLION)
                       TABLE 145 ASIA PACIFIC: MARKET, BY VERTICAL, 2023–2028 (USD MILLION)
                       TABLE 146 ASIA PACIFIC: MARKET, BY COUNTRY, 2017–2022 (USD MILLION)
                       TABLE 147 ASIA PACIFIC: MARKET, BY COUNTRY, 2023–2028 (USD MILLION)
             11.4.3 CHINA
                       11.4.3.1 Growing demand for location-based services in various industries to boost market
                                   TABLE 148 CHINA: LBS AND RTLS MARKET, BY OFFERING, 2017–2022 (USD MILLION)
                                   TABLE 149 CHINA: MARKET, BY OFFERING, 2023–2028 (USD MILLION)
                                   TABLE 150 CHINA: MARKET, BY SERVICE, 2017–2022 (USD MILLION)
                                   TABLE 151 CHINA: MARKET, BY SERVICE, 2023–2028 (USD MILLION)
                                   TABLE 152 CHINA: MARKET, BY LOCATION TYPE, 2017–2022 (USD MILLION)
                                   TABLE 153 CHINA: MARKET, BY LOCATION TYPE, 2023–2028 (USD MILLION)
                                   TABLE 154 CHINA: MARKET, BY APPLICATION, 2017–2022 (USD MILLION)
                                   TABLE 155 CHINA: MARKET, BY APPLICATION, 2023–2028 (USD MILLION)
                                   TABLE 156 CHINA: MARKET, BY VERTICAL, 2017–2022 (USD MILLION)
                                   TABLE 157 CHINA: MARKET, BY VERTICAL, 2023–2028 (USD MILLION)
             11.4.4 JAPAN
                       11.4.4.1 Rising adoption of GPS-enabled solutions to fuel market growth
                                   TABLE 158 JAPAN: LBS AND RTLS MARKET, BY OFFERING, 2017–2022 (USD MILLION)
                                   TABLE 159 JAPAN: MARKET, BY OFFERING, 2023–2028 (USD MILLION)
                                   TABLE 160 JAPAN: MARKET, BY SERVICE, 2017–2022 (USD MILLION)
                                   TABLE 161 JAPAN: MARKET, BY SERVICE, 2023–2028 (USD MILLION)
                                   TABLE 162 JAPAN: MARKET, BY LOCATION TYPE, 2017–2022 (USD MILLION)
                                   TABLE 163 JAPAN: MARKET, BY LOCATION TYPE, 2023–2028 (USD MILLION)
                                   TABLE 164 JAPAN: MARKET, BY APPLICATION, 2017–2022 (USD MILLION)
                                   TABLE 165 JAPAN: MARKET, BY APPLICATION, 2023–2028 (USD MILLION)
                                   TABLE 166 JAPAN: MARKET, BY VERTICAL, 2017–2022 (USD MILLION)
                                   TABLE 167 JAPAN: MARKET, BY VERTICAL, 2023–2028 (USD MILLION)
             11.4.5 INDIA
                       11.4.5.1 Rising demand for accurate navigation and mapping services to drive market
             11.4.6 AUSTRALIA & NEW ZEALAND
                       11.4.6.1 Increasing need for location intelligence services to accelerate market growth
             11.4.7 SOUTH KOREA
                       11.4.7.1 Expansion of IoT ecosystem and development of advanced 5G infrastructure to drive market
             11.4.8 SOUTHEAST ASIA
                       11.4.8.1 Growing need for digitization to propel market growth
             11.4.9 REST OF ASIA PACIFIC
     11.5 MIDDLE EAST & AFRICA 
             11.5.1 MIDDLE EAST & AFRICA: MARKET DRIVERS
             11.5.2 MIDDLE EAST & AFRICA: RECESSION IMPACT
                       TABLE 168 MIDDLE EAST & AFRICA: LBS AND RTLS MARKET, BY OFFERING, 2017–2022 (USD MILLION)
                       TABLE 169 MIDDLE EAST & AFRICA: MARKET, BY OFFERING, 2023–2028 (USD MILLION)
                       TABLE 170 MIDDLE EAST & AFRICA: MARKET, BY SERVICE, 2017–2022 (USD MILLION)
                       TABLE 171 MIDDLE EAST & AFRICA: MARKET, BY SERVICE, 2023–2028 (USD MILLION)
                       TABLE 172 MIDDLE EAST & AFRICA: MARKET, BY LOCATION TYPE, 2017–2022 (USD MILLION)
                       TABLE 173 MIDDLE EAST & AFRICA: MARKET, BY LOCATION TYPE, 2023–2028 (USD MILLION)
                       TABLE 174 MIDDLE EAST & AFRICA: MARKET, BY APPLICATION, 2017–2022 (USD MILLION)
                       TABLE 175 MIDDLE EAST & AFRICA: MARKET, BY APPLICATION, 2023–2028 (USD MILLION)
                       TABLE 176 MIDDLE EAST & AFRICA: MARKET, BY VERTICAL, 2017–2022 (USD MILLION)
                       TABLE 177 MIDDLE EAST & AFRICA: MARKET, BY VERTICAL, 2023–2028 (USD MILLION)
                       TABLE 178 MIDDLE EAST & AFRICA: MARKET, BY COUNTRY, 2017–2022 (USD MILLION)
                       TABLE 179 MIDDLE EAST & AFRICA: MARKET, BY COUNTRY, 2023–2028 (USD MILLION)
                       TABLE 180 MIDDLE EAST & AFRICA: MARKET, BY GCC COUNTRY, 2017–2022 (USD MILLION)
                       TABLE 181 MIDDLE EAST & AFRICA: MARKET, BY GCC COUNTRY, 2023–2028 (USD MILLION)
             11.5.3 GCC COUNTRIES
                       11.5.3.1 UAE
                                   11.5.3.1.1 Technological advancements and ongoing digital transformation initiatives to boost market
                       11.5.3.2 KSA
                                   11.5.3.2.1 Government initiatives and technological improvements to accelerate market growth
                       11.5.3.3 Rest of GCC countries
             11.5.4 SOUTH AFRICA
                       11.5.4.1 Rising demand for asset tracking and increasing mobile phone penetration to fuel market growth
             11.5.5 REST OF MIDDLE EAST & AFRICA
     11.6 LATIN AMERICA 
             11.6.1 LATIN AMERICA: MARKET DRIVERS
             11.6.2 LATIN AMERICA: RECESSION IMPACT
                       TABLE 182 LATIN AMERICA: LBS AND RTLS MARKET, BY OFFERING, 2017–2022 (USD MILLION)
                       TABLE 183 LATIN AMERICA: MARKET, BY OFFERING, 2023–2028 (USD MILLION)
                       TABLE 184 LATIN AMERICA: MARKET, BY SERVICE, 2017–2022 (USD MILLION)
                       TABLE 185 LATIN AMERICA: MARKET, BY SERVICE, 2023–2028 (USD MILLION)
                       TABLE 186 LATIN AMERICA: MARKET, BY LOCATION TYPE, 2017–2022 (USD MILLION)
                       TABLE 187 LATIN AMERICA: MARKET, BY LOCATION TYPE, 2023–2028 (USD MILLION)
                       TABLE 188 LATIN AMERICA: MARKET, BY APPLICATION, 2017–2022 (USD MILLION)
                       TABLE 189 LATIN AMERICA: MARKET, BY APPLICATION, 2023–2028 (USD MILLION)
                       TABLE 190 LATIN AMERICA: MARKET, BY VERTICAL, 2017–2022 (USD MILLION)
                       TABLE 191 LATIN AMERICA: MARKET, BY VERTICAL, 2023–2028 (USD MILLION)
                       TABLE 192 LATIN AMERICA: MARKET, BY COUNTRY, 2017–2022 (USD MILLION)
                       TABLE 193 LATIN AMERICA: MARKET, BY COUNTRY, 2023–2028 (USD MILLION)
             11.6.3 BRAZIL
                       11.6.3.1 Growing emphasis on digitalization and adoption of advanced technologies to fuel market growth
             11.6.4 MEXICO
                       11.6.4.1 Need for operational efficiency to trigger market growth
             11.6.5 REST OF LATIN AMERICA
 
12 COMPETITIVE LANDSCAPE (Page No. - 196)
     12.1 OVERVIEW 
     12.2 KEY PLAYER STRATEGIES/RIGHT TO WIN 
             12.2.1 OVERVIEW OF STRATEGIES ADOPTED BY KEY LBS AND RTLS PROVIDERS
     12.3 REVENUE ANALYSIS 
               FIGURE 31 HISTORICAL REVENUE ANALYSIS, 2020–2022
     12.4 MARKET SHARE ANALYSIS 
               FIGURE 32 LBS AND RTLS MARKET SHARE ANALYSIS, 2022
               TABLE 194 MARKET: DEGREE OF COMPETITION
     12.5 COMPANY EVALUATION MATRIX 
             12.5.1 STARS
             12.5.2 EMERGING LEADERS
             12.5.3 PERVASIVE PLAYERS
             12.5.4 PARTICIPANTS
                       FIGURE 33 COMPANY EVALUATION MATRIX FOR KEY PLAYERS, 2022
             12.5.5 COMPANY FOOTPRINT
                       TABLE 195 OVERALL COMPANY FOOTPRINT
                       TABLE 196 OFFERING FOOTPRINT
                       TABLE 197 VERTICAL FOOTPRINT
                       TABLE 198 REGIONAL FOOTPRINT
     12.6 STARTUP/SME EVALUATION MATRIX 
             12.6.1 PROGRESSIVE COMPANIES
             12.6.2 RESPONSIVE COMPANIES
             12.6.3 DYNAMIC COMPANIES
             12.6.4 STARTING BLOCKS
                       FIGURE 34 COMPANY STARTUP/SME EVALUATION MATRIX, 2022
             12.6.5 COMPETITIVE BENCHMARKING
                       TABLE 199 DETAILED LIST OF KEY STARTUPS/SMES
                       TABLE 200 COMPETITIVE BENCHMARKING
     12.7 COMPETITIVE SCENARIO AND TRENDS 
             12.7.1 PRODUCT LAUNCHES
                       TABLE 201 MARKET: PRODUCT LAUNCHES, 2020–2023
             12.7.2 DEALS
                       TABLE 202 MARKET: DEALS, 2020–2023
     12.8 LBS AND RTLS MARKET: PRODUCT BENCHMARKING 
             12.8.1 PROMINENT LBS AND RTLS VENDORS
                       TABLE 203 COMPARATIVE ANALYSIS OF PROMINENT LBS AND RTLS VENDORS
     12.9 VALUATION AND FINANCIAL METRICS OF KEY LBS AND RTLS PROVIDERS 
               FIGURE 35 VALUATION AND FINANCIAL METRICS OF KEY LBS AND RTLS VENDORS
 
13 COMPANY PROFILES (Page No. - 214)
(Business overview, Products/Solutions/Services offered, Recent Developments, MnM view, Key strengths, Strategic choices, Weaknesses and competitive threats)*
     13.1 MAJOR PLAYERS 
             13.1.1 CISCO
                       TABLE 204 CISCO: COMPANY OVERVIEW
                       FIGURE 36 CISCO: COMPANY SNAPSHOT
                       TABLE 205 CISCO: PRODUCTS/SOLUTIONS/SERVICES OFFERED
                       TABLE 206 CISCO: PRODUCT LAUNCHES
                       TABLE 207 CISCO: DEALS
             13.1.2 GOOGLE
                       TABLE 208 GOOGLE: COMPANY OVERVIEW
                       FIGURE 37 GOOGLE: COMPANY SNAPSHOT
                       TABLE 209 GOOGLE: PRODUCTS/SOLUTIONS/SERVICES OFFERED
                       TABLE 210 GOOGLE: PRODUCTS LAUNCHES
                       TABLE 211 GOOGLE: DEALS
             13.1.3 IBM
                       TABLE 212 IBM: COMPANY OVERVIEW
                       FIGURE 38 IBM: COMPANY SNAPSHOT
                       TABLE 213 IBM: PRODUCTS/SOLUTIONS/SERVICES OFFERED
                       TABLE 214 IBM: DEALS
             13.1.4 MICROSOFT
                       TABLE 215 MICROSOFT: COMPANY OVERVIEW
                       FIGURE 39 MICROSOFT: COMPANY SNAPSHOT
                       TABLE 216 MICROSOFT: PRODUCTS/SOLUTIONS/SERVICES OFFERED
                       TABLE 217 MICROSOFT: PRODUCT LAUNCHES
                       TABLE 218 MICROSOFT: DEALS
             13.1.5 ORACLE
                       TABLE 219 ORACLE: COMPANY OVERVIEW
                       FIGURE 40 ORACLE: COMPANY SNAPSHOT
                       TABLE 220 ORACLE: PRODUCTS/SOLUTIONS/SERVICES OFFERED
                       TABLE 221 ORACLE: PRODUCT LAUNCHES
                       TABLE 222 ORACLE: DEALS
             13.1.6 ERICSSON
                       TABLE 223 ERICSSON: BUSINESS OVERVIEW
                       FIGURE 41 ERICSSON: COMPANY SNAPSHOT
                       TABLE 224 ERICSSON: PRODUCTS/SOLUTIONS/SERVICES OFFERED
                       TABLE 225 ERICSSON: OTHERS
             13.1.7 QUALCOMM
                       TABLE 226 QUALCOMM: BUSINESS OVERVIEW
                       FIGURE 42 QUALCOMM: COMPANY SNAPSHOT
                       TABLE 227 QUALCOMM: PRODUCTS/SOLUTIONS/SERVICES OFFERED
                       TABLE 228 QUALCOMM: PRODUCT LAUNCHES
             13.1.8 TOMTOM
                       TABLE 229 TOMTOM: COMPANY OVERVIEW
                       FIGURE 43 TOMTOM: COMPANY SNAPSHOT
                       TABLE 230 TOMTOM: PRODUCTS/SOLUTIONS/SERVICES OFFERED
                       TABLE 231 TOMTOM: PRODUCT LAUNCHES
                       TABLE 232 TOMTOM: DEALS
             13.1.9 ZEBRA TECHNOLOGIES CORP.
                       TABLE 233 ZEBRA TECHNOLOGIES: COMPANY OVERVIEW
                       FIGURE 44 ZEBRA TECHNOLOGIES: COMPANY SNAPSHOT
                       TABLE 234 ZEBRA TECHNOLOGIES: PRODUCTS/SOLUTIONS/SERVICES OFFERED
                       TABLE 235 ZEBRA TECHNOLOGIES: DEALS
             13.1.10 ESRI
                       TABLE 236 ESRI: COMPANY OVERVIEW
                       TABLE 237 ESRI: PRODUCTS/SOLUTIONS/SERVICES OFFERED
                       TABLE 238 ESRI: PRODUCT LAUNCHES
                       TABLE 239 ESRI: DEALS
*Details on Business overview, Products/Solutions/Services offered, Recent Developments, MnM view, Key strengths, Strategic choices, Weaknesses and competitive threats might not be captured in case of unlisted companies.
     13.2 OTHER PLAYERS 
             13.2.1 TELDIO
             13.2.2 HERE TECHNOLOGIES
             13.2.3 UBISENSE
             13.2.4 APPLE
             13.2.5 SECURITAS HEALTHCARE
             13.2.6 GE HEALTHCARE
             13.2.7 CENTRAK
             13.2.8 IDENTEC GROUP
             13.2.9 INFOR
             13.2.10 TELETRACKING TECHNOLOGIES
             13.2.11 MYSPHERA
             13.2.12 HPE ARUBA NETWORKING
             13.2.13 KDDI CORPORATION
             13.2.14 NTT DOCOMO
             13.2.15 AIRISTA FLOW
             13.2.16 LEANTEGRA
             13.2.17 SEWIO NETWORKS
             13.2.18 QUUPPA
             13.2.19 NAVIGINE
             13.2.20 LIVING MAP
 
14 ADJACENT MARKETS (Page No. - 259)
     14.1 INTRODUCTION TO ADJACENT MARKETS 
               TABLE 240 ADJACENT MARKETS AND FORECASTS
     14.2 LIMITATIONS 
     14.3 LOCATION ANALYTICS MARKET 
               TABLE 241 LOCATION ANALYTICS MARKET, BY OFFERING, 2017–2022 (USD MILLION)
               TABLE 242 LOCATION ANALYTICS MARKET, BY OFFERING, 2023–2028 (USD MILLION)
               TABLE 243 SOLUTIONS: LOCATION ANALYTICS MARKET, BY TYPE, 2017–2022 (USD MILLION)
               TABLE 244 SOLUTIONS: LOCATION ANALYTICS MARKET, BY TYPE, 2023–2028 (USD MILLION)
               TABLE 245 GEOCODING & REVERSE GEOCODING: LOCATION ANALYTICS MARKET, BY REGION, 2017–2022 (USD MILLION)
               TABLE 246 GEOCODING & REVERSE GEOCODING: LOCATION ANALYTICS MARKET, BY REGION, 2023–2028 (USD MILLION)
               TABLE 247 DATA INTEGRATION & ETL: LOCATION ANALYTICS MARKET, BY REGION, 2017–2022 (USD MILLION)
               TABLE 248 DATA INTEGRATION & ETL: LOCATION ANALYTICS MARKET, BY REGION, 2023–2028 (USD MILLION)
               TABLE 249 REPORTING & VISUALIZATION: LOCATION ANALYTICS MARKET, BY REGION, 2017–2022 (USD MILLION)
               TABLE 250 REPORTING & VISUALIZATION: LOCATION ANALYTICS MARKET, BY REGION, 2023–2028 (USD MILLION)
               TABLE 251 THEMATIC MAPPING & SPATIAL ANALYSIS: LOCATION ANALYTICS MARKET, BY REGION, 2017–2022 (USD MILLION)
               TABLE 252 THEMATIC MAPPING & SPATIAL ANALYSIS: LOCATION ANALYTICS MARKET, BY REGION, 2023–2028 (USD MILLION)
               TABLE 253 OTHER SOLUTIONS: LOCATION ANALYTICS MARKET, BY REGION, 2017–2022 (USD MILLION)
               TABLE 254 OTHER SOLUTIONS: LOCATION ANALYTICS MARKET, BY REGION, 2023–2028 (USD MILLION)
               TABLE 255 LOCATION ANALYTICS MARKET, BY DEPLOYMENT, 2017–2022 (USD MILLION)
               TABLE 256 LOCATION ANALYTICS MARKET, BY DEPLOYMENT, 2023–2028 (USD MILLION)
               TABLE 257 ON-PREMISES: LOCATION ANALYTICS MARKET, BY REGION, 2017–2022 (USD MILLION)
               TABLE 258 ON-PREMISES: LOCATION ANALYTICS MARKET, BY REGION, 2023–2028 (USD MILLION)
               TABLE 259 CLOUD: LOCATION ANALYTICS MARKET, BY REGION, 2017–2022 (USD MILLION)
               TABLE 260 CLOUD: LOCATION ANALYTICS MARKET, BY REGION, 2023–2028 (USD MILLION)
               TABLE 261 LOCATION ANALYTICS MARKET, BY SERVICE, 2017–2022 (USD MILLION)
               TABLE 262 LOCATION ANALYTICS MARKET, BY SERVICE, 2023–2028 (USD MILLION)
               TABLE 263 SERVICES: LOCATION ANALYTICS MARKET, BY REGION, 2017–2022 (USD MILLION)
               TABLE 264 SERVICES: LOCATION ANALYTICS MARKET, BY REGION, 2023–2028 (USD MILLION)
               TABLE 265 LOCATION ANALYTICS MARKET, BY PROFESSIONAL SERVICE, 2017–2022 (USD MILLION)
               TABLE 266 LOCATION ANALYTICS MARKET, BY PROFESSIONAL SERVICE, 2023–2028 (USD MILLION)
               TABLE 267 PROFESSIONAL SERVICES: LOCATION ANALYTICS MARKET, BY REGION, 2017–2022 (USD MILLION)
               TABLE 268 PROFESSIONAL SERVICES: LOCATION ANALYTICS MARKET, BY REGION, 2023–2028 (USD MILLION)
               TABLE 269 CONSULTING SERVICES: LOCATION ANALYTICS MARKET, BY REGION, 2017–2022 (USD MILLION)
               TABLE 270 CONSULTING SERVICES: LOCATION ANALYTICS MARKET, BY REGION, 2023–2028 (USD MILLION)
               TABLE 271 DEPLOYMENT & INTEGRATION: LOCATION ANALYTICS MARKET, BY REGION, 2017–2022 (USD MILLION)
               TABLE 272 DEPLOYMENT & INTEGRATION: LOCATION ANALYTICS MARKET, BY REGION, 2023–2028 (USD MILLION)
               TABLE 273 TRAINING, SUPPORT, AND MAINTENANCE: LOCATION ANALYTICS MARKET, BY REGION, 2017–2022 (USD MILLION)
               TABLE 274 TRAINING, SUPPORT, AND MAINTENANCE: LOCATION ANALYTICS MARKET, BY REGION, 2023–2028 (USD MILLION)
               TABLE 275 MANAGED SERVICES: LOCATION ANALYTICS MARKET, BY REGION, 2017–2022 (USD MILLION)
               TABLE 276 MANAGED SERVICES: LOCATION ANALYTICS MARKET, BY REGION, 2023–2028 (USD MILLION)
               TABLE 277 LOCATION ANALYTICS MARKET, BY LOCATION TYPE, 2017–2022 (USD MILLION)
               TABLE 278 LOCATION ANALYTICS MARKET, BY LOCATION TYPE, 2023–2028 (USD MILLION)
               TABLE 279 INDOOR LOCATION: LOCATION ANALYTICS MARKET, BY REGION, 2017–2022 (USD MILLION)
               TABLE 280 INDOOR LOCATION: LOCATION ANALYTICS MARKET, BY REGION, 2023–2028 (USD MILLION)
               TABLE 281 OUTDOOR LOCATION: LOCATION ANALYTICS MARKET, BY REGION, 2017–2022 (USD MILLION)
               TABLE 282 OUTDOOR LOCATION: LOCATION ANALYTICS MARKET, BY REGION, 2023–2028 (USD MILLION)
               TABLE 283 LOCATION ANALYTICS MARKET, BY APPLICATION, 2017–2022 (USD MILLION)
               TABLE 284 LOCATION ANALYTICS MARKET, BY APPLICATION, 2023–2028 (USD MILLION)
               TABLE 285 RISK MANAGEMENT: LOCATION ANALYTICS MARKET, BY REGION, 2017–2022 (USD MILLION)
               TABLE 286 RISK MANAGEMENT: LOCATION ANALYTICS MARKET, BY REGION, 2023–2028 (USD MILLION)
               TABLE 287 EMERGENCY RESPONSE MANAGEMENT: LOCATION ANALYTICS MARKET, BY REGION, 2017–2022 (USD MILLION)
               TABLE 288 EMERGENCY RESPONSE MANAGEMENT: LOCATION ANALYTICS MARKET, BY REGION, 2023–2028 (USD MILLION)
               TABLE 289 CUSTOMER EXPERIENCE MANAGEMENT: LOCATION ANALYTICS MARKET, BY REGION, 2017–2022 (USD MILLION)
               TABLE 290 CUSTOMER EXPERIENCE MANAGEMENT: LOCATION ANALYTICS MARKET, BY REGION, 2023–2028 (USD MILLION)
               TABLE 291 SUPPLY CHAIN PLANNING & OPTIMIZATION: LOCATION ANALYTICS MARKET, BY REGION, 2017–2022 (USD MILLION)
               TABLE 292 SUPPLY CHAIN PLANNING & OPTIMIZATION: LOCATION ANALYTICS MARKET, BY REGION, 2023–2028 (USD MILLION)
               TABLE 293 SALES & MARKETING OPTIMIZATION: LOCATION ANALYTICS MARKET, BY REGION, 2017–2022 (USD MILLION)
               TABLE 294 SALES & MARKETING OPTIMIZATION: LOCATION ANALYTICS MARKET, BY REGION, 2023–2028 (USD MILLION)
               TABLE 295 LOCATION SELECTION & OPTIMIZATION: LOCATION ANALYTICS MARKET, BY REGION, 2017–2022 (USD MILLION)
               TABLE 296 LOCATION SELECTION & OPTIMIZATION: LOCATION ANALYTICS MARKET, BY REGION, 2023–2028 (USD MILLION)
               TABLE 297 OTHER APPLICATIONS: LOCATION ANALYTICS MARKET, BY REGION, 2017–2022 (USD MILLION)
               TABLE 298 OTHER APPLICATIONS: LOCATION ANALYTICS MARKET, BY REGION, 2023–2028 (USD MILLION)
               TABLE 299 LOCATION ANALYTICS MARKET, BY VERTICAL, 2017–2022 (USD MILLION)
               TABLE 300 LOCATION ANALYTICS MARKET, BY VERTICAL, 2023–2028 (USD MILLION)
               TABLE 301 RETAIL & ECOMMERCE: LOCATION ANALYTICS MARKET, BY REGION, 2017–2022 (USD MILLION)
               TABLE 302 RETAIL & ECOMMERCE: LOCATION ANALYTICS MARKET, BY REGION, 2023–2028 (USD MILLION)
               TABLE 303 MANUFACTURING: LOCATION ANALYTICS MARKET, BY REGION, 2017–2022 (USD MILLION)
               TABLE 304 MANUFACTURING: LOCATION ANALYTICS MARKET, BY REGION, 2023–2028 (USD MILLION)
               TABLE 305 GOVERNMENT & DEFENSE: LOCATION ANALYTICS MARKET, BY REGION, 2017–2022 (USD MILLION)
               TABLE 306 GOVERNMENT & DEFENSE: LOCATION ANALYTICS MARKET, BY REGION, 2023–2028 (USD MILLION)
               TABLE 307 MEDIA & ENTERTAINMENT: LOCATION ANALYTICS MARKET, BY REGION, 2017–2022 (USD MILLION)
               TABLE 308 MEDIA & ENTERTAINMENT: LOCATION ANALYTICS MARKET, BY REGION, 2023–2028 (USD MILLION)
               TABLE 309 AUTOMOTIVE, TRANSPORTATION, AND LOGISTICS: LOCATION ANALYTICS MARKET, BY REGION, 2017–2022 (USD MILLION)
               TABLE 310 AUTOMOTIVE, TRANSPORTATION, AND LOGISTICS: LOCATION ANALYTICS MARKET, BY REGION, 2023–2028 (USD MILLION)
               TABLE 311 ENERGY & UTILITIES: LOCATION ANALYTICS MARKET, BY REGION, 2017–2022 (USD MILLION)
               TABLE 312 ENERGY & UTILITIES: LOCATION ANALYTICS MARKET, BY REGION, 2023–2028 (USD MILLION)
               TABLE 313 TELECOMMUNICATIONS: LOCATION ANALYTICS MARKET, BY REGION, 2017–2022 (USD MILLION)
               TABLE 314 TELECOMMUNICATIONS: LOCATION ANALYTICS MARKET, BY REGION, 2023–2028 (USD MILLION)
               TABLE 315 BFSI: LOCATION ANALYTICS MARKET, BY REGION, 2017–2022 (USD MILLION)
               TABLE 316 BFSI: LOCATION ANALYTICS MARKET, BY REGION, 2023–2028 (USD MILLION)
               TABLE 317 IT/ITES: LOCATION ANALYTICS MARKET, BY REGION, 2017–2022 (USD MILLION)
               TABLE 318 IT/ITES: LOCATION ANALYTICS MARKET, BY REGION, 2023–2028 (USD MILLION)
               TABLE 319 HEALTHCARE & LIFE SCIENCES: LOCATION ANALYTICS MARKET, BY REGION, 2017–2022 (USD MILLION)
               TABLE 320 HEALTHCARE & LIFE SCIENCES: LOCATION ANALYTICS MARKET, BY REGION, 2023–2028 (USD MILLION)
               TABLE 321 AGRICULTURE: LOCATION ANALYTICS MARKET, BY REGION, 2017–2022 (USD MILLION)
               TABLE 322 AGRICULTURE: LOCATION ANALYTICS MARKET, BY REGION, 2023–2028 (USD MILLION)
               TABLE 323 OTHER VERTICALS: LOCATION ANALYTICS MARKET, BY REGION, 2017–2022 (USD MILLION)
               TABLE 324 OTHER VERTICALS: LOCATION ANALYTICS MARKET, BY REGION, 2023–2028 (USD MILLION)
     14.4 INDOOR LOCATION MARKET 
               TABLE 325 INDOOR LOCATION MARKET, BY OFFERING, 2017–2022 (USD MILLION)
               TABLE 326 INDOOR LOCATION MARKET, BY OFFERING, 2023–2028 (USD MILLION)
               TABLE 327 SOLUTIONS: INDOOR LOCATION MARKET, BY TYPE, 2017–2022 (USD MILLION)
               TABLE 328 SOLUTIONS: INDOOR LOCATION MARKET, BY TYPE, 2023–2028 (USD MILLION)
               TABLE 329 INDOOR LOCATION MARKET, BY SERVICE, 2017–2022 (USD MILLION)
               TABLE 330 INDOOR LOCATION MARKET, BY SERVICE, 2023–2028 (USD MILLION)
               TABLE 331 INDOOR LOCATION MARKET, BY TECHNOLOGY, 2017–2022 (USD MILLION)
               TABLE 332 INDOOR LOCATION MARKET, BY TECHNOLOGY, 2023–2028 (USD MILLION)
               TABLE 333 INDOOR LOCATION MARKET, BY APPLICATION, 2017–2022 (USD MILLION)
               TABLE 334 INDOOR LOCATION MARKET, BY APPLICATION, 2023–2028 (USD MILLION)
               TABLE 335 INDOOR LOCATION MARKET, BY VERTICAL, 2017–2022 (USD MILLION)
               TABLE 336 INDOOR LOCATION MARKET, BY VERTICAL, 2023–2028 (USD MILLION)
               TABLE 337 INDOOR LOCATION MARKET, BY REGION, 2017–2022 (USD MILLION)
               TABLE 338 INDOOR LOCATION MARKET, BY REGION, 2023–2028 (USD MILLION)
 
15 APPENDIX (Page No. - 292)
     15.1 DISCUSSION GUIDE 
     15.2 KNOWLEDGESTORE: MARKETSANDMARKETS’ SUBSCRIPTION PORTAL 
     15.3 CUSTOMIZATION OPTIONS 
     15.4 RELATED REPORTS 
     15.5 AUTHOR DETAILS 

The study involved four major activities in estimating the current size of the global LBS and RTLS market. Exhaustive secondary research collected information on the market, peer, and parent markets. The next step was to validate these findings, assumptions, and sizing with industry experts across the value chain through primary research. Both top-down and bottom-up approaches were employed to estimate the total LBS and RTLS market size. After that, the market breakup and data triangulation techniques were used to estimate the market size of segments and subsegments.

Secondary Research

In the secondary research process, various secondary sources, such as Bloomberg and BusinessWeek, have been referred to identify and collect information for this study. The secondary sources included annual reports, press releases, and investor presentations of companies; white papers; journals, such as Linux Journal and Container Journal; and articles from recognized authors, directories, and databases.

Primary Research

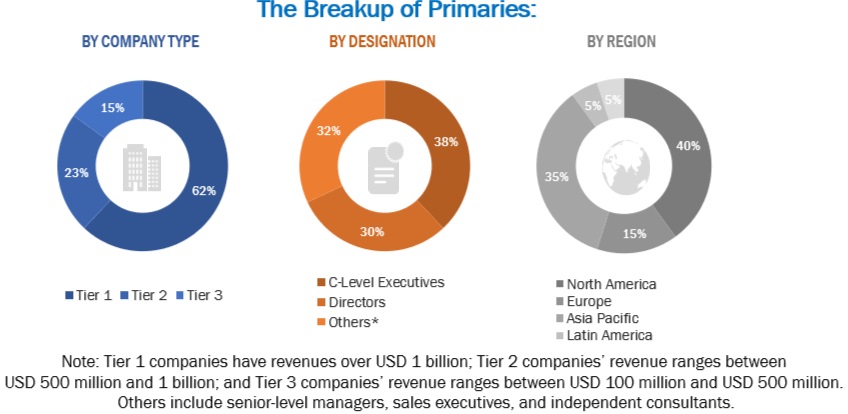
Various primary sources from the supply and demand sides were interviewed to obtain qualitative and quantitative information for this report. The primary sources from the supply side included industry experts, such as Chief Executive Officers (CEOs), Chief Marketing Officers (CMO), Vice Presidents (VPs), Managing Directors (MDs), technology and innovation directors, and related key executives from various key companies and organizations operating in the LBS and RTLS market along with the associated service providers, and system integrators working in the targeted regions. All possible parameters that affect the market covered in this research study have been accounted for, viewed in extensive detail, verified through primary research, and analyzed to get the final quantitative and qualitative data. Following is the breakup of primary respondents.
Location-based Services (LBS) and Real-Time Location Systems (RTLS) Market Size, and Share

To know about the assumptions considered for the study, download the pdf brochure

Market Size Estimation

The top-down and bottom-up approaches were used to estimate and forecast the LBS, RTLS, and other dependent submarkets. The bottom-up procedure was used to arrive at the overall market size of the global LBS and RTLS market using key companies’ revenue and their offerings in the market. The research methodology used to estimate the market size includes the following:

  • Extensive secondary research has identified the key LBS and RTLS market players.
  • Regarding value, the market size has been determined through primary and secondary research processes.
  • All percentage shares, splits, and breakups have been determined using secondary sources and verified through primary sources.

LBS and RTLS market Size: Bottom-Up Approach

Location-based Services (LBS) and Real-Time Location Systems (RTLS) Market Bottom Up Approach

To know about the assumptions considered for the study, Request for Free Sample Report

LBS and RTLS market Size: Top-Down Approach

Location-based Services (LBS) and Real-Time Location Systems (RTLS) Market Top Down Approach

Data Triangulation

With data triangulation and validation through primary interviews, this study determined and confirmed the exact value of the overall parent market size. The overall market size was then used in the top-down procedure to estimate the size of other individual markets via percentage splits of the market segmentation.

Market Definition

Location-Based Services (LBS) can be defined as an information service provided by a device that delivers and updates information related to the location of the device as and when required. Implementing LBS requires the software application of a service provider, network and mobile-device-based technology, and a content provider for geo-specific information.

Real-Time Location Systems (RTLS) are local positioning and tracking systems that automatically locate and identify objects, people, or targets in real-time. RTLS systems are usually used indoors or within a building or other areas. RTLS tags, badges, or sensors attached to objects or worn by people communicate wirelessly with fixed receivers, readers, trackers, exciters, reference points, or access points installed nearby.

Key Stakeholders

  • LBS application developers
  • LBS and RTLS software/service providers
  • Network connectivity providers
  • Wireless infrastructure providers
  • Mobile content developers and aggregators
  • Smart devices and consumer electronics manufacturers
  • Venture capitalists, private equity firms, and startups
  • Government bodies, such as regulating authorities and policymakers
  • LBS and RTLS-related associations, organizations, forums, and alliances

Report Objectives

  • To determine, segment, and forecast the global LBS and RTLS market based on offering, service, location type, application, technology, vertical, and region in terms of value.
  • To forecast the size of the market segments to five main regions: North America, Europe, Asia Pacific, Middle East and Africa, and Latin America.
  • To provide detailed information about the major factors (drivers, opportunities, threats, and challenges) influencing the growth of the market.
  • To study the complete value chain and related industry segments and perform a value chain analysis of the market landscape.
  • To strategically analyze the macro and micro markets to individual growth trends, prospects, and contributions to the total market.
  • To analyze the industry trends, patents, and innovations related to the market.
  • To analyze the opportunities for stakeholders by identifying the high-growth segments of the LBS and RTLS market.
  • To profile the key players in the market and comprehensively analyze their market share/ranking and core competencies.
  • Track and analyze competitive developments, such as mergers and acquisitions, product launches and developments, partnerships, agreements, collaborations, business expansions, and Research and development (R&D) activities.

Available Customizations

With the given market data, MarketsandMarkets offers customizations per the company’s specific needs. The following customization options are available for the report:

Company Information

  • Detailed analysis and profiling of an additional two market players
Custom Market Research Services

We will customize the research for you, in case the report listed above does not meet with your exact requirements. Our custom research will comprehensively cover the business information you require to help you arrive at strategic and profitable business decisions.

Request Customization

Instant Answers with GPT - Ask Now!

Ask real questions. Get complete answers !
Report Code
TC 2371
Published ON
Feb, 2024
Choose License Type
BUY NOW
  • SHARE
X
Request Customization
Speak to Analyst
Speak to Analyst
OR FACE-TO-FACE MEETING
PERSONALIZE THIS RESEARCH
  • Triangulate with your Own Data
  • Get Data as per your Format and Definition
  • Gain a Deeper Dive on a Specific Application, Geography, Customer or Competitor
  • Any level of Personalization
REQUEST A FREE CUSTOMIZATION
LET US HELP YOU!
  • What are the Known and Unknown Adjacencies Impacting the Location-based Services (LBS) and Real-Time Location Systems (RTLS) Market
  • What will your New Revenue Sources be?
  • Who will be your Top Customer; what will make them switch?
  • Defend your Market Share or Win Competitors
  • Get a Scorecard for Target Partners
CUSTOMIZED WORKSHOP REQUEST
+1-888-600-6441
  • Call Us
  • +1-888-600-6441 (Corporate office hours)
  • +1-888-600-6441 (US/Can toll free)
  • +44-800-368-9399 (UK office hours)
CONNECT WITH US
ABOUT TRUST ONLINE
©2024 MarketsandMarkets Research Private Ltd. All rights reserved
DMCA.com Protection Status Website Feedback