Low-Carbon Propulsion Market by Fuel Type (CNG, LNG, Ethanol, Electric and Hydrogen), Mode (Rail and Road), Vehicle Type (Heavy-Duty and Light-Duty), Rail Application (Passenger and Freight), Electric Vehicle, and Region - Global Forecast to 2027


Low-Carbon Propulsion Market
The governments of several countries are taking initiatives to promote clean sources of energy by implementing stringent emission norms. Alternative fuel driven vehicles will help meet these stringent emission regulations. Manufacturers are seeking viable solutions to fulfil future demand for ultra-low emissions in urban areas. They are attaining it primarily though combustion of alternative fuels such as compressed natural gas (CNG), liquefied natural gas (LNG), ethanol, electric, and hydrogen.
Key Drivers
- Increasing demand for emission-free vehicles and energy-efficient transport
- Vehicle conversions and fluctuations in fuel prices
Key Restraints
- High cost involved with technologies and components
- Infrastructure for alternate fuel vehicles
Top Players
- Tesla (US)
- BYD (China)
- Yutong (China)
- Proterra (US)
- Nissan (Japan)
- Bombardier (Canada)
- Siemens (Germany)
- Alstom (France)
- Toyota (Japan)
- Honda (Japan)
- Hyundai (South Korea)
- MAN SE (Germany)
- Tesla – Tesla was established in 2003 with its headquarters in California. The company operates in two business segments: Automotive and Energy Generation and Storage. In the Automotive segment, Tesla designs and manufactures electric vehicles, electric components, and systems. Vehicle bodies, chassis, interiors, and low voltage electrical systems are produced in-house. In March 2019, Tesla unveiled V3, a completely new architecture for Supercharging. With V3, Tesla will enable its vehicles to charge faster than any other electric vehicle in the market.
- BYD – BYD (Build Your Dreams) specializes in manufacturing electric vehicles. It was established in 1995 and is headquartered in Shenzhen, China. The company is the largest electric vehicle manufacturer in the world. In April 2019, BYD announced the launch of the K12A, the world's first 27-meter pure electric bus. With a passenger capacity of 250 people, it is the longest pure electric bus in the world and can travel at a maximum speed of 70 km/h. Additionally, it is also the world's first electric bus equipped with a distributed 4WD system, which can switch between 2WD and 4WD smoothly to meet the demands of different terrains, while also lowering the vehicle's overall energy consumption.
- Yutong – Yutong is a bus manufacturer and a leader in the Chinese market. The company was founded in 1993 and is headquartered in Zhengzhou, China. The company claims to have delivered 63,526 bus units in 2018, out of which 24,748 were electric. It is leading the Chinese bus market in terms of sales with more than 32% of market share and has around 15% market share in the global bus market. In November 2018, In the Euro Bus Expo 2018, held at the National Exhibition Center in Birmingham, UK, Yutong exhibited its major products for this area, including newly-launched high-end tourism coach T122 with right hand drive, 10-meter full electric city bus E10, and ZK6398HQ that has 70% share in the segment market.
Low Carbon Propulsion Market and Key Application/ Technology/ Industry
- Fuel cell for heavy load transportation – Currently, fuel cells are used in passenger cars, industrial vehicles, and commercial vehicles. With increasing R&D in the field of fuel cell technology, the cost of a fuel cell is expected to decrease, allowing the use of fuel cells in other segments of transportation. In the coming years, fuel cells are expected to be used in heavy load transportation such as passenger ships, trains, trams, and as synthetic fuel (synfuel) in freight ships and airplanes. Initiatives have been taken for using fuel cells in heavy load transportation. For instance, Germany launched the world’s first fuel cell-powered train in September 2018 named ‘Coradia iLint.’ The train has a driving range of 1,000 km (621 miles) and maximum speed of 140 km/hr.
- Electric propulsion in trains – All electrically powered vehicles have significant emission benefits over conventional ICE vehicles. These vehicles can directly draw electricity from the grid or other off-board electrical power sources and store it in batteries. Because of the advantages electric propulsion offers, governments and OEMs across the globe have shifted their focus on electrifying all the mediums of transportation. For instance, Bombardier transportation introduced the new Electro-Hybrid Train Talent 3 in September 2018. This train does not generate any exhaust and sets standards for smart mobility with peak values of 90% in the areas of efficiency and recyclability. It is also around 50% quieter than modern diesel trains.
- CNG Propulsion – CNG is natural gas under pressure which is clear, odorless, and non-corrosive. CNG is a cost effective and green fuel alternative to petrol and diesel fuels for vehicles. The fuel is stored in a compressed gaseous state at a pressure of up to 3,600 pounds PSI for utilization in vehicles. CNG as an alternative to fuels is used in light- and heavy-duty vehicles.
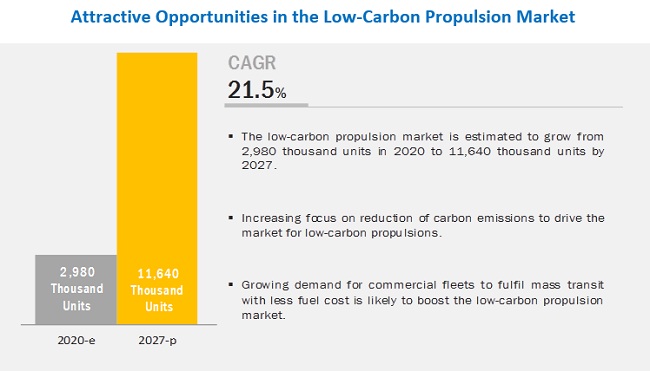
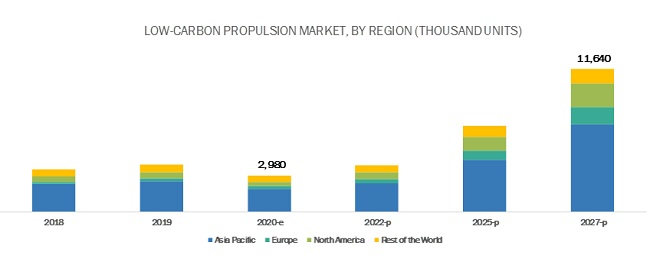
[225 Pages Report] The global low-carbon propulsion market size is estimated to be 2,980 thousand units in 2020. It is projected to grow at a CAGR of 21.5% to reach 11,640 thousand units by 2027. Technological advancements to improve the emission standards by conventional conversions of vehicles and proposed range extensions with fuel efficiency by alternative fuels in commercial vehicles are a propelling factor for low-carbon propulsions.
The electric passenger car segment is expected to have the largest market in, by electric vehicle type, during the forecast period.
Countries such as China have a lower waiting period for electric vehicles than ICE vehicles. Due to the growing stringency of emission norms, European countries such as Germany are planning to have 1 million electric vehicles on the road by the end of 2020. China dominates the market for electric passenger cars, followed by the US.
The COVID-19 impact on electric passenger cars can show a positive response as citizens worldwide would prefer private cars over public transportation. For instance, ever since China lifted its lockdown, the number of private cars on roads in Beijing and other cities has almost doubled, and there has been an increase in new car dealerships. In Chinese cities, many residents have shown the intention of new car purchases.
The hydrogen segment is expected to be the fastest-growing market in the low-carbon propulsion market, by fuel type, during the forecast period.
Hydrogen as a fuel is an emission-free alternative that can be obtained from various sources such as fossil fuels, natural gas, and water, among others. It can be produced from various techniques such as the thermochemical process, electrolytic process, direct solar water splitting process, and biological processes. Hydrogen is produced with the help of heat and chemical reactions in a thermochemical process. Resources such as natural gas, coal, or biomass are used for hydrogen production in the thermochemical process. Light energy is used in the direct solar process to split hydrogen and oxygen atoms in water. Currently, the process is in a developing stage but offers long-term benefits of low environmental impact and potential sustainable hydrogen production process.
North America is expected to lead the market since the US is prone to high air pollution levels. Consumption of gasoline is maximum in the region, which leads to the emission of nitrogen oxides (NOx), hydrocarbons (HC), and particulate matter (PM). Hydrogen-powered fuel cell vehicles emit no harmful substances since they release only water and warm air. The environmental and health precautions required in the US are expected to drive hydrogen production to achieve low or zero-emission goals.
Europe is expected to account for the fastest market during the forecast period.
Europe has been at the forefront of improving the safety and fuel efficiency of commercial vehicles, for which the EU institutions have announced their plans to replace gasoline and diesel stations with CNG, LNG, electric, and other biofuels. Though electric vehicles present a clearer path to decarbonization in transport, biomethane as a fuel remains a favored option for heavy-duty vehicles. Thus, CNG and LNG represent a major source of renewable fuels for low-carbon propulsion in Europe.
Europe's targets for 2021 are the most stringent in the world. The 2021 targets for the European fleet are far tougher to achieve than those in the US, China, or Japan (US: 121g, Japan: 117g, China: 119g). Thus, auto manufacturers, distributors, and fuel providers are taking measures to fulfill the targets.
Key Market Players
The major players in the low-carbon market include Tesla (US), BYD (China), Nissan Motor (Japan), Yutong (China), and Proterra (US).
BYD is another key player in the low-carbon propulsion market. Moreover, BYD designs and assembles a wide range of electric buses. The company has a presence in various regions, including China, the US, Europe, and India. BYD has collaborated with many city transport authorities across the world, providing electric buses of different specifications and sizes. For instance, in February 2019, 25 electric buses developed by BYD were introduced for public transport in Pune, India.
Scope of the Report
|
Report Metric |
Details |
|
Market Size Available for Years |
2018–2027 |
|
Base Year Considered |
2018 |
|
Forecast Period |
2020–2027 |
|
Forecast Units |
Volume (Thousand Units) |
|
Segments Covered |
Fuel type, mode, vehicle type, electric vehicle, rail application, and region. |
|
Geographies Covered |
Asia Pacific, Europe, North America, and the Rest of the World. |
|
Companies Covered |
Tesla (US), BYD (China), Nissan (Japan), Yutong (China), and Proterra (US). |
This research report categorizes the low-carbon propulsion market based on fuel type, mode, vehicle type, electric vehicle, rail application, and region.
By Fuel Type
- Compressed Natural Gas (CNG)
- Liquefied Natural Gas (LNG)
- Ethanol
- Hydrogen
- Electric
By Mode
- Rail
- Road
By Vehicle Type
- Heavy-Duty
- Light-Duty
By Rail Application
- Passenger
- Freight
By Electric Vehicle
- Electric Passenger Car
- Electric Bus
- Electric Two-Wheeler
- Electric Off-Highway
By Region
- Asia Pacific
- Europe
- North America
- RoW
Key questions addressed by the report
- Where will all these developments take the industry in the mid- to long-term?
- How is the increasing adoption of alternative fuel vehicles and changing environmental norms affecting the low-carbon propulsion market?
- What are the upcoming models in commercial vehicles driven by renewable fuels?
- Who are the key players in the market, and how intense is the competition?
- How will the combination of low-carbon emission technology and high-speed range will work on a road and rail transport modes?
To speak to our analyst for a discussion on the above findings, click Speak to Analyst
 Exclusive indicates content/data unique to MarketsandMarkets and not available with any competitors.
TABLE OF CONTENT
1 INTRODUCTION (Page No. - 20)
1.1 OBJECTIVES OF THE STUDY
1.2 MARKET DEFINITION
1.2.1 INCLUSIONS & EXCLUSIONS
1.3 MARKET SCOPE
1.3.1 YEARS CONSIDERED FOR THE STUDY
1.4 PACKAGE SIZE
1.5 LIMITATIONS
1.6 STAKEHOLDERS
2 RESEARCH METHODOLOGY (Page No. - 23)
2.1 RESEARCH DATA
2.2 SECONDARY DATA
2.2.1 KEY SECONDARY SOURCES
2.2.2 KEY DATA FROM SECONDARY SOURCES
2.3 PRIMARY DATA
2.3.1 SAMPLING TECHNIQUES & DATA COLLECTION METHODS
2.3.2 PRIMARY PARTICIPANTS
2.4 MARKET SIZE ESTIMATION
2.4.1 BOTTOM-UP APPROACH
2.4.2 TOP-DOWN APPROACH
2.5 MARKET BREAKDOWN AND DATA TRIANGULATION
2.6 ASSUMPTIONS
3 EXECUTIVE SUMMARY (Page No. - 33)
4 PREMIUM INSIGHTS (Page No. - 38)
4.1 LOW-CARBON PROPULSION MARKET TO GROW AT A SIGNIFICANT RATE DURING THE FORECAST PERIOD (2020–2027)
4.2 ASIA PACIFIC IS ESTIMATED TO LEAD THE MARKET IN 2020
4.3 MARKET, BY VEHICLE TYPE AND MODE
4.4 MARKET, BY FUEL TYPE
4.5 MARKET, BY VEHICLE TYPE
4.6 MARKET, BY MODE
4.7 MARKET, BY RAIL APPLICATION
4.8 MARKET, BY ELECTRIC VEHICLE TYPE
5 MARKET OVERVIEW (Page No. - 46)
5.1 INTRODUCTION
5.2 MARKET DYNAMICS
5.2.1 DRIVERS
5.2.1.1 Increasing demand for emission-free vehicles and energy efficient transport
5.2.1.2 Vehicle conversions and fluctuations in fuel prices
5.2.2 RESTRAINTS
5.2.2.1 High cost involved with technologies and components
5.2.3 OPPORTUNITIES
5.2.3.1 Availability of alternative fuel engine solutions for commercial vehicles
5.2.3.2 Government support for zero emission technologies
5.2.4 CHALLENGES
5.2.4.1 Infrastructure for alternative fuel vehicles
5.3 LOW-CARBON PROPULSION MARKET SCENARIOS (2020–2027)
5.3.1 MOST LIKELY SCENARIO
5.3.2 OPTIMISTIC SCENARIO
5.3.3 PESSIMISTIC SCENARIO
6 INTRODUCTION (COVID-19) (Page No. - 53)
6.1 COVID-19 HEALTH ASSESSMENT
6.2 COVID-19 ECONOMIC ASSESSMENT
6.2.1 COVID-19 ECONOMIC IMPACT—SCENARIO ASSESSMENT
7 INDUSTRY TRENDS (Page No. - 59)
7.1 INTRODUCTION
7.2 PORTER’S 5 FORCES ANALYSIS
7.3 VALUE CHAIN ANALYSIS
7.4 TECHNOLOGICAL ANALYSIS
7.4.1 BI-FUEL PROPANE VEHICLES
7.4.2 INNOVATIVE CHARGING SOLUTIONS
7.4.2.1 Off-board top-down pantograph charging system
7.4.2.2 On-board bottom-up-pantograph charging system
7.4.3 USE OF FUEL CELL FOR HEAVY LOAD TRANSPORTATION
7.4.4 HYDROGEN PRODUCTION
7.4.5 LNG TECHNOLOGY AND FUTURE MARKET POTENTIAL
7.5 KEY MARKETS FOR EXPORT/IMPORT
7.5.1 EUROPE (GERMANY AND SWEDEN)
7.5.2 JAPAN
7.5.3 CHINA
7.5.4 US
7.6 PATENT ANALYSIS
7.6.1 METHODOLOGY
7.6.2 DOCUMENT TYPE
7.6.3 PATENTS FILED
7.6.4 INSIGHT
7.7 CASE STUDY
7.7.1 AUTONOMOUS ELECTRIC CARS
7.8 REGULATORY OVERVIEW
7.8.1 CANADA
7.8.2 CHINA
7.8.3 FRANCE
7.8.4 AUSTRIA
7.8.5 GERMANY
7.8.6 SPAIN
7.9 NATURAL GAS VEHICLES
7.9.1 EUROPE
7.9.2 ITALY
7.9.3 US
7.9.4 CHINA
7.9.5 INDIA
8 MNM INSIGHTS ON ALTERNATIVE FUEL VEHICLES (Page No. - 79)
8.1 ETHANOL
8.1.1 US FUEL ETHANOL BIO-REFINERIES BY STATE
8.1.2 US ETHANOL EXPORTS & IMPORTS
8.1.3 TOP DESTINATIONS FOR US ETHANOL EXPORTS IN 2018
8.1.4 GLOBAL FUEL ETHANOL PRODUCTION BY COUNTRY
8.1.5 US RETAIL STATIONS OFFERING E15
8.1.6 OEM MODEL WISE DATA
8.1.7 NATIONAL AVERAGE RETAIL PRICES FOR E10 & E85
8.1.8 US RETAIL STATIONS OFFERING E85 AND OTHER FLEX FUELS
8.1.9 ETHANOL-FUEL MIXTURE IN THE WORLD
8.2 NATURAL GAS VEHICLES
8.2.1 NGV PASSENGER CAR MODELS FOR EUROPE
8.2.2 LIGHT COMMERCIAL VEHICLE MODELS FOR EUROPE
8.2.3 BUSES MODELS FOR EUROPE
8.2.4 TRUCKS MODELS FOR EUROPE
8.2.5 CNG & LNG STATIONS IN EUROPE
8.2.6 TOP 5 MOST NGVS (CNG+LNG) SOLD IN EUROPE
8.3 ELECTRIC & HYDROGEN VEHICLES
8.3.1 AVERAGE CO2 EMISSIONS OF NEW CARS, BY COUNTRY
8.3.2 CHARGING POINTS FOR ECVS PER COUNTRY, PLUS PERCENTAGE OF EU TOTAL
8.3.3 FUEL CELL VEHICLES (HYDROGEN)
9 LOW-CARBON PROPULSION MARKET, BY RAIL APPLICATION (Page No. - 96)
9.1 INTRODUCTION
9.2 OPERATIONAL DATA
9.2.1 ASSUMPTIONS
9.2.2 RESEARCH METHODOLOGY
9.3 PASSENGER
9.3.1 GROWING DEMAND FOR ENERGY-EFFICIENT MODES OF TRANSPORTATION TO BOOST THE MARKET
9.4 FREIGHT
9.4.1 DEMAND FOR EMISSION-FREE FREIGHT TRANSPORT HAS INCREASED GLOBALLY
9.5 KEY INDUSTRY INSIGHTS
10 LOW-CARBON PROPULSION MARKET, BY FUEL TYPE (Page No. - 102)
10.1 INTRODUCTION
10.2 OPERATIONAL DATA
10.2.1 ASSUMPTIONS
10.2.2 RESEARCH METHODOLOGY
10.3 COMPRESSED NATURAL GAS (CNG)
10.3.1 LOW COST OF CNG WILL BOOST ITS DEMAND
10.4 LIQUEFIED NATURAL GAS (LNG)
10.4.1 LONGER RANGE AND SAFER TRANSPORT PROVIDED BY LNG WILL DRIVE THE MARKET
10.5 ETHANOL
10.5.1 VARIETY OF ETHANOL AS AN ALTERNATIVE FUEL WILL BOOST THE DEMAND
10.6 HYDROGEN
10.6.1 GOVERNMENT INITIATIVES TOWARD FUEL CELL VEHICLES WILL DRIVE THE MARKET
10.7 ELECTRIC
10.7.1 AVAILABILITY OF TECHNOLOGY AND INFRASTRUCTURE FOR ELECTRIC VEHICLES WILL BOOST THE MARKET
10.8 KEY INDUSTRY INSIGHTS
11 LOW-CARBON PROPULSION MARKET, BY ELECTRIC VEHICLE (Page No. - 112)
11.1 INTRODUCTION
11.2 OPERATIONAL DATA
11.2.1 ASSUMPTIONS
11.2.2 RESEARCH METHODOLOGY
11.3 PASSENGER CAR
11.3.1 GOVERNMENT MANDATES REGARDING EMISSION CONTROL WILL DRIVE THE MARKET
11.4 ELECTRIC TWO-WHEELER
11.4.1 USAGE OF ALTERNATIVE FUELS FOR INCREASED POWER IN WILL DRIVE THE MARKET
11.4.2 ELECTRIC MOTORCYCLE
11.4.3 ELECTRIC SCOOTER/MOPED
11.5 ELECTRIC BUS
11.5.1 GOVERNMENT MANDATES AND INCREASING INVESTMENTS IN EMISSION-FREE PUBLIC TRANSPORT WILL BOOST THE MARKET
11.6 ELECTRIC OFF-HIGHWAY VEHICLE
11.6.1 HIGH EFFICIENCY AND GREATER DRIVING RANGE OF ALTERNATIVE FUELS WILL DRIVE THE MARKET
11.6.2 MINING
11.6.3 CONSTRUCTION
11.6.4 AGRICULTURE
11.7 KEY INDUSTRY INSIGHTS
12 LOW-CARBON PROPULSION MARKET, BY MODE (Page No. - 122)
12.1 INTRODUCTION
12.2 OPERATIONAL DATA
12.2.1 ASSUMPTIONS
12.2.2 RESEARCH METHODOLOGY
12.3 ROAD
12.3.1 DEMAND FOR EMISSION-FREE COMMERCIAL VEHICLES AND RISING ADOPTION OF ELECTRIC VEHICLES IN THE LOGISTICS INDUSTRY WILL FUEL THE MARKET
12.4 RAIL
12.4.1 BENEFIT OF MASS TRANSIT OVER LONG DISTANCES TO DRIVE THE MARKET
12.5 KEY INDUSTRY INSIGHTS
13 LOW-CARBON PROPULSION MARKET, BY VEHICLE TYPE (Page No. - 128)
13.1 INTRODUCTION
13.2 OPERATIONAL DATA
13.2.1 ASSUMPTIONS
13.2.2 RESEARCH METHODOLOGY
13.3 HEAVY-DUTY VEHICLE
13.3.1 GOVERNMENT FUNDED PROJECTS AND TARGETS TO REPLACE COMMERCIAL FLEET WITH ZERO EMISSION FLEET WILL DRIVE THE MARKET
13.4 LIGHT-DUTY VEHICLE
13.4.1 DEMAND FOR LAST MILE DELIVERY TO BOOST THE SEGMENT
13.5 KEY INDUSTRY INSIGHTS
14 LOW-CARBON PROPULSION MARKET, BY REGION (Page No. - 136)
14.1 INTRODUCTION
14.2 EUROPE
14.2.1 GERMANY
14.2.1.1 Government emission norms will fuel the German market
14.2.2 ITALY
14.2.2.1 Growing alternative fuel vehicle infrastructure will drive the Italian market
14.2.3 UK
14.2.3.1 Increasing promotion for electric and hydrogen fuel vehicles will drive the UK market
14.2.4 SPAIN
14.2.4.1 Increasing adoption of electric fleet with fuel the Spanish market
14.2.5 FRANCE
14.2.5.1 Bio-fuel adoption for commercial vehicles with boost the French market
14.2.6 RUSSIA
14.2.6.1 Presence of renowned OEMs with fuel the Russia market
14.2.7 TURKEY
14.2.7.1 Skilled workforce and automotive production will fuel the Turkish market
14.3 NORTH AMERICA
14.3.1 US
14.3.1.1 Increasing efforts from government for adoption of alternative fuel vehicles will drive the US market
14.3.2 CANADA
14.3.2.1 Fuel cell and electric vehicle technologies adopted by the industry will boost the Canadian market
14.3.3 MEXICO
14.3.3.1 ZEV standards adopted by the country will drive the Mexican market
14.4 ASIA PACIFIC
14.4.1 CHINA
14.4.1.1 Increasing sales of electric commercial vehicles will fuel the Chinese market
14.4.2 JAPAN
14.4.2.1 Increasing demand for road and rail vehicles driven by alternative fuels will drive the Japanese market
14.4.3 INDIA
14.4.3.1 Focus on reduced vehicle emissions will drive the Indian market
14.4.4 SOUTH KOREA
14.4.4.1 Presence of key players will fuel the South Korean market
14.4.5 THAILAND
14.4.5.1 Renewable energy agenda to meet emission targets will drive the Thai market
14.4.6 INDONESIA
14.4.6.1 Shift from ICE vehicles to EVs will fuel the Indonesian market
14.5 REST OF THE WORLD (ROW)
14.5.1 BRAZIL
14.5.1.1 Low cost of labor and demand for heavy-duty trucks will drive the Brazilian market
14.5.2 SOUTH AFRICA
14.5.2.1 Concerns over CO2 emissions from vehicles will boost the South African market
14.5.3 IRAN
14.5.3.1 Partnerships between global and domestic OEMs with drive the Iranian market
14.5.4 ARGENTINA
14.5.4.1 New NGV regulations will drive the Argentinian market
15 COMPETITIVE LANDSCAPE (Page No. - 166)
15.1 OVERVIEW
15.2 MARKET RANKING ANALYSIS
15.3 COMPETITIVE LEADERSHIP MAPPING
15.3.1 VISIONARY LEADERS
15.3.2 INNOVATORS
15.3.3 DYNAMIC DIFFERENTIATORS
15.3.4 EMERGING COMPANIES
15.4 STRENGTH OF PRODUCT PORTFOLIO
15.5 BUSINESS STRATEGY EXCELLENCE
15.6 WINNERS VS. TAIL-ENDERS
15.7 COMPETITIVE SCENARIO
15.7.1 NEW PRODUCT DEVELOPMENTS
15.7.2 JOINT VENTURE/PARTNERSHIPS/COLLABORATIONS
15.7.3 AGREEMENTS
15.7.4 EXPANSIONS, 2018–2019
16 COMPANY PROFILES (Page No. - 177)
(Business overview, Products offered, Recent Developments, SWOT analysis, MNM view)*
16.1 TESLA, INC.
16.2 BYD
16.3 YUTONG
16.4 PROTERRA
16.5 NISSAN
16.6 BOMBARDIER
16.7 SIEMENS
16.8 ALSTOM
16.9 TOYOTA
16.10 HONDA
16.11 HYUNDAI
16.12 MAN SE
*Details on Business overview, Products offered, Recent Developments, SWOT analysis, MNM view might not be captured in case of unlisted companies.
16.13 OTHER MAJOR PLAYERS
16.13.1 NORTH AMERICA
16.13.1.1 General Electric (GE)
16.13.1.2 NFI Group
16.13.1.3 Cummins Inc.
16.13.1.4 Nikola Motor Company
16.13.1.5 Zenith Motors
16.13.2 EUROPE
16.13.2.1 Volkswagen
16.13.2.2 AB Volvo
16.13.2.3 VDL Groep
16.13.2.4 Daimler AG
16.13.2.5 CAF
16.13.2.6 Scania
16.13.3 ASIA PACIFIC
16.13.3.1 Hyundai Rotem
16.13.3.2 Toshiba
16.13.3.3 King Long
16.13.3.4 Ankai
16.13.3.5 Tata Motors
17 RECOMMENDATIONS BY MARKETSANDMARKETS (Page No. - 217)
17.1 ASIA PACIFIC WILL BE THE LEADING LOW-CARBON PROPULSION MARKET
17.2 ELECTRIC VEHICLES HOLD THE KEY FOR LOW-CARBON PROPULSION MARKET IN COMING YEARS
17.3 CONCLUSION
18 APPENDIX (Page No. - 219)
18.1 KEY INSIGHTS OF INDUSTRY EXPERTS
18.2 DISCUSSION GUIDE
18.3 KNOWLEDGE STORE: MARKETSANDMARKETS SUBSCRIPTION PORTAL
18.4 AVAILABLE CUSTOMIZATIONS
18.5 RELATED REPORTS
18.6 AUTHOR DETAILS
LIST OF TABLES (123 TABLES)
TABLE 1 INCLUSIONS & EXCLUSIONS FOR LOW-CARBON PROPULSION MARKET
TABLE 2 NATIONAL AVERAGE RETAIL FUEL PRICES OF CONVENTIONAL AND ALTERNATIVE FUELS, JANUARY 2020
TABLE 3 DIESEL VS. CNG VS. LNG
TABLE 4 GOVERNMENT PROGRAMS FOR PROMOTION OF ELECTRIC COMMERCIAL VEHICLE SALES
TABLE 5 MARKET (MOST LIKELY), BY REGION, 2020–2027 (THOUSAND UNITS)
TABLE 6 LOW-CARBON PROPULSION MARKET (OPTIMISTIC), BY REGION, 2020–2027 (THOUSAND UNITS)
TABLE 7 LOW-CARBON PROPULSION (PESSIMISTIC), BY REGION, 2020–2027 (THOUSAND UNITS)
TABLE 8 SUMMARY OF FCEV ATTRIBUTES COMPARED TO THOSE OF ADVANCED BEV FOR 200-MILE AND 300-MILE RANGE
TABLE 9 TOTAL IMPORT/EXPORT OF VEHICLES IN EUROPE, UNITS
TABLE 10 TOTAL IMPORT/EXPORT OF VEHICLES IN JAPAN, UNITS
TABLE 11 TOTAL IMPORT/EXPORT OF VEHICLES IN CHINA, UNITS
TABLE 12 TOTAL IMPORT/EXPORT OF VEHICLES IN US, UNITS
TABLE 13 EXISTING SUBSIDIES AND TAX STRUCTURE, CANADA, 2018
TABLE 14 EXISTING CHARGING STATION STANDARDS IN CHINA
TABLE 15 EXISTING SUBSIDIES AND TAX STRUCTURE, CHINA, 2018
TABLE 16 EXISTING SUBSIDIES AND TAX STRUCTURE, FRANCE, 2018
TABLE 17 EXISTING SUBSIDIES AND TAX STRUCTURE, AUSTRIA, 2018
TABLE 18 EXISTING SUBSIDIES AND TAX STRUCTURE, GERMANY, 2018
TABLE 19 EXISTING SUBSIDIES AND TAX STRUCTURE, SPAIN, 2018
TABLE 20 WORLDWIDE NGV COUNTRIES, 2018
TABLE 21 AVERAGE CONSUMPTION IN GALLONS OF GASOLINE EQUIVALENT (GGE)
TABLE 22 EXAMPLES OF DEPLOYMENT OF HYDROGEN BUS PROJECTS
TABLE 23 CLEAN ENERGY FUELS - RETAIL SALES DATA, 2015–2018
TABLE 24 ANNUAL WORLD FUEL ETHANOL PRODUCTION (MIL. GAL.)
TABLE 25 ANNUAL U.S. FUEL ETHANOL PRODUCTION
TABLE 26 TOP 5 MOST ECVS SOLD IN EUROPE
TABLE 27 TOP 5 MOST FCEVS SOLD IN EUROPE
TABLE 28 LOW-CARBON PROPULSION MARKET, BY RAIL APPLICATION, 2018–2027 (UNITS)
TABLE 29 WORLDWIDE CNG, LNG, AND BIOMETHANE STATIONS ,2018
TABLE 30 PASSENGER: MARKET, BY REGION, 2018–2027 (UNITS)
TABLE 31 RAIL TRANSPORT ACTIVITY BY FUEL TYPE, 1995–2016
TABLE 32 FREIGHT: MARKET, BY REGION, 2020–2027 (UNITS)
TABLE 33 WORLDWIDE CNG, LNG AND BIOMETHANE STATIONS , 2018
TABLE 34 MARKET, BY FUEL TYPE, 2018–2027 (THOUSAND UNITS)
TABLE 35 CNG+LNG REFUELING STATIONS IN EUROPE, 2018
TABLE 36 COMPRESSED NATURAL GAS (CNG): LOW-CARBON PROPULSION MARKET, BY REGION, 2018–2027 (THOUSAND UNITS)
TABLE 37 LIQUEFIED NATURAL GAS (LNG): MARKET, BY REGION, 2018–2027 (THOUSAND UNITS)
TABLE 38 ETHANOL: MARKET, BY REGION, 2018–2027 (THOUSAND UNITS)
TABLE 39 HYDROGEN: MARKET, BY REGION, 2018–2027 (THOUSAND UNITS)
TABLE 40 ELECTRIC: MARKET, BY REGION, 2018–2027 (THOUSAND UNITS)
TABLE 41 ELECTRIC CAR DEPLOYMENT IN SELECTED COUNTRIES, 2013–2018 (MILLION UNITS)
TABLE 42 ELECTRIC COMMERCIAL VEHICLE DATA BASED ON POWER OUTPUT
TABLE 43 TOP 5 COUNTRIES USING ALTERNATIVE FUEL CARS IN 2019
TABLE 44 PASSENGER CAR: MARKET, 2018–2027 (THOUSAND UNITS)
TABLE 45 ELECTRIC TWO-WHEELER: MARKET, 2018–2027 (THOUSAND UNITS)
TABLE 46 ELECTRIC BUSES: MARKET, 2018–2027 (THOUSAND UNITS)
TABLE 47 ELECTRIC OFF-HIGHWAY: MARKET, 2018–2027 (THOUSAND UNITS)
TABLE 48 LOW-CARBON PROPULSION MARKET, BY MODE, 2018–2027 (THOUSAND UNITS)
TABLE 49 SCENARIO FOR ENERGY DEMAND IN FUTURE FROM RAIL MODE
TABLE 50 ROAD: MARKET, BY REGION, 2018–2027 (THOUSAND UNITS)
TABLE 51 RAIL: MARKET, BY REGION, 2018–2027 (THOUSAND UNITS)
TABLE 52 MARKET, BY VEHICLE TYPE, 2018–2027 (THOUSAND UNITS)
TABLE 53 US TIER III EVAPORATIVE EMISSIONS TESTS AND LIMITS FOR GASOLINE LIGHT-DUTY VEHICLES
TABLE 54 EXAMPLES OF DEPLOYMENT BUS PROJECTS
TABLE 55 HEAVY-DUTY VEHICLE: MARKET, BY REGION, 2018–2027 (THOUSAND UNITS)
TABLE 56 LIGHT-DUTY VEHICLE: MARKET, BY REGION, 2018–2027 (THOUSAND UNITS)
TABLE 57 LOW-CARBON PROPULSION MARKET, BY REGION, 2018–2027 (THOUSAND UNITS)
TABLE 58 PRODUCTION IMPACT OF THE CORONAVIRUS / COVID-19 CRISIS ON THE EUROPEAN AUTO INDUSTRY, 2020
TABLE 59 EUROPE: MARKET, BY COUNTRY, 2018–2027 (THOUSAND UNITS)
TABLE 60 GERMANY: AUTOMOTIVE FUEL CELL MARKET - ONGOING PROJECTS
TABLE 61 GERMANY: MARKET, BY VEHICLE TYPE, 2018–2027 (THOUSAND UNITS)
TABLE 62 ITALY: MARKET, BY VEHICLE TYPE, 2018–2027 (THOUSAND UNITS)
TABLE 63 UK: MARKET, BY VEHICLE TYPE, 2018–2027 (THOUSAND UNITS)
TABLE 64 SPAIN: MARKET, BY VEHICLE TYPE, 2018–2027 (THOUSAND UNITS)
TABLE 65 FRANCE: MARKET, BY VEHICLE TYPE, 2018–2027 (THOUSAND UNITS)
TABLE 66 RUSSIA: MARKET, BY VEHICLE TYPE, 2018–2027 (THOUSAND UNITS)
TABLE 67 TURKEY: MARKET, BY VEHICLE TYPE, 2018–2027 (THOUSAND UNITS)
TABLE 68 NORTH AMERICA: MARKET, BY COUNTRY, 2018–2027 (THOUSAND UNITS)
TABLE 69 US: LOW-CARBON PROPULSION MARKET, BY VEHICLE TYPE, 2018–2027 (THOUSAND UNITS)
TABLE 70 CANADA: MARKET, BY VEHICLE TYPE, 2018–2027 (THOUSAND UNITS)
TABLE 71 MEXICO: MARKET, BY VEHICLE TYPE, 2018–2027 (THOUSAND UNITS)
TABLE 72 ASIA PACIFIC: MARKET, BY COUNTRY, 2018–2027 (THOUSAND UNITS)
TABLE 73 CHINA: MARKET, BY VEHICLE TYPE, 2018–2027 (THOUSAND UNITS)
TABLE 74 JAPAN: MARKET, BY VEHICLE TYPE, 2018–2027 (THOUSAND UNITS)
TABLE 75 INDIA: MARKET, BY VEHICLE TYPE, 2018–2027 (THOUSAND UNITS)
TABLE 76 SOUTH KOREA: MARKET, BY VEHICLE TYPE, 2018–2027 (THOUSAND UNITS)
TABLE 77 THAILAND: MARKET, BY VEHICLE TYPE, 2018–2027 (THOUSAND UNITS)
TABLE 78 INDONESIA: MARKET, BY VEHICLE TYPE, 2018–2027 (THOUSAND UNITS)
TABLE 79 ROW: LOW-CARBON PROPULSION MARKET, BY COUNTRY, 2018–2027 (THOUSAND UNITS)
TABLE 80 BRAZIL: MARKET, BY VEHICLE TYPE, 2018–2027 (THOUSAND UNITS)
TABLE 81 SOUTH AFRICA: MARKET, BY VEHICLE TYPE, 2018–2027 (THOUSAND UNITS)
TABLE 82 IRAN: MARKET, BY VEHICLE TYPE, 2018–2027 (THOUSAND UNITS)
TABLE 83 ARGENTINA: MARKET, BY VEHICLE TYPE, 2018–2027 (THOUSAND UNITS)
TABLE 84 NEW PRODUCT DEVELOPMENTS, 2018–2019
TABLE 85 SUPPLY CONTRACTS, 2017–2019
TABLE 86 JOINT VENTURES/PARTNERSHIPS/COLLABORATIONS, 2018–2019
TABLE 87 AGREEMENTS, 2018–2019
TABLE 88 EXPANSIONS, 2018–2019
TABLE 89 TESLA, INC.: NEW PRODUCT DEVELOPMENT/EXPANSIONS
TABLE 90 TESLA, INC.: AUTOMOTIVE REVENUE SHARE OVER THE YEARS
TABLE 91 BYD: PRODUCT OFFERINGS
TABLE 92 BYD:NEW PRODUCT DEVELOPMENT/EXPANSIONS
TABLE 93 BYD: JOINT VENTURES/PARTNERSHIPS/COLLABORATIONS/AGREEMENTS/SUPPLY CONTRACT/ACQUISITION/MERGER/DEMONSTRATION
TABLE 94 BYD: AUTOMOTIVE REVENUE SHARE OVER THE YEARS
TABLE 95 YUTONG: PRODUCT OFFERINGS
TABLE 96 YUTONG: NEW PRODUCT DEVELOPMENT/EXPANSIONS
TABLE 97 YUTONG: JOINT VENTURES/PARTNERSHIPS/COLLABORATIONS/AGREEMENTS/SUPPLY CONTRACT/ACQUISITION/MERGER/DEMONSTRATION
TABLE 98 PROTERRA: PRODUCT OFFERINGS
TABLE 99 PROTERRA: NEW PRODUCT DEVELOPMENT/EXPANSIONS
TABLE 100 PROTERRA: JOINT VENTURES/PARTNERSHIPS/COLLABORATIONS/AGREEMENTS/SUPPLY CONTRACT/ACQUISITION/MERGER/DEMONSTRATION
TABLE 101 NISSAN MOTOR: PRODUCT OFFERINGS
TABLE 102 NISSAN: NEW PRODUCT DEVELOPMENT/EXPANSIONS
TABLE 103 NISSAN: JOINT VENTURES/PARTNERSHIPS/COLLABORATIONS/AGREEMENTS/SUPPLY CONTRACT/ACQUISITION/MERGER/DEMONSTRATION
TABLE 104 BOMBARDIER: PRODUCT OFFERINGS
TABLE 105 BOMBARDIER: NEW PRODUCT DEVELOPMENT/EXPANSIONS
TABLE 106 BOMBARDIER: JOINT VENTURES/PARTNERSHIPS/COLLABORATIONS/AGREEMENTS/SUPPLY CONTRACT/ACQUISITION/MERGER/DEMONSTRATION
TABLE 107 SIEMENS: PRODUCT OFFERINGS
TABLE 108 SIEMENS: NEW PRODUCT DEVELOPMENT/EXPANSIONS
TABLE 109 SIEMENS: JOINT VENTURES/PARTNERSHIPS/COLLABORATIONS/AGREEMENTS/SUPPLY CONTRACT/ACQUISITION/MERGER/DEMONSTRATION
TABLE 110 SIEMENS: MOBILITY REVENUE SHARE OVER THE YEARS
TABLE 111 ALSTOM: PRODUCT OFFERINGS
TABLE 112 ALSTOM: NEW PRODUCT DEVELOPMENT/EXPANSIONS
TABLE 113 ALSTOM: JOINT VENTURES/PARTNERSHIPS/COLLABORATIONS/AGREEMENTS/SUPPLY CONTRACT/ACQUISITION/MERGER/DEMONSTRATION
TABLE 114 TOYOTA: PRODUCT OFFERINGS
TABLE 115 TOYOTA: NEW PRODUCT DEVELOPMENT/EXPANSIONS
TABLE 116 TOYOTA: JOINT VENTURES/PARTNERSHIPS/COLLABORATIONS/AGREEMENTS/SUPPLY CONTRACT/ACQUISITION/MERGER/DEMONSTRATION
TABLE 117 TOYOTA: AUTOMOTIVE REVENUE SHARE OVER THE YEARS
TABLE 118 HONDA: PRODUCT OFFERINGS
TABLE 119 HONDA: NEW PRODUCT DEVELOPMENT/EXPANSIONS
TABLE 120 HYUNDAI: PRODUCT OFFERINGS
TABLE 121 HYUNDAI: NEW PRODUCT DEVELOPMENT/EXPANSIONS
TABLE 122 HYUNDAI: JOINT VENTURES/PARTNERSHIPS/COLLABORATIONS/AGREEMENTS/SUPPLY CONTRACT/ACQUISITION/MERGER/DEMONSTRATION
TABLE 123 MAN SE: PRODUCT OFFERINGS
LIST OF FIGURES (71 FIGURES)
FIGURE 1 LOW-CARBON PROPULSION: MARKET SEGMENTATION
FIGURE 2 LOW-CARBON PROPULSION MARKET: RESEARCH DESIGN
FIGURE 3 RESEARCH METHODOLOGY MODEL
FIGURE 4 BREAKDOWN OF PRIMARY INTERVIEWS
FIGURE 5 MARKET SIZE ESTIMATION METHODOLOGY FOR MARKET: BOTTOM-UP APPROACH
FIGURE 6 MARKET SIZE ESTIMATION METHODOLOGY FOR MARKET: TOP-DOWN APPROACH
FIGURE 7 DATA TRIANGULATION
FIGURE 8 REVENUE SHIFT IN THE MARKET
FIGURE 9 COVID-19 IMPACT ON MARKET
FIGURE 10 LOW-CARBON PROPULSION: MARKET DYNAMICS
FIGURE 11 LOW-CARBON PROPULSION MARKET, BY REGION, 2020–2027
FIGURE 12 LOW-CARBON PROPULSION, BY FUEL TYPE, 2020 VS 2027
FIGURE 13 INCREASING DEMAND FOR FUEL EFFICIENT VEHICLES IS LIKELY TO BOOST MARKET GROWTH
FIGURE 14 MARKET SHARE, BY REGION, 2020
FIGURE 15 LIGHT-DUTY AND ROAD MODE ACCOUNT FOR THE LARGEST SHARES OF THE MARKET IN 2020
FIGURE 16 ELECTRIC TYPE IS EXPECTED TO HOLD THE LARGEST MARKET SHARE, 2020 VS. 2027 (THOUSAND UNITS)
FIGURE 17 LIGHT-DUTY IS EXPECTED TO HOLD THE LARGEST MARKET SHARE, 2020 VS. 2027 (THOUSAND UNITS)
FIGURE 18 ROAD IS ESTIMATED TO HOLD THE LARGEST MARKET SHARE, 2020 VS. 2027 (THOUSAND UNITS)
FIGURE 19 PASSENGER IS ESTIMATED TO HOLD THE LARGEST MARKET SHARE, 2020 VS. 2027 (UNITS)
FIGURE 20 PASSENGER IS ESTIMATED TO HOLD THE LARGEST MARKET SHARE, 2020 VS. 2027 (THOUSAND UNITS)
FIGURE 21 GLOBAL FUEL ECONOMY AND CO2 EMISSION DATA (2016–2025)
FIGURE 22 COVID-19: THE GLOBAL PROPAGATION
FIGURE 23 COVID-19 PROPAGATION: SELECT COUNTRIES
FIGURE 24 COUNTRIES BEGIN WITH A SIMILAR TRAJECTORY BUT THE CURVE DEVIATES BASED ON MEASURES TAKEN
FIGURE 25 REVISED GDP FORECASTS FOR SELECT G20 COUNTRIES IN 2020
FIGURE 26 CRITERIA IMPACTING THE GLOBAL ECONOMY
FIGURE 27 SCENARIOS IN TERMS OF RECOVERY OF THE GLOBAL ECONOMY
FIGURE 28 VALUE CHAIN ANALYSIS OF LOW-CARBON PROPULSION MARKET
FIGURE 29 TIMELINE OF FUEL CELL MASS MARKET ACCEPTABILITY IN TRANSPORTATION SECTOR, 2016–2050
FIGURE 30 LNG SATURATED FUEL TANK
FIGURE 31 PATENT APPLICATION TRENDS – LAST 5 YEARS
FIGURE 32 COUNTRY-WISE PATENT ANALYSIS
FIGURE 33 TOP PATENT APPLICANTS, 2010-2019
FIGURE 34 ALTERNATIVELY-POWERED VEHICLES: SHARE OF THE EU CAR FLEET
FIGURE 35 CO2 EMISSIONS OF NEW CARS
FIGURE 36 NATIONAL INCOME AND ELECTRICALLY-CHARGEABLE CARS
FIGURE 37 LOW-CARBON PROPULSION MARKET, BY RAIL APPLICATION, 2020 VS. 2027
FIGURE 38 FINAL ENERGY DEMAND IN RAIL TRANSPORT BY REGION AND TYPE, 2000-17
FIGURE 39 MARKET, BY FUEL TYPE, 2020 VS. 2027, THOUSAND UNITS
FIGURE 40 US IMPORT AND EXPORT LNG DATA
FIGURE 41 ETHANOL FUELING STATIONS IN US
FIGURE 42 MARKET, BY ELECTRIC VEHICLE, 2020 VS. 2027, THOUSAND UNITS
FIGURE 43 MARKET, BY MODE, 2020 VS. 2027, THOUSAND UNITS
FIGURE 44 MARKET, BY VEHICLE TYPE, 2020 VS. 2027, THOUSAND UNITS
FIGURE 45 ALTERNATIVE FUEL VEHICLES IN EUROPE
FIGURE 46 MARKET, BY REGION, 2020 VS. 2027
FIGURE 47 EUROPE: LOW-CARBON PROPULSION MARKET SNAPSHOT
FIGURE 48 FORECAST OF GREEN VEHICLE MARKET DEVELOPMENT IN RUSSIA BY 2030
FIGURE 49 NORTH AMERICA: MARKET SNAPSHOT
FIGURE 50 ASIA PACIFIC: MARKET SNAPSHOT
FIGURE 51 ROW: MARKET SNAPSHOT
FIGURE 52 LOW-CARBON PROPULSION (GLOBAL): COMPETITIVE LEADERSHIP MAPPING, 2020
FIGURE 53 PRODUCT PORTFOLIO ANALYSIS OF TOP PLAYERS IN MARKET
FIGURE 54 BUSINESS STRATEGY EXCELLENCE OF TOP PLAYERS IN LOW-CARBON PROPULSION MARKET
FIGURE 55 KEY DEVELOPMENTS BY LEADING PLAYERS IN THE MARKET, 2017–2020
FIGURE 56 TESLA, INC.: COMPANY SNAPSHOT
FIGURE 57 TESLA, INC.: SWOT ANALYSIS
FIGURE 58 BYD: COMPANY SNAPSHOT
FIGURE 59 BYD: SWOT ANALYSIS
FIGURE 60 YUTONG: COMPANY SNAPSHOT
FIGURE 61 YUTONG: SWOT ANALYSIS
FIGURE 62 PROTERRA: SWOT ANALYSIS
FIGURE 63 NISSAN: COMPANY SNAPSHOT
FIGURE 64 NISSAN: SWOT ANALYSIS
FIGURE 65 BOMBARDIER: COMPANY SNAPSHOT
FIGURE 66 SIEMENS: COMPANY SNAPSHOT
FIGURE 67 ALSTOM: COMPANY SNAPSHOT
FIGURE 68 TOYOTA: COMPANY SNAPSHOT
FIGURE 69 HONDA: COMPANY SNAPSHOT
FIGURE 70 HYUNDAI: COMPANY SNAPSHOT
FIGURE 71 MAN SE: COMPANY SNAPSHOT
The study involves four main activities to estimate the current size of the global low-carbon propulsion market. Exhaustive secondary research was done to collect information on the market. The next step was to validate these findings, assumptions, and market analysis with industry experts across value chains through primary research. Both top-down and bottom-up approaches were employed to estimate the total market size of different segments considered in this study. After that, market breakdown and data triangulation were used to estimate the market size of the segments and subsegments.
Secondary Research
The secondary sources referred to for this research study include automotive industry organizations such as the Organisation Internationale des Constructeurs d'Automobiles (OICA), Alternative Fuels Data Center (AFDC), corporate filings (such as annual reports, investor presentations, and financial statements); and trade, business, and automotive associations. Secondary data has been collected and analyzed to arrive at the overall market size, which is further validated by primary research.
Primary Research
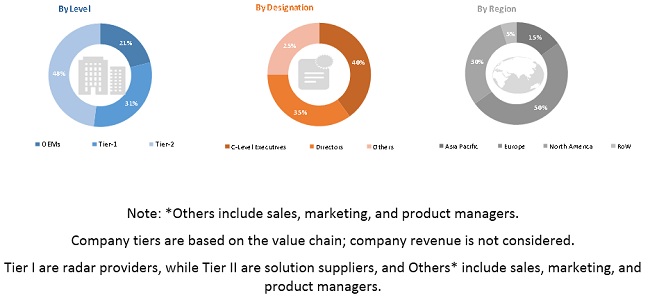
Extensive primary research has been conducted after acquiring an understanding of the low-carbon propulsion market scenario through secondary research. Several primary interviews have been conducted with market experts from both the demand-side (vehicle manufacturers, country-level government associations, and trade associations) and supply-side (OEMs and component manufacturers) across four major regions, namely, North America, Europe, Asia Pacific, and Rest of the World. Approximately 23% and 77% of primary interviews have been conducted from the demand and supply side, respectively. Primary data has been collected through questionnaires, emails, and telephonic interviews. In the canvassing of primaries, we have strived to cover various departments within organizations, such as sales, operations, and administration, to provide a holistic viewpoint in our report.
After interacting with industry experts, we have also conducted brief sessions with highly experienced independent consultants to reinforce the findings from our primaries. This, along with the in-house subject-matter experts’ opinions, has led us to the outcomes as described in the remainder of this report.
To know about the assumptions considered for the study, download the pdf brochure
Market Size Estimation
The bottom-up approach has been used to estimate and validate the size of the low-carbon propulsion market. In this approach, vehicle sales statistics for each vehicle type (light- and heavy-duty) have been considered at the country level.
To determine the market size, in terms of volume, a model mapping of the low carbon propulsion vehicles has been carried out for each country and vehicle type (light- and heavy-duty). The number of vehicle models varied from country to country. After analyzing the models, the segments have further been classified into fuel type, vehicle type, mode type, and region. Then the type of vehicle sold is identified, which gives us the volume of each segment type. The country-level data is summed up to arrive at the region-level data in terms of volume. The summation of the country-level market size gives the regional market size, and further summation of the regional market size provides the global low-carbon propulsion market size.
The top-down approach has been used to estimate and validate the size of the low-carbon propulsion market by application in terms of volume. In this approach, key applications of rail are identified at the country level. The penetration of each identified application (freight and passenger) is multiplied with the volume of rail vehicles at the regional level to derive the total volume. All regional-level data are summed up to obtain the global market by application type.
Data Triangulation
All percentage shares, splits, and breakdowns have been determined using secondary sources and verified by primary sources. All parameters that are said to affect the markets covered in this research study have been accounted for, viewed in extensive detail, and analyzed to obtain the final quantitative and qualitative data. This data has been consolidated, enhanced with detailed inputs and analysis from MarketsandMarkets, and presented in the report. The following figure is an illustrative representation of the overall market size estimation process employed for this study.
Report Objectives
- To segment and forecast the low-carbon propulsion market size, in terms of volume (thousand units)
- To define, describe, and forecast the market based on fuel type, mode, vehicle type, electric vehicle, rail application, and region.
- To segment and forecast the market size based on fuel type (CNG, LNG, ethanol, hydrogen, and electric)
- To segment and forecast the market size based on mode (rail and road)
- To segment and forecast the market size based on vehicle type (heavy duty and light duty)
- To segment and forecast the market size based on electric vehicle (electric passenger cars, electric two-wheeler, electric bus, and electric off-highway)
- To segment and forecast the market size based on rail application (passenger and freight)
- To forecast the market size with respect to key regions, namely, North America, Europe, Asia Pacific, and the Rest of the World
- To provide detailed information regarding the major factors influencing the low-carbon propulsion market growth (drivers, challenges, restraints, and opportunities)
- To strategically analyze markets with respect to individual growth trends, future prospects, and contribution to the total market
Available Customizations
With the given market data, MarketsandMarkets offers customizations in line with the company’s specific needs.
- Low-Carbon Propulsion Market, By Fuel type at country level (For countries covered in the report)
- Low-Carbon Propulsion Market, By Rail Application at country level (For countries covered in the report)
Company Information
- Profiling of Additional Market Players (Up to 5)


Growth opportunities and latent adjacency in Low-Carbon Propulsion Market