Low-Code Development Platform Market by Component (Platform and Services), Application Type, Deployment Type (Cloud and On-Premises), Organization Size (SMEs and Large Enterprises), Industry, and Region - Global Forecast to 2025


Low-Code Development Platform Market - Industry Trends & Forecast
The global Low-Code Development Platform Market is estimated to be worth USD 13.2 billion in 2020. It is projected to reach USD 45.5 billion by 2025 at a CAGR of 28.1% during the forecast period. The increasing need of digitalization and maturity of agile DevOps practices are expected to enhance the use of market across the globe.
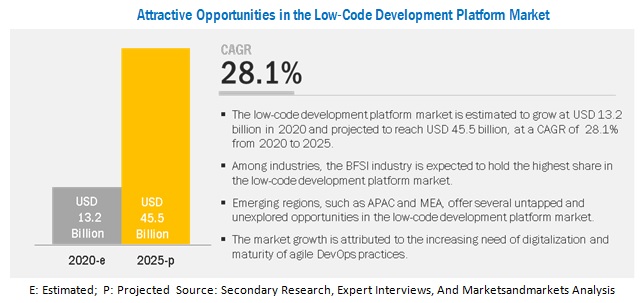
By industry, the BFSI industry to grow at the highest CAGR during the forecast period
The BFSI industry requires market services and platform on a large-scale due to the voluminous information produced across these organizations. Organizations have implemented low-code development platform and services to improve the automation in the customer service business functions, as customer service is the core factor responsible for customer acquisition and retention in the BFSI industry. This low-code development platform market frequently keeps introducing new and improved financial products and services to enhance its business operations, which makes it attractive for the low-code development platform providers to offer advanced solutions to the industry.
By application type, the web-based segment to grow at the highest CAGR during the forecast period
Web application is considered as a face of an organization and by using the low-code development platform organizations can roll out user-defined web-based applications quickly. Instead of writing the programming language for the development of web-based applications, employees with less development experience can also create sophisticated applications. For those who has relevant experience, this platform can ease out the daily work chores and can even help them create more custom web-based applications by integrating already existing digital ecosystems.
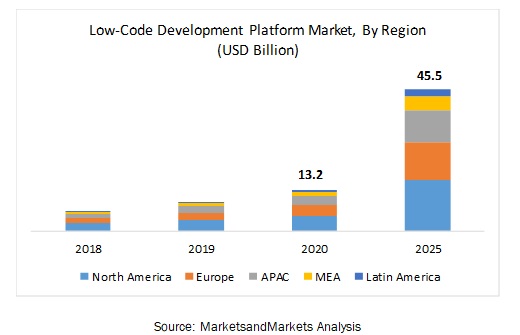
By region, North America to account for the highest market share during the forecast period
North America has the presence of several prominent market players delivering low-code development platform and services to all end users in the region. The US and Canada both have strong economic conditions and are expected to be major contributors to the growth of the low-code development platform market. The geographical presence, significant Research and Development (R&D) activities, partnerships, and acquisitions and mergers are the major factors for the deployment of low-code development platform and services. The major vendors, such as Salesforce, Microsoft, Appian, and Pegasystems, offer enhanced low-code development platform and services to cater to the needs of customers which fuels the growth of the global market in North America.
Low-Code Development Platform Market Key Players:
The vendors covered in the market report include Salesforce (US), Microsoft (US), Appian (US), Oracle (US), Pegasystems (US), Magic Software Enterprises (US), AgilePoint (US), OutSystems (US), Zoho (India), Quick Base (US), LANSA (US), Fujitsu RunMyProcess (France), Netcall (UK), WaveMaker (US), and K2 (US).
Scope of the Report
|
Report Metric |
Details |
|
Market size value in 2020 |
USD 13.2 billion |
|
Revenue forecast in 2025 |
USD 45.5 billion |
|
Growth Rate |
28.1% CAGR |
|
Historical data |
2018–2025 |
|
Base year for estimation |
2019 |
|
Forecast period |
2020–2025 |
|
Market Segmentation |
Component, Application Type, Deployment Type, Organization Size, Industry, and Region |
|
Market Drivers |
|
|
Market Opportunities |
|
|
Geographies covered |
North America, Europe, APAC, MEA, and Latin America |
|
Companies covered |
Salesforce (US), Microsoft (US), Appian (US), Oracle (US), Pegasystems (US), Magic Software Enterprises (US), AgilePoint (US), OutSystems (US), Zoho (India), Quick Base (US), LANSA (US), Fujitsu RunMyProcess (France), Netcall (UK), WaveMaker (US), and K2 (US). |
This research report categorizes the low-code development platform market to forecast revenues and analyze trends in each of the following submarkets:
Based on component:
- Platform
- Services
Based on application type:
- Web-based
- Mobile-based
- Desktop and Server-based
Based on organization size:
- Small and Medium-Sized Enterprises (SMEs)
- Large Enterprises
Based on Industry:
- BFSI
- Retail and eCommerce
- Government and Defense
- Healthcare
- IT
- Energy and Utilities
- Manufacturing
- Others (education, transportation and logistics, and media and entertainment)
Based on the region:
-
North America
- United States (US)
- Canada
-
Europe
- United Kingdom (UK)
- Germany
- France
- Rest of Europe (Spain, the Netherlands, and Denmark)
-
APAC
- China
- Japan
- Australia and New Zealand
- Rest of APAC (India, Indonesia, and Singapore)
-
MEA
- KSA
- UAE
- Africa
-
Latin America
- Brazil
- Mexico
- Rest of Latin America (Argentina and Chile)
Recent Developments
- In March 2020, Deloitte and Appian announced a strategic alliance to help modernize mission systems for its clients within commercial, federal civilian, defense, and state and local government agencies.
- In March 2020, Appian launched the latest version of the Appian Low-code Automation Platform. The new version delivers material business impact with unified, flexible, and fast enterprise automation.
- In February 2020, Salesforce acquired Evergage, a cloud-based personalization and customer data platform.
- In February 2020, Microsoft PowerApps announced the public preview for two core canvas apps, which are canvas components and PowerApps component framework.
- In January 2020, Appian partnered with Celonis to accelerate digital business process transformation.
Frequently Asked Questions (FAQ):
How big is the Low-Code Development Platform Market?
What is the Low-Code Development Platform Market growth?
What does Low Code Development Platform mean?
What are the driving factors for Low Code Development Platform market?
Who are the prominent players in the Low Code Development Platform market?
Which are the major Low Code Development Platform verticals?
To speak to our analyst for a discussion on the above findings, click Speak to Analyst
 Exclusive indicates content/data unique to MarketsandMarkets and not available with any competitors.
TABLE OF CONTENT
1 INTRODUCTION (Page No. - 19)
1.1 OBJECTIVES OF THE STUDY
1.2 MARKET DEFINITION
1.2.1 INCLUSIONS AND EXCLUSIONS
1.3 MARKET SCOPE
1.3.1 MARKET SEGMENTATION
1.3.2 REGIONS COVERED
1.3.3 YEARS CONSIDERED FOR THE STUDY
1.4 CURRENCY CONSIDERED
1.5 STAKEHOLDERS
2 RESEARCH METHODOLOGY (Page No. - 22)
2.1 RESEARCH DATA
2.1.1 SECONDARY DATA
2.1.2 PRIMARY DATA
2.1.2.1 Breakup of primary profiles
2.1.2.2 Key industry insights
2.2 MARKET BREAKUP AND DATA TRIANGULATION
2.3 MARKET SIZE ESTIMATION
2.4 MARKET FORECAST
2.5 RESEARCH ASSUMPTIONS
2.6 LIMITATIONS OF THE STUDY
3 EXECUTIVE SUMMARY (Page No. - 30)
4 PREMIUM INSIGHTS (Page No. - 33)
4.1 ATTRACTIVE MARKET OPPORTUNITIES IN THE MARKET
4.2 LOW-CODE DEVELOPMENT PLATFORM MARKET, BY COMPONENT, 2020–2025
4.3 MARKET, BY APPLICATION TYPE, 2020–2025
4.4 MARKET, BY DEPLOYMENT TYPE, 2020–2025
4.5 MARKET, BY ORGANIZATION SIZE, 2020–2025
4.6 MARKET, MARKET SHARE OF TOP THREE VERTICALS AND REGIONS, 2020
5 MARKET OVERVIEW AND INDUSTRY TRENDS (Page No. - 36)
5.1 INTRODUCTION
5.2 MARKET DYNAMICS
5.2.1 DRIVERS
5.2.1.1 Increasing need for rapid customization and scalability
5.2.1.2 Enterprise mobility enables users to develop a business application using the low-code development platform
5.2.1.3 Elimination of gaps in the required IT skills
5.2.2 RESTRAINTS
5.2.2.1 Dependency on vendor supplied customization
5.2.3 OPPORTUNITIES
5.2.3.1 Growing digital transformation in the IT industry
5.2.3.2 Rising demand for robust solutions to maximize the visibility and control over processes
5.2.4 CHALLENGES
5.2.4.1 Legacy software needs to be upgraded
5.2.4.2 Selecting right time and right process to implement automation
5.2.5 USE CASES
5.2.5.1 Use Case: Information Technology
5.2.5.2 Use Case: Healthcare
5.2.5.3 Use Case: Manufacturing
5.2.5.4 Use Case: Telecom
5.2.5.5 Use Case: Energy and Utilities
5.2.6 REGULATORY IMPLICATIONS
5.2.6.1 Health insurance portability and accountability act
5.2.6.2 Payment card industry data security standard
5.2.6.3 SOC 2 compliance
6 IMPACT OF COVID-19 ON LOW-CODE DEVELOPMENT PLATFORM MARKET (Page No. - 43)
7 MARKET, BY COMPONENT (Page No. - 44)
7.1 INTRODUCTION
7.1.1 COMPONENT: MARKET DRIVERS
7.2 PLATFORM
7.3 SERVICES
8 LOW-CODE DEVELOPMENT PLATFORM MARKET, BY APPLICATION TYPE (Page No. - 48)
8.1 INTRODUCTION
8.1.1 APPLICATION TYPE: MARKET DRIVERS
8.2 WEB-BASED
8.3 MOBILE-BASED
8.4 DESKTOP AND SERVER-BASED
9 MARKET, BY DEPLOYMENT TYPE (Page No. - 52)
9.1 INTRODUCTION
9.1.1 DEPLOYMENT TYPE: MARKET DRIVERS
9.2 ON-PREMISES
9.3 CLOUD
10 LOW-CODE DEVELOPMENT PLATFORM MARKET, BY ORGANIZATION SIZE (Page No. - 56)
10.1 INTRODUCTION
10.1.1 ORGANIZATION SIZE: MARKET DRIVERS
10.2 LARGE ENTERPRISES
10.3 SMALL AND MEDIUM-SIZED ENTERPRISES
11 MARKET, BY INDUSTRY (Page No. - 60)
11.1 INTRODUCTION
11.1.1 INDUSTRY: MARKET DRIVERS
11.2 BANKING, FINANCIAL SERVICES AND INSURANCE
11.3 RETAIL AND ECOMMERCE
11.4 GOVERNMENT AND DEFENSE
11.5 HEALTHCARE
11.6 INFORMATION AND TECHNOLOGY
11.7 ENERGY AND UTILITIES
11.8 MANUFACTURING
11.9 OTHERS
12 LOW-CODE DEVELOPMENT PLATFORM MARKET, BY REGION (Page No. - 70)
12.1 INTRODUCTION
12.2 NORTH AMERICA
12.2.1 NORTH AMERICA: MARKET DRIVERS
12.2.2 UNITED STATES
12.2.3 CANADA
12.3 EUROPE
12.3.1 EUROPE: MARKET DRIVERS
12.3.2 UNITED KINGDOM
12.3.3 GERMANY
12.3.4 FRANCE
12.3.5 REST OF EUROPE
12.4 ASIA PACIFIC
12.4.1 ASIA PACIFIC: MARKET DRIVERS
12.4.2 CHINA
12.4.3 JAPAN
12.4.4 AUSTRALIA AND NEW ZEALAND
12.4.5 REST OF ASIA PACIFIC
12.5 MIDDLE EAST AND AFRICA
12.5.1 MIDDLE EAST AND AFRICA: MARKET DRIVERS
12.5.2 KINGDOM OF SAUDI ARABIA
12.5.3 UNITED ARAB EMIRATES
12.5.4 AFRICA
12.6 LATIN AMERICA
12.6.1 LATIN AMERICA: MARKET DRIVERS
12.6.2 BRAZIL
12.6.3 MEXICO
12.6.4 REST OF LATIN AMERICA
13 COMPETITIVE LANDSCAPE (Page No. - 123)
13.1 OVERVIEW
13.2 COMPETITIVE LEADERSHIP MAPPING
13.2.1 VISIONARY LEADERS
13.2.2 INNOVATORS
13.2.3 DYNAMIC DIFFERENTIATORS
13.2.4 EMERGING COMPANIES
14 COMPANY PROFILES (Page No. - 125)
14.1 INTRODUCTION
(Business overview, Platforms offered, Recent developments, COVID-19 related developments & SWOT analysis)*
14.2 SALESFORCE
14.3 MICROSOFT
14.4 APPIAN
14.5 ORACLE
14.6 PEGASYSTEMS
14.7 MAGIC SOFTWARE ENTERPRISES
14.8 AGILEPOINT
14.9 OUTSYSTEMS
14.1 MENDIX
14.11 ZOHO
14.12 QUICK BASE
14.13 LANSA
14.14 FUJITSU RUNMYPROCESS
14.15 NETCALL
14.16 WAVEMAKER
14.17 K2
14.18 TRACKVIA
14.19 THINKWISE SOFTWARE
14.20 MICROPACT (PART OF TYLER TECHNOLOGIES)
14.21 MRC
14.22 RIGHT-TO-WIN
*Details on Business overview, Platforms offered, Recent developments, COVID-19 related developments & SWOT analysis might not be captured in case of unlisted companies.
15 APPENDIX (Page No. - 155)
15.1 DISCUSSION GUIDE
15.2 KNOWLEDGE STORE: MARKETSANDMARKETS’ SUBSCRIPTION PORTAL
15.3 AVAILABLE CUSTOMIZATIONS
15.4 RELATED REPORTS
15.5 AUTHOR DETAILS
LIST OF TABLES (133 Tables)
TABLE 1 FACTOR ANALYSIS
TABLE 2 LOW-CODE DEVELOPMENT PLATFORM MARKET SIZE, BY COMPONENT, 2018–2025 (USD MILLION)
TABLE 3 PLATFORM: MARKET SIZE, BY REGION, 2018–2025 (USD MILLION)
TABLE 4 SERVICES: MARKET SIZE, BY REGION, 2018–2025 (USD MILLION)
TABLE 5 MARKET SIZE, BY APPLICATION TYPE, 2018–2025 (USD MILLION)
TABLE 6 WEB-BASED: MARKET SIZE, BY REGION, 2018–2025 (USD MILLION)
TABLE 7 MOBILE-BASED: MARKET SIZE, BY REGION, 2018–2025 (USD MILLION)
TABLE 8 DESKTOP AND SERVER-BASED: MARKET SIZE, BY REGION, 2018–2025 (USD MILLION)
TABLE 9 MARKET SIZE, BY DEPLOYMENT TYPE, 2020–2025 (USD MILLION)
TABLE 10 ON-PREMISES: MARKET SIZE, BY REGION, 2018–2025 (USD MILLION)
TABLE 11 CLOUD: MARKET SIZE, BY REGION, 2020–2025 (USD MILLION)
TABLE 12 MARKET SIZE, BY ORGANIZATION SIZE, 2018–2025 (USD MILLION)
TABLE 13 LARGE ENTERPRISES: MARKET SIZE, BY REGION, 2018–2025 (USD MILLION)
TABLE 14 SMALL AND MEDIUM-SIZED ENTERPRISES: MARKET SIZE, BY REGION, 2018–2025 (USD MILLION)
TABLE 15 LOW-CODE DEVELOPMENT PLATFORM MARKET SIZE, BY INDUSTRY, 2018–2025 (USD MILLION)
TABLE 16 BANKING, FINANCIAL SERVICES AND INSURANCE: MARKET SIZE, BY REGION, 2018–2025 (USD MILLION)
TABLE 17 RETAIL AND ECOMMERCE: MARKET SIZE, BY REGION, 2018–2025 (USD MILLION)
TABLE 18 GOVERNMENT AND DEFENSE: MARKET SIZE, BY REGION, 2018–2025 (USD MILLION)
TABLE 19 HEALTHCARE: MARKET SIZE, BY REGION, 2018–2025 (USD MILLION)
TABLE 20 INFORMATION AND TECHNOLOGY: MARKET SIZE, BY REGION, 2018–2025 (USD MILLION)
TABLE 21 ENERGY AND UTILITIES: MARKET SIZE, BY REGION, 2018–2025 (USD MILLION)
TABLE 22 MANUFACTURING: MARKET SIZE, BY REGION, 2018–2025 (USD MILLION)
TABLE 23 OTHERS: MARKET SIZE, BY REGION, 2018–2025 (USD MILLION)
TABLE 24 LOW-CODE DEVELOPMENT PLATFORM MARKET SIZE, BY REGION, 2018–2025 (USD MILLION)
TABLE 25 NORTH AMERICA: MARKET SIZE, BY COMPONENT, 2018–2025 (USD MILLION)
TABLE 26 NORTH AMERICA: MARKET SIZE, BY APPLICATION TYPE, 2018–2025 (USD MILLION)
TABLE 27 NORTH AMERICA: MARKET SIZE, BY DEPLOYMENT TYPE, 2018–2025 (USD MILLION)
TABLE 28 NORTH AMERICA: MARKET SIZE, BY ORGANIZATION SIZE, 2018–2025 (USD MILLION)
TABLE 29 NORTH AMERICA: MARKET SIZE, BY INDUSTRY 2018–2025 (USD MILLION)
TABLE 30 NORTH AMERICA: MARKET SIZE, BY COUNTRY, 2018–2025 (USD MILLION)
TABLE 31 UNITED STATES: MARKET SIZE, BY COMPONENT, 2018–2025 (USD MILLION)
TABLE 32 UNITED STATES: MARKET SIZE, BY APPLICATION TYPE, 2018–2025 (USD MILLION)
TABLE 33 UNITED STATES: MARKET SIZE, BY DEPLOYMENT TYPE, 2018–2025 (USD MILLION)
TABLE 34 UNITED STATES: MARKET SIZE, BY ORGANIZATION SIZE, 2018–2025 (USD MILLION)
TABLE 35 UNITED STATES: MARKET SIZE, BY INDUSTRY, 2018–2025 (USD MILLION)
TABLE 36 CANADA: MARKET SIZE, BY COMPONENT, 2018–2025 (USD MILLION)
TABLE 37 CANADA: MARKET SIZE, BY APPLICATION TYPE, 2018–2025 (USD MILLION)
TABLE 38 CANADA: MARKET SIZE, BY DEPLOYMENT TYPE, 2018–2025 (USD MILLION)
TABLE 39 CANADA: MARKET SIZE, BY ORGANIZATION SIZE, 2018–2025 (USD MILLION)
TABLE 40 CANADA: MARKET SIZE, BY INDUSTRY, 2018–2025 (USD MILLION)
TABLE 41 EUROPE: LOW-CODE DEVELOPMENT PLATFORM MARKET SIZE, BY COMPONENT, 2018–2025 (USD MILLION)
TABLE 42 EUROPE: MARKET SIZE, BY APPLICATION TYPE, 2018–2025 (USD MILLION)
TABLE 43 EUROPE: MARKET SIZE, BY DEPLOYMENT TYPE, 2018–2025 (USD MILLION)
TABLE 44 EUROPE: MARKET SIZE, BY ORGANIZATION SIZE, 2018–2025 (USD MILLION)
TABLE 45 EUROPE: MARKET SIZE, BY INDUSTRY, 2018–2025 (USD MILLION)
TABLE 46 EUROPE: MARKET SIZE, BY COUNTRY, 2018–2025 (USD MILLION)
TABLE 47 UNITED KINGDOM: MARKET SIZE, BY COMPONENT, 2018–2025 (USD MILLION)
TABLE 48 UNITED KINGDOM: MARKET SIZE, BY APPLICATION TYPE, 2018–2025 (USD MILLION)
TABLE 49 UNITED KINGDOM: MARKET SIZE, BY DEPLOYMENT TYPE, 2018–2025 (USD MILLION)
TABLE 50 UNITED KINGDOM: MARKET SIZE, BY ORGANIZATION SIZE, 2018–2025 (USD MILLION)
TABLE 51 UNITED KINGDOM: MARKET SIZE, BY INDUSTRY, 2018–2025 (USD MILLION)
TABLE 52 GERMANY: MARKET SIZE, BY COMPONENT, 2018–2025 (USD MILLION)
TABLE 53 GERMANY: MARKET SIZE, BY APPLICATION TYPE, 2018–2025 (USD MILLION)
TABLE 54 GERMANY: MARKET SIZE, BY DEPLOYMENT TYPE, 2018–2025 (USD MILLION)
TABLE 55 GERMANY: MARKET SIZE, BY ORGANIZATION SIZE, 2018–2025 (USD MILLION)
TABLE 56 GERMANY: MARKET SIZE, BY INDUSTRY, 2018–2025 (USD MILLION)
TABLE 57 FRANCE: LOW-CODE DEVELOPMENT PLATFORM MARKET SIZE, BY COMPONENT, 2018–2025 (USD MILLION)
TABLE 58 FRANCE: MARKET SIZE, BY APPLICATION TYPE, 2018–2025 (USD MILLION)
TABLE 59 FRANCE: MARKET SIZE, BY DEPLOYMENT TYPE, 2018–2025 (USD MILLION)
TABLE 60 FRANCE: MARKET SIZE, BY ORGANIZATION SIZE, 2018–2025 (USD MILLION)
TABLE 61 FRANCE: MARKET SIZE, BY INDUSTRY, 2018–2025 (USD MILLION)
TABLE 62 REST OF EUROPE: MARKET SIZE, BY COMPONENT, 2018–2025 (USD MILLION)
TABLE 63 REST OF EUROPE: MARKET SIZE, BY APPLICATION TYPE, 2018–2025 (USD MILLION)
TABLE 64 REST OF EUROPE: MARKET SIZE, BY DEPLOYMENT TYPE, 2018–2025 (USD MILLION)
TABLE 65 REST OF EUROPE: MARKET SIZE, BY ORGANIZATION SIZE, 2018–2025 (USD MILLION)
TABLE 66 REST OF EUROPE: MARKET SIZE, BY INDUSTRY, 2018–2025 (USD MILLION)
TABLE 67 ASIA PACIFIC: MARKET SIZE, BY COMPONENT, 2018–2025 (USD MILLION)
TABLE 68 ASIA PACIFIC: MARKET SIZE, BY APPLICATION TYPE, 2018–2025 (USD MILLION)
TABLE 69 ASIA PACIFIC: MARKET SIZE, BY DEPLOYMENT TYPE, 2018–2025 (USD MILLION)
TABLE 70 ASIA PACIFIC: MARKET SIZE, BY ORGANIZATION SIZE, 2018–2025 (USD MILLION)
TABLE 71 ASIA PACIFIC: MARKET SIZE, BY INDUSTRY, 2018–2025 (USD MILLION)
TABLE 72 ASIA PACIFIC: MARKET SIZE, BY COUNTRY, 2018–2025 (USD MILLION)
TABLE 73 CHINA: LOW-CODE DEVELOPMENT PLATFORM MARKET SIZE, BY COMPONENT, 2018–2025 (USD MILLION)
TABLE 74 CHINA: MARKET SIZE, BY APPLICATION TYPE, 2018–2025 (USD MILLION)
TABLE 75 CHINA: MARKET SIZE, BY DEPLOYMENT TYPE, 2018–2025 (USD MILLION)
TABLE 76 CHINA: MARKET SIZE, BY ORGANIZATION SIZE, 2018–2025 (USD MILLION)
TABLE 77 CHINA: MARKET SIZE, BY INDUSTRY, 2018–2025 (USD MILLION)
TABLE 78 JAPAN: MARKET SIZE, BY COMPONENT, 2018–2025 (USD MILLION)
TABLE 79 JAPAN: MARKET SIZE, BY APPLICATION TYPE, 2018–2025 (USD MILLION)
TABLE 80 JAPAN: MARKET SIZE, BY DEPLOYMENT TYPE, 2018–2025 (USD MILLION)
TABLE 81 JAPAN: MARKET SIZE, BY ORGANIZATION SIZE, 2018–2025 (USD MILLION)
TABLE 82 JAPAN: MARKET SIZE, BY INDUSTRY, 2018–2025 (USD MILLION)
TABLE 83 AUSTRALIA AND NEW ZEALAND: MARKET SIZE, BY COMPONENT, 2018–2025 (USD MILLION)
TABLE 84 AUSTRALIA AND NEW ZEALAND: MARKET SIZE, BY APPLICATION TYPE, 2018–2025 (USD MILLION)
TABLE 85 AUSTRALIA AND NEW ZEALAND: MARKET SIZE, BY DEPLOYMENT TYPE, 2018–2025 (USD MILLION)
TABLE 86 AUSTRALIA AND NEW ZEALAND: MARKET SIZE, BY ORGANIZATION SIZE, 2018–2025 (USD MILLION)
TABLE 87 AUSTRALIA AND NEW ZEALAND: MARKET SIZE, BY INDUSTRY, 2018–2025 (USD MILLION)
TABLE 88 REST OF ASIA PACIFIC: MARKET SIZE, BY COMPONENT, 2018–2025 (USD MILLION)
TABLE 89 REST OF ASIA PACIFIC: MARKET SIZE, BY APPLICATION TYPE, 2018–2025 (USD MILLION)
TABLE 90 REST OF ASIA PACIFIC: MARKET SIZE, BY DEPLOYMENT TYPE, 2018–2025 (USD MILLION)
TABLE 91 REST OF ASIA PACIFIC: MARKET SIZE, BY ORGANIZATION SIZE, 2018–2025 (USD MILLION)
TABLE 92 REST OF ASIA PACIFIC: MARKET SIZE, BY INDUSTRY, 2018–2025 (USD MILLION)
TABLE 93 MIDDLE EAST AND AFRICA: LOW-CODE DEVELOPMENT PLATFORM MARKET SIZE, BY COMPONENT, 2018–2025 (USD MILLION)
TABLE 94 MIDDLE EAST AND AFRICA: MARKET SIZE, BY APPLICATION TYPE, 2018–2025 (USD MILLION)
TABLE 95 MIDDLE EAST AND AFRICA: MARKET SIZE, BY DEPLOYMENT TYPE, 2018–2025 (USD MILLION)
TABLE 96 MIDDLE EAST AND AFRICA: MARKET SIZE, BY ORGANIZATION SIZE, 2018–2025 (USD MILLION)
TABLE 97 MIDDLE EAST AND AFRICA: MARKET SIZE, BY INDUSTRY, 2018–2025 (USD MILLION)
TABLE 98 KINGDOM OF SAUDI ARABIA: MARKET SIZE, BY COMPONENT, 2018–2025 (USD MILLION)
TABLE 99 KINGDOM OF SAUDI ARABIA: MARKET SIZE, BY APPLICATION TYPE, 2018–2025 (USD MILLION)
TABLE 100 KINGDOM OF SAUDI ARABIA: MARKET SIZE, BY DEPLOYMENT TYPE, 2018–2025 (USD MILLION)
TABLE 101 KINGDOM OF SAUDI ARABIA: MARKET SIZE, BY ORGANIZATION SIZE, 2018–2025 (USD MILLION)
TABLE 102 KINGDOM OF SAUDI ARABIA: MARKET SIZE, BY INDUSTRY, 2018–2025 (USD MILLION)
TABLE 103 UNITED ARAB EMIRATES: MARKET SIZE, BY COMPONENT, 2018–2025 (USD MILLION)
TABLE 104 UNITED ARAB EMIRATES: MARKET SIZE, BY APPLICATION TYPE, 2018–2025 (USD MILLION)
TABLE 105 UNITED ARAB EMIRATES: MARKET SIZE, BY DEPLOYMENT TYPE, 2018–2025 (USD MILLION)
TABLE 106 UNITED ARAB EMIRATES: MARKET SIZE, BY ORGANIZATION SIZE, 2018–2025 (USD MILLION)
TABLE 107 UAE: MARKET SIZE, BY INDUSTRY, 2018–2025 (USD MILLION)
TABLE 108 AFRICA: MARKET SIZE, BY COMPONENT, 2018–2025 (USD MILLION)
TABLE 109 AFRICA: MARKET SIZE, BY APPLICATION TYPE, 2018–2025 (USD MILLION)
TABLE 110 AFRICA: MARKET SIZE, BY DEPLOYMENT TYPE, 2018–2025 (USD MILLION)
TABLE 111 AFRICA: MARKET SIZE, BY ORGANIZATION SIZE, 2018–2025 (USD MILLION)
TABLE 112 AFRICA: MARKET SIZE, BY INDUSTRY, 2018–2025 (USD MILLION)
TABLE 113 LATIN AMERICA: LOW-CODE DEVELOPMENT PLATFORM MARKET SIZE, BY COMPONENT, 2018–2025 (USD MILLION)
TABLE 114 LATIN AMERICA: MARKET SIZE, BY APPLICATION TYPE, 2018–2025 (USD MILLION)
TABLE 115 LATIN AMERICA: MARKET SIZE, BY DEPLOYMENT TYPE, 2018–2025 (USD MILLION)
TABLE 116 LATIN AMERICA: MARKET SIZE, BY ORGANIZATION SIZE, 2018–2025 (USD MILLION)
TABLE 117 LATIN AMERICA: MARKET SIZE, BY INDUSTRY, 2018–2025 (USD MILLION)
TABLE 118 LATIN AMERICA: MARKET SIZE, BY COUNTRY, 2018–2025 (USD MILLION)
TABLE 119 BRAZIL: MARKET SIZE, BY COMPONENT, 2018–2025 (USD MILLION)
TABLE 120 BRAZIL: MARKET SIZE, BY APPLICATION TYPE, 2018–2025 (USD MILLION)
TABLE 121 BRAZIL: MARKET SIZE, BY DEPLOYMENT TYPE, 2018–2025 (USD MILLION)
TABLE 122 BRAZIL: MARKET SIZE, BY ORGANIZATION SIZE, 2018–2025 (USD MILLION)
TABLE 123 BRAZIL: LOW-CODE DEVELOPMENT PLATFORM MARKET SIZE, BY INDUSTRY, 2018–2025 (USD MILLION)
TABLE 124 MEXICO: MARKET SIZE, BY COMPONENT, 2018–2025 (USD MILLION)
TABLE 125 MEXICO: MARKET SIZE, BY APPLICATION TYPE, 2018–2025 (USD MILLION)
TABLE 126 MEXICO: MARKET SIZE, BY DEPLOYMENT TYPE, 2018–2025 (USD MILLION)
TABLE 127 MEXICO: MARKET SIZE, BY ORGANIZATION SIZE, 2018–2025 (USD MILLION)
TABLE 128 MEXICO: MARKET SIZE, BY INDUSTRY, 2018–2025 (USD MILLION)
TABLE 129 REST OF LATIN AMERICA: MARKET SIZE, BY COMPONENT, 2018–2025 (USD MILLION)
TABLE 130 REST OF LATIN AMERICA: MARKET SIZE, BY APPLICATION TYPE, 2018–2025 (USD MILLION)
TABLE 131 REST OF LATIN AMERICA: MARKET SIZE, BY DEPLOYMENT TYPE, 2018–2025 (USD MILLION)
TABLE 132 REST OF LATIN AMERICA: MARKET SIZE, BY ORGANIZATION SIZE, 2018–2025 (USD MILLION)
TABLE 133 REST OF LATIN AMERICA: MARKET SIZE, BY INDUSTRY, 2018–2025 (USD MILLION)
LIST OF FIGURES (33 Figures)
FIGURE 1 LOW-CODE DEVELOPMENT PLATFORM MARKET: RESEARCH DESIGN
FIGURE 2 MARKET SIZE ESTIMATION METHODOLOGY, APPROACH 1 (SUPPLY SIDE): REVENUE OF PRODUCTS/SOLUTIONS/SERVICES OF THE MARKET
FIGURE 3 MARKET SIZE ESTIMATION METHODOLOGY—APPROACH 1— BOTTOM-UP (SUPPLY SIDE): COLLECTIVE REVENUE OF ALL PRODUCTS/SOLUTIONS/SERVICES OF THE MARKET
FIGURE 4 MARKET SIZE ESTIMATION METHODOLOGY—APPROACH 2—BOTTOM-UP (DEMAND SIDE): PRODUCTS/SOLUTIONS/SERVICES SOLD AND THEIR AVERAGE SELLING PRICE
FIGURE 5 LOW- CODE DEVELOPMENT PLATFORM MARKET SNAPSHOT, 2018–2025
FIGURE 6 LARGE ENTERPRISES SEGMENT TO HOLD A LARGER MARKET SIZE DURING THE FORECAST PERIOD
FIGURE 7 NORTH AMERICA TO HOLD THE HIGHEST MARKET SHARE DURING THE FORECAST PERIOD
FIGURE 8 INCREASING NEED OF DIGITALIZATION AND MATURITY AROUND AGILE DEVOPS PRACTICES TO DRIVE THE ADOPTION OF LOW-CODE DEVELOPMENT PLATFORM AND SERVICES
FIGURE 9 PLATFORM SEGMENT TO HOLD A HIGHER MARKET SHARE DURING THE FORECAST PERIOD
FIGURE 10 WEB-BASED SEGMENT TO HOLD THE HIGHEST MARKET SIZE DURING THE FORECAST PERIOD
FIGURE 11 CLOUD SEGMENT TO HOLD A HIGHER MARKET SHARE DURING THE FORECAST PERIOD
FIGURE 12 SMALL AND MEDIUM-SIZED ENTERPRISES SEGMENT TO HAVE A HIGHER MARKET SIZE DURING THE FORECAST PERIOD
FIGURE 13 BANKING, FINANCIAL SERVICES, AND INSURANCE VERTICAL AND NORTH AMERICA TO HAVE THE HIGHEST MARKET SHARES IN 2020
FIGURE 14 DRIVERS, RESTRAINTS, OPPORTUNITIES, AND CHALLENGES: LOW-CODE DEVELOPMENT PLATFORM MARKET
FIGURE 15 PLATFORM SEGMENT TO GROW AT A HIGHER RATE DURING THE FORECAST PERIOD
FIGURE 16 CLOUD SEGMENT TO HOLD A LARGER MARKET SIZE
FIGURE 17 SMALL AND MEDIUM-SIZED ENTERPRISES SEGMENT TO GROW AT A HIGHER CAGR DURING THE FORECAST PERIOD
FIGURE 18 BANKING, FINANCIAL SERVICES AND INSURANCE INDUSTRY TO REGISTER THE HIGHEST CAGR DURING THE FORECAST PERIOD
FIGURE 19 ASIA PACIFIC TO GROW AT THE HIGHEST CAGR DURING THE FORECAST PERIOD
FIGURE 20 NORTH AMERICA: MARKET SNAPSHOT
FIGURE 21 ASIA PACIFIC: MARKET SNAPSHOT
FIGURE 22 LOW-CODE DEVELOPMENT PLATFORM MARKET (GLOBAL), COMPETITIVE LEADERSHIP MAPPING, 2020
FIGURE 23 SALESFORCE: COMPANY SNAPSHOT
FIGURE 24 SALESFORCE: SWOT ANALYSIS
FIGURE 25 MICROSOFT: COMPANY SNAPSHOT
FIGURE 26 MICROSOFT: SWOT ANALYSIS
FIGURE 27 APPIAN: COMPANY SNAPSHOT
FIGURE 28 APPIAN: SWOT ANALYSIS
FIGURE 29 ORACLE: COMPANY SNAPSHOT
FIGURE 30 ORACLE: SWOT ANALYSIS
FIGURE 31 PEGASYSTEMS: COMPANY SNAPSHOT
FIGURE 32 PEGASYSTEMS: SWOT ANALYSIS
FIGURE 33 MAGIC SOFTWARE ENTERPRISES: COMPANY SNAPSHOT
The study involved four major activities to estimate the current size of the low-code development platform market. An exhaustive secondary research was done to collect information on the market. The next step was to validate these findings, assumptions, and sizing with industry experts across the value chain using primary research. Both top-down and bottom-up approaches were employed to estimate the complete market size. Thereafter, the market breakup and data triangulation procedures were used to estimate the size of the segments and subsegments of the market.
Secondary Research
In the secondary research process, various secondary sources, such as Hoovers, Bloomberg BusinessWeek, and Dun & Bradstreet, have been referred to for identifying and collecting information for this study. These secondary sources included annual reports, press releases and investor presentations of companies, whitepapers, certified publications, such as International Journal of Engineering and Advanced Technology (IJEAT), Association of Information Technology Professionals (AITF), and articles by recognized authors, gold standard and silver standard websites, regulatory bodies, trade directories, and databases.
Primary Research
The low-code development platform market comprises several stakeholders, low-code development platform specialists, low-code development platform and service providers, business analysts, business intelligence tools, enterprise users, telecommunication providers, technology consultants, and System Integrators (SIs). The demand side of the market consists of Information Technology (IT), Banking, Financial Services and Insurance (BFSI), telecom, government, transportation, healthcare, education, and others. The supply side includes low-code development platform and service providers. Various primary sources from both the supply and demand sides of the market were interviewed to obtain qualitative and quantitative information.
Following is the breakup of the primary respondent:
To know about the assumptions considered for the study, download the pdf brochure
Market Size Estimation
Both top-down and bottom-up approaches were used to estimate and validate the total size of the low-code development platform market. These methods were also used extensively to estimate the size of various segments in the market. The research methodology used to estimate the market size includes the following:
- Key players in the market have been identified through extensive secondary research.
- The industry’s supply chain and market size, in terms of value, have been determined through primary and secondary research processes.
- All percentage shares, splits, and breakups have been determined using secondary sources and verified through primary sources.
Data Triangulation
After arriving at the overall market size using the market size estimation processes as explained above, the market was split into several segments and subsegments. To complete the overall market engineering process and arrive at the exact statistics of each market segment and subsegment, data triangulation, and market breakup procedures were employed, wherever applicable. The data was triangulated by studying various factors and trends from both the demand and supply sides.
Report Objectives
- To determine and forecast the global low-code development platform market by component, application type, deployment type, organization size, industry, and region from 2020 to 2025, and analyze the various macroeconomic and microeconomic factors that affect the market growth
- forecast the size of the market segments with respect to five main regions: North America, Europe, Asia Pacific (APAC), Middle East and Africa (MEA), and Latin America
- analyze each submarket with respect to individual growth trends, prospects, and contributions to the overall market
- provide detailed information about the major factors (drivers, restraints, opportunities, and challenges) influencing the growth of the market
Key questions addressed by the report
- What are the opportunities in the global low-code development platform market?
- What is the competitive landscape in the market?
- What are the restraining factors that will impact the market?
- How have global market solutions evolved from traditional interactive solutions?
- What are the dynamics of the global market?
Available Customizations
With the given market data, MarketsandMarkets offers customizations as per the company’s specific needs. The following customization options are available for the report:
Geographic Analysis
- Further breakup of the European market, which includes the rest of Europe countries, such as the Netherlands, Spain, and Denmark
- Further breakup of the APAC market includes India, Indonesia, and Singapore
- Further breakup of the Latin America market, comprising Argentina and Chile
Company Information
- Detailed analysis and profiling of additional market players (up to five)


Growth opportunities and latent adjacency in Low-Code Development Platform Market
Which is fastest growing technology used in Low-Code Development Platform Market?