Long Term Evolution (LTE) Market (2010-2015) By Infrastructure (E-Utran, E Node B, EPC), End-User Devices (Smartphones, USB Modems, Card Modules, Netbooks) & Services


The global LTE market is expected to grow from $2.28 billion in 2010 to $262.05 billion in 2015. This represents a CAGR of 158.2% from 2010 to 2015. Saturation in the existing 3G networks, the quest for higher data rates and the need for spectral efficiency have been prominent factors, triggering the demand for global LTE deployments. North America is the fastest growing market in terms of LTE infrastructure setup; whereas EMEA faces certain government-related issues with regards to spectrum auctions. Asia-Pacific, Japan, and Latin America are the fastest growing regions.
Ericsson and Nokia Siemens Networks are organizations imposing huge challenges to the other market players in the LTE market, as they have a deep penetration in the LTE infrastructure, as well as LTE end user market. Owing to their widespread reach in both these segments, these firms have a deep understanding of the technology and the complexities involved, thereby eyeing economies of scale, without compromising on the enhanced spectral efficiency.
The LTE market has wide scope in terms of operability as it is capable of operating in both TDD and the FDD modes, thereby giving flexibility to the operators. With innovations such as network sharing and hybrid networks budding in the market of late, LTE players have immense opportunity which still remains untapped.
One of the most important fact remains that the network operators will require new spectrum for LTE as they will not cease the operation of their existing 2G and 3G systems. The currently available devices work either on 2G or 3G networks however are not compatible with 4G technology. Essential criteria for accessing LTE network is that the devices must support available frequencies, interface features like MIMO and compatible modulation as well as coding scheme. At the same time, the devices must have a backward compatibility with the existing 3G networks. Thus converting 3G compatible devices to 4G compatible ones will be expensive as well as the initial LTE devices cost will be high, thereby making it difficult to achieve the necessary economies of scale. This remains to be an open ended question in the market as prominent vendors struggle to find the answer.
WiMAX and LTE are currently available fourth generation communication standards. Both WiMAX and LTE provide high downlink and uplink speeds than any other wireless networks available currently. The standards differ in deployment and integration features however differ less in functionality. WiMAX is associated with IEEE and LTE is with 3GPP. Network infrastructure upgrading is easier for LTE as compared to WiMAX however; IEEE standards are more open than those of 3GPP. While WiMAX is more apt for broadband purposes, LTE holds immense potential in the cellular market.
Scope of the report
This research report segments the global LTE market on the basis of infrastructure, end-user devices, and services. It is further sub-segmented in terms of regions and revenues, giving insights of market trends and applications in each sub segment.
On the basis of market segments:
- Infrastructure
- End-user device
- Services
On the basis of application:
- Video telephony
- Browsing
- Sharing
- Gaming
- Live TV
On the basis of geography:
- North America
- Europe, the Middle East and Africa
- Asia Pacific and Japan
- Latin America
Long Term Evolution (LTE) Market (2010-2015) By Infrastructure (E-Utran, E Node B, EPC), End-User Devices (Smartphones, USB Modems, Card Modules, Netbooks) & Services
The global LTE market is expected to grow from $2.28 billion in 2010 to $262.05 billion in 2015, at a CAGR of 158.2% from 2010 to 2015. The global LTE market is segmented into infrastructure, end user devices, and services. The infrastructure market captures the largest share at the initial stages. However, from 2012 to 2013, end-user devices will take up pace and from 2014 onwards, the services market will increase at a fast pace.
The primary factor that drives the market is enhanced spectrum efficiency and reduced long term infrastructure cost. However, factors such as rising data traffic and emergence of new applications and devices are expected to further accelerate the LTE market. Real-time video conferencing, social networking, YouTube, and other high-bandwidth applications have further triggered the demand for more speed with enhanced user experience, giving way to the need for enhanced mobile networks.
North America is the fastest growing market in terms of LTE infrastructure setup; whereas EMEA faces certain government-related issues with regards to spectrum auctions. Asia-Pacific, Japan, and Latin America are the fastest growing regions.
Global LTE Market (2010-2015)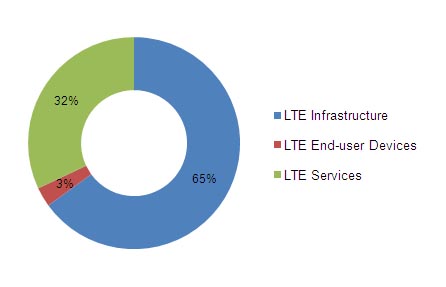
Source: MarketsandMarkets
 Exclusive indicates content/data unique to MarketsandMarkets and not available with any competitors.
TABLE OF CONTENTS
1 INTRODUCTION
1.1 KEY TAKE-AWAYS
1.2 REPORT DESCRIPTION
1.3 MARKETS COVERED
1.4 STAKEHOLDERS
1.5 TAXONOMY
1.6 FORECAST ASSUMPTIONS
1.7 RESEARCH METHODOLOGY
2 SUMMARY
3 MARKET OVERVIEW
3.1 LTE DEFINITION
3.2 LTE MARKET SEGMENTATION
3.3 LTE MARKET SIZE & TRENDS
3.4 LTE SYSTEM REQUIREMENT & FEATURES
3.5 COMPARISON OF LTE & WIMAX
3.6 LTE ON THE BASIS OF DUPLEXING TECHNIQUES
3.6.1 FDD
3.6.2 TDD
3.7 MARKET DYNAMICS
3.7.1 DRIVERS
3.7.1.1 LTE enhances spectrum efficiency
3.7.1.2 LTE reduces long-term cost of infrastructure
3.7.1.3 Rising data traffic
3.7.1.4 Emergence of new applications & devices
3.7.2 RESTRAINTS
3.7.2.1 Lack of infrastructure increases network complexity
3.7.2.2 Device compatibility issues
3.7.3 OPPORTUNITIES
3.7.3.1 Standardization of infrastructure platform
3.7.3.2 High data transfer rates in LTE spectrums
3.7.3.3 Scope for high bandwidth application developers
3.7.3.4 Rising demand for LTE-enabled devices
3.8 IMPACT ANALYSIS ON THE LTE MARKET
3.9 WINNING IMPERATIVES
3.9.1 OPERATORS DEMANDING HYBRID NETWORK
3.9.2 NETWORK SHARING
3.1 BURNING ISSUES
3.10.1 CIRCUIT SWITCHING FALLBACK
3.10.2 SCARCITY OF SPECTRUM
3.10.3 HSPA PLAYERS MOVING TO HSPA+ FIRST
3.11 OPPORTUNITY ANALYSIS
3.12 MARKET SHARE ANALYSIS
3.12.1 METHODOLOGY
3.12.2 OVERVIEW
3.13 PATENT ANALYSIS
4 LTE MARKET � BY TYPES
4.1 LTE MARKET
4.2 LTE INFRASTRUCTURE MARKET
4.2.1 E-UTRAN & E NODEB
4.2.2 EPC
4.2.2.1 Subcomponents of the EPC
4.2.3 MARKET REVENUE & FORECAST
4.3 LTE ENDUSER DEVICES MARKET
4.3.1 SMARTPHONES
4.3.2 NETBOOKS
4.3.3 USB MODEMS
4.3.4 UNIT SHIPMENTS & FORECAST
4.3.5 MARKET REVENUE & FORECAST
4.4 LTE SERVICES MARKET
4.4.1 CONSULTING SERVICES
4.4.2 INTEGRATION SERVICES
4.4.3 MAINTENANCE SERVICES
4.4.4 MARKET REVENUES & FORECAST
4.5 LTE MARKET SEGMENTATION ON THE BASIS OF APPLICATIONS
5 GEOGRAPHICAL ANALYSIS
5.1 MARKET OVERVIEW
5.1.1 MARKET REVENUE & FORECAST
5.1.2 INFRASTRUCTURE MARKET
5.1.3 END-USER DEVICES MARKET
5.1.4 SERVICES MARKET
5.1.5 LTE SUBSCRIBERS
5.2 NORTH AMERICA
5.2.1 OVERVIEW
5.2.2 TRENDS
5.2.3 MARKET REVENUE & FORECAST
5.3 EUROPE MIDDLE EAST & AFRICA
5.3.1 OVERVIEW
5.3.2 TRENDS
5.3.3 MARKET REVENUE & FORECAST
5.4 ASIA PACIFIC & JAPAN
5.4.1 OVERVIEW
5.4.2 TRENDS
5.4.3 MARKET REVENUE & FORECAST
5.5 LATIN AMERICA
5.5.1 OVERVIEW
5.5.2 TRENDS
5.5.3 MARKET REVENUE & FORECAST
6 COMPETITIVE LANDSCAPE
7 COMPANY PROFILES
7.1 ALCATEL-LUCENT
7.1.1 OVERVIEW
7.1.2 PRIMARY BUSINESS
7.1.3 FINANCIALS
7.1.4 STRATEGY
7.1.5 DEVELOPMENTS
7.2 ALTAIR SEMICONDUCTOR
7.2.1 OVERVIEW
7.2.2 PRIMARY BUSINESS
7.2.3 STRATEGY
7.2.4 DEVELOPMENTS
7.3 AT&T INC
7.3.1 OVERVIEW
7.3.2 PRIMARY BUSINESS
7.3.3 FINANCIALS
7.3.4 STRATEGY
7.3.5 DEVELOPMENTS
7.4 CHINA MOBILE LTD
7.4.1 OVERVIEW
7.4.2 PRIMARY BUSINESS
7.4.3 FINANCIALS
7.4.4 STRATEGY
7.4.5 DEVELOPMENTS
7.5 ERICSSON
7.5.1 OVERVIEW
7.5.2 PRIMARY BUSINESS
7.5.3 FINANCIALS
7.5.4 STRATEGY
7.5.5 DEVELOPMENTS
7.6 HUAWEI TECHNOLOGIES CO. LTD
7.6.1 OVERVIEW
7.6.2 PRIMARY BUSINESS
7.6.3 FINANCIALS
7.6.4 STRATEGY
7.6.5 DEVELOPMENTS
7.7 LG ELECTRONICS
7.7.1 OVERVIEW
7.7.2 PRIMARY BUSINESS
7.7.3 FINANCIALS
7.7.4 STRATEGY
7.7.5 DEVELOPMENTS
7.8 METROPCS COMMUNICATIONS INC
7.8.1 OVERVIEW
7.8.2 PRIMARY BUSINESS
7.8.3 FINANCIALS
7.8.4 STRATEGY
7.8.5 DEVELOPMENTS
7.9 MOTOROLA SOLUTIONS INC
7.9.1 OVERVIEW
7.9.2 PRIMARY BUSINESS
7.9.3 FINANCIALS
7.9.4 STRATEGY
7.9.5 DEVELOPMENTS
7.10 MOBILE TELESYSTEMS OJSC
7.10.1 OVERVIEW
7.10.2 PRIMARY BUSINESS
7.10.3 FINANCIALS
7.10.4 STRATEGY
7.10.5 DEVELOPMENTS
7.11 NOKIA CORPORATION
7.11.1 OVERVIEW
7.11.2 PRIMARY BUSINESS
7.11.3 FINANCIALS
7.11.4 STRATEGY
7.11.5 DEVELOPMENTS
7.12 NTT DOCOMO INC
7.12.1 OVERVIEW
7.12.2 PRIMARY BUSINESS
7.12.3 FINANCIALS
7.12.4 STRATEGY
7.12.5 DEVELOPMENTS
7.13 QUALCOMM INC
7.13.1 OVERVIEW
7.13.2 PRIMARY BUSINESS
7.13.3 FINANCIALS
7.13.4 STRATEGY
7.13.5 DEVELOPMENTS
7.14 RESEARCH IN MOTION
7.14.1 OVERVIEW
7.14.2 PRIMARY BUSINESS
7.14.3 FINANCIALS
7.14.4 STRATEGY
7.14.5 DEVELOPMENTS
7.15 RUNCOM TECHNOLOGIES LTD
7.15.1 OVERVIEW
7.15.2 PRIMARY BUSINESS
7.15.3 STRATEGY
7.15.4 DEVELOPMENTS
7.16 SAMSUNG ELECTRONICS CO. LTD
7.16.1 OVERVIEW
7.16.2 PRIMARY BUSINESS
7.16.3 FINANCIALS
7.16.4 STRATEGY
7.16.5 DEVELOPMENTS
7.17 TELEFONICA O2
7.17.1 OVERVIEW
7.17.2 PRIMARY BUSINESS
7.17.3 FINANCIALS
7.17.4 STRATEGY
7.17.5 DEVELOPMENTS
7.18 TELENOR ASA
7.18.1 OVERVIEW
7.18.2 PRIMARY BUSINESS
7.18.3 FINANCIALS
7.18.4 STRATEGY
7.18.5 DEVELOPMENTS
7.19 TELIASONERA AB
7.19.1 OVERVIEW
7.19.2 PRIMARY BUSINESS
7.19.3 FINANCIALS
7.19.4 STRATEGY
7.19.5 DEVELOPMENTS
7.20 TELSTRA CORP LTD
7.20.1 OVERVIEW
7.20.2 PRIMARY BUSINESS
7.20.3 FINANCIALS
7.20.4 STRATEGY
7.20.5 DEVELOPMENTS
7.21 VERIZON COMMUNICATIONS INC
7.21.1 OVERVIEW
7.21.2 PRIMARY BUSINESS
7.21.3 FINANCIALS
7.21.4 STRATEGY
7.21.5 DEVELOPMENTS
7.22 VODAFONE
7.22.1 OVERVIEW
7.22.2 PRIMARY BUSINESS
7.22.3 FINANCIALS
7.22.4 STRATEGY
7.22.5 DEVELOPMENTS
7.23 ZTE CORPORATION
7.23.1 OVERVIEW
7.23.2 PRIMARY BUSINESS
7.23.3 FINANCIALS
7.23.4 STRATEGY
7.23.5 DEVELOPMENTS
8 APPENDIX
U.S. PATENTS
EUROPE PATENTS
JAPAN PATENTS
LIST OF TABLES
1 FORECAST ASSUMPTIONS
2 GLOBAL LTE MARKET REVENUE, BY TYPES 2010 � 2015 ($BILLION)
3 GLOBAL LTE MARKET (2010 � 2015)
4 LTE MARKET, BY TYPES 2010 � 2015 (Y-O-Y GROWTH %)
5 LTE MARKET, BY TYPES 2010 � 2015 (PROPORTION)
6 LTE SYSTEM REQUIREMENTS
7 LTE SYSTEM FEATURES
8 ON THE BASIS OF TECHNOLOGY
9 LTE SUBSCRIBERS, BY TYPES OF DUPLEXING TECHNIQUES 2010 � 2015 (MILLION)
10 LTE SUBSCRIBERS, BY DUPLEXING TECHNIQUES 2010 � 2015 (PROPORTION)
11 IMPACT ANALYSIS OF VARIOUS FACTORS ON LTE MARKET
12 LIST OF FREQUENCY BANDS
13 DIFFERENCE BETWEEN HSPA+ & LTE
14 PARAMETERS FOR MARKET PERFORMANCE
15 PARAMETERS FOR MARKET GROWTH
16 LTE INFRASTRUCTURE MARKET REVENUE, BY TYPES 2010 � 2015 ($BILLION)
17 LTE INFRASTRUCTURE MARKET, BY TYPES 2010 � 2015 (Y-O-Y GROWTH %)
18 LTE INFRASTRUCTURE MARKET, BY TYPES 2010 � 2015 (PROPORTION)
19 LTE DEVICES FORECAST, BY TYPES 2010 � 2015 (UNIT SHIPMENTS IN MILLIONS)
20 LTE DEVICES FORECAST, BY TYPES 2010 � 2015 (PROPORTION)
21 LTE END-USER DEVICES MARKET REVENUES, BY TYPES 2010 � 2015 ($MILLION)
22 LTE END-USER DEVICES MARKET, BY TYPES 2010 � 2015 (Y-O-Y GROWTH %)
23 LTE END-USER DEVICES MARKET, BY TYPES 2010 � 2015 (PROPORTION)
24 LTE SERVICES MARKET REVENUE, BY TYPES 2010 � 2015 ($BILLION)
25 LTE SERVICES MARKET, BY TYPES 2010 � 2015 (Y-O-Y GROWTH %)
26 LTE SERVICES MARKET, BY TYPES 2010 � 2015 (PROPORTION)
27 COMPARISON OF APPLICATIONS IN CURRENT ENVIRONMENT & LTE ENVIRONMENT
28 LTE MARKET REVENUE, BY APPLICATIONS 2010 � 2015 ($BILLION)
29 LTE MARKET, BY APPLICATIONS 2010 � 2015 (Y-O-Y GROWTH %)
30 LTE MARKET, BY APPLICATIONS 2010 � 2015 (PROPORTION)
31 LTE MARKET REVENUE, BY GEOGRAPHY 2010 � 2015 ($BILLION)
32 LTE MARKET, BY GEOGRAPHY 2010 � 2015 (Y-O-Y GROWTH %)
33 LTE MARKET, BY GEOGRAPHY 2010 � 2015 (PROPORTION)
34 LTE INFRASTRUCTURE MARKET REVENUE, BY GEOGRAPHY 2010 � 2015 ($MILLION)
35 LTE INFRASTRUCTURE MARKET, BY GEOGRAPHY 2010 � 2015 (Y-O-Y GROWTH %)
36 LTE INFRASTRUCTURE MARKET, BY GEOGRAPHY 2010 � 2015 (PROPORTION)
37 LTE END-USER DEVICES MARKET REVENUE, BY GEOGRAPHY 2010 � 2015 ($MILLION)
38 LTE END-USER DEVICES MARKET, BY GEOGRAPHY 2010 � 2015 (Y-O-Y GROWTH %)
39 LTE END-USER DEVICES MARKET, BY GEOGRAPHY 2010 � 2015 (PROPORTION)
40 LTE SERVICES MARKET REVENUE, BY GEOGRAPHY 2010 � 2015 ($MILLION)
41 LTE SERVICES MARKET, BY GEOGRAPHY 2010 � 2015 (Y-O-Y GROWTH %)
42 LTE SERVICES MARKET, BY GEOGRAPHY 2010 � 2015 (PROPORTION)
43 LTE SUBSCRIBERS, BY GEOGRAPHY 2010 � 2015 (MILLION)
44 LTE SUBSCRIBERS, BY GEOGRAPHY 2010 � 2015 (PROPORTION)
45 NORTH AMERICA: LTE MARKET REVENUE, BY TYPES 2010 � 2015 ($BILLION)
46 NORTH AMERICA: LTE MARKET, BY TYPES 2010 � 2015 (Y-O-Y GROWTH %)
47 NORTH AMERICA: LTE MARKET, BY TYPES 2010 � 2015 (PROPORTION)
48 EMEA: LTE MARKET REVENUE, BY TYPES 2010 � 2015 ($BILLION)
49 EMEA: LTE MARKET, BY TYPES 2010 � 2015 (Y-O-Y GROWTH %)
50 EMEA: LTE MARKET, BY TYPES 2010 � 2015 (PROPORTION)
51 APJ: LTE MARKET REVENUE, BY TYPES 2010 � 2015 ($BILLION)
52 APJ: LTE MARKET, BY TYPES 2010 � 2015 (Y-O-Y GROWTH %)
53 APJ: LTE MARKET, BY TYPES 2010 � 2015 (PROPORTION)
54 LATIN AMERICA: LTE MARKET REVENUE, BY TYPES 2010 � 2015 ($MILLION)
55 LATIN AMERICA: LTE MARKET, BY TYPES 2010 � 2015 (Y-O-Y GROWTH %)
56 LATIN AMERICA: LTE MARKET, BY TYPES 2010 � 2015 (PROPORTION)
57 NEW PRODUCTS (FEBRUARY 2009 - APRIL 2011)
58 AGREEMENTS & COLLABORATIONS (MARCH 2009 � APRIL 2011)
59 MERGERS & ACQUISITIONS (JUNE 2009 - APRIL 2011)
60 ALCATEL-LUCENT: REVENUE, BY SEGMENTS ($MILLION)
61 AT&T INC: REVENUE, BY SEGMENTS ($MILLION)
62 CHINA MOBILE LTD: REVENUE, BY SEGMENTS ($MILLION)
63 ERICSSON: REVENUE, BY SEGMENTS ($MILLION)
64 HUAWEI TECHNOLOGIES: REVENUE, BY SEGMENTS ($MILLION)
65 HUAWEI TECHNOLOGIES: REVENUE, BY GEOGRAPHY ($MILLION)
66 LG ELECTRONICS: REVENUE, BY SEGMENTS ($BILLION)
67 METROPCS COMMUNICATIONS INC: REVENUE, BY SEGMENTS ($MILLION)
68 MOTOROLA SOLUTIONS INC: REVENUE, BY GEOGRAPHY ($MILLION )
69 MOBILE TELESYSTEMS OJSC: REVENUE, BY SEGMENTS ($MILLION)
70 NOKIA CORPORATION: REVENUE, BY SEGMENTS ($MILLION)
71 NOKIA CORPORATION: REVENUE, BY GEOGRAPHY
72 NTT DOCOMO INC: REVENUE, BY BUSINESS SEGMENTS ($MILLION)
73 NTT DOCOMO INC: REVENUE, BY SEGMENTS ($MILLION)
74 QUALCOMM INC: REVENUE, BY SEGMENTS ($MILLION)
75 QUALCOMM INC: REVENUE, BY GEOGRAPHY ($MILLION)
76 QUALCOMM INC: REVENUE, BY PARTICULARS ($MILLION)
77 RESEARCH IN MOTION: REVENUE, BY SEGMENTS ($MILLION)
78 RESEARCH IN MOTION: REVENUE, BY GEOGRAPHY ($MILLION)
79 SAMSUNG ELECTRONICS: REVENUE, BY SEGMENTS ($BILLION)
80 TELEFONICA O2: REVENUE, BY SEGMENTS ($MILLION)
81 TELENOR ASA: REVENUE, BY SEGMENTS ($MILLION)
82 TELENOR ASA: REVENUE, BY GEOGRAPHY ($MILLION)
83 TELIASONERA AB: REVENUE, BY SEGMENTS ($MILLION)
84 TELIASONERA AB: REVENUE, BY GEOGRAPHY ($MILLION)
85 TELSTRA CORP LTD: REVENUE, BY SEGMENTS ($MILLION)
86 VERIZON COMMUNICATIONS INC: REVENUE, BY SEGMENTS ($MILLION)
87 VODAFONE: REVENUE, BY GEOGRAPHY ($MILLION)
88 ZTE CORP: REVENUE, BY PRODUCT SEGMENTS ($MILLION)
89 ZTE CORP: REVENUE, BY GEOGRAPHY ($MILLION)
LIST OF FIGURES
1 APPLICATIONS OF LTE MARKET VERTICALS (2010)
2 EVOLUTION OF 3GPP
3 LTE MARKET SEGMENTATION
4 LTE MARKET, BY TYPES, PROPORTION & FORECAST (2010 � 2015)
5 LTE ACCESS TECHNOLOGIES
6 ON THE BASIS OF EVOLUTION
7 ON THE BASIS OF DEVICES
8 LTE SUBSCRIBERS, BY TYPES, PROPORTION & FORECAST OF DUPLEXING TECHNIQUES (2010 � 2015)
9 DATA FLOW IN FDD
10 DATA FLOW IN TDD
11 LTE BASE STATION EQUIPMENT COST TREND
12 INCREASING MOBILE DATA TRAFFIC (TB/MONTH)
13 SOPHISTICATION OF MOBILE SERVICES
14 ARCHITECTURE FOR CS FALLBACK IN EPS
15 OPPORTUNITY ANALYSIS MATRIX
16 MARKET SHARE ANALYSIS OF TOP PLAYERS
17 GLOBAL LTE MARKET PATENTS (MARCH 2005 � APRIL 2011)
18 GLOBAL LTE MARKET PATENTS (MARCH 2005 � FEBRUARY 2011)
19 LTE MARKET, BY TYPES (2010)
20 LTE INFRASTRUCTURE MARKET PROPORTION & FORECAST, BY TYPES (2010 � 2015)
21 LTE DEVICES PROPORTION & FORECAST, BY TYPES (2010 � 2015)
22 LTE END-USER DEVICES MARKET PROPORTION & FORECAST, BY TYPES (2010 � 2015)
23 LTE SERVICES MARKET PROPORTION & FORECAST, BY TYPES (2010 � 2015)
24 LTE MARKET PROPORTION & FORECAST, BY APPLICATIONS (2010 � 2015)
25 LTE MARKET PROPORTION & FORECAST, BY GEOGRAPHY (2010 � 2015)
26 LTE INFRASTRUCTURE MARKET PROPORTION & FORECAST, BY GEOGRAPHY (2010 � 2015)
27 LTE END USER DEVICES MARKET PROPORTION & FORECAST, BY GEOGRAPHY (2010 � 2015)
28 LTE SERVICES MARKET PROPORTION & FORECAST, BY GEOGRAPHY (2010 � 2015)
29 LTE SUBSCRIBERS PROPORTION & FORECAST, BY GEOGRAPHY (2010 � 2015)
30 INCREASE IN MOBILE INTERNET USERS
31 NORTH AMERICA: LTE MARKET PROPORTION & FORECAST, BY TYPES (2010 � 2015)
32 EMEA: LTE MARKET PROPORTION & FORECAST, BY TYPES (2010 � 2015)
33 APJ: LTE MARKET PROPORTION & FORECAST, BY TYPES (2010 � 2015)
34 LATIN AMERICA: LTE MARKET PROPORTION & FORECAST, BY TYPES (2010 � 2015)


Growth opportunities and latent adjacency in Long Term Evolution (LTE) Market
Interested in understanding geographical analysis
Looking for market sizes (revenue and/or unit sales) of LTE enabled: a. M2M devices, b. handsets, c. basestations, d. femtocells, and e. tablets, by region (e.g. North America, Europe, etc.).