Marine Adhesives Market by Resin Type (Epoxy, Acrylic, Polyurethane), Substrate (Metals, Composites, Plastics), Vessel (Cargo Ships, Passenger Ships, Boats), Application (Deck System, Glazing System, Panel Bonding), and Region - Global Forecast to 2022


[140 Pages Report] Marine Adhesives Market size is estimated at USD 354.9 Million in 2016 and is projected to reach USD 466.2 Million by 2022, at a CAGR of 4.6% during the forecast period. The forecast period has been considered from 2017 to 2022, while 2016 is considered as the base year to estimate the market size.
This report aims to estimate the size and future growth of the marine adhesives market across different segments such as resin type, application, and region. It analyzes the opportunities in the market for stakeholders and presents a competitive landscape for market leaders. Factors such as drivers, restraints, opportunities, and industry-specific challenges influencing market growth have also been studied in this report.
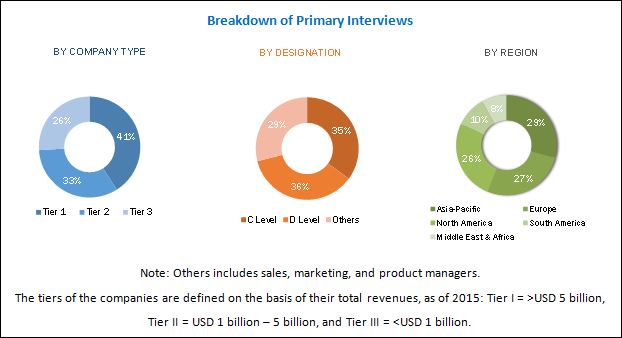
Top-down and bottom-up approaches were used to estimate and validate the size of the global market as well as that of various other dependent submarkets in the marine adhesives market. The research study involved extensive use of secondary sources, directories, and databases such as Hoovers, Bloomberg, Chemical Weekly, Factiva, related associations/institutes, and other government associations. Public as well as private company websites were also used to identify and collect information useful for a technical, market-oriented, and commercial study of the global marine adhesives market. After arriving at the total market size, the overall market was split into several segments and subsegments. The figure given below provides a breakdown of the primaries conducted during the research study based on company type, designation, and region.
To know about the assumptions considered for the study, download the pdf brochure
Key manufacturers of marine adhesives are Henkel (Germany), 3M (U.S.), Sika (Switzerland), ITW (U.S.), Huntsman (U.S.), H.B. Fuller (U.S.), Ashland (U.S.), Bostik (France), LORD Corporation (U.S.), Scott Bader (U.K.), MAPEI (Italy), Permabond (U.K.), SCIGRIP (U.S.), WEICON (Germany), Gurit (Switzerland), Master Bond (U.S.), Parson Adhesives (U.S.), Anabond (India), HYBOND (U.K.), SABA Dinxperlo (The Netherlands), Chemique Adhesives & Sealants (U.K.), Ri�d B.V. (The Netherlands), Hernon Manufacturing (U.S.), Engineered Bonding Solutions (U.S.), and Gougeon Brothers (U.S.).
Key Target Audience:
- Manufacturers of Marine Adhesives
- Raw Material Suppliers
- Manufacturers of Marine Adhesives catering to applications such as deck systems, glazing systems, and panel bonding
- Traders, Distributors, and Suppliers of Marine Adhesives
- Regional Manufacturer Associations and General Marine Adhesives Associations
- NGOs, Governments, Investment Banks, Venture Capitalists, and Private Equity Firms
The scope of the report:
This research report categorizes the global marine adhesives market based on resin type, application, and region.
Based on Resin Type:
- Epoxy
- Polyurethane
- Acrylic
- Others
Based on Substrate Type:
- Metals
- Composites
- Plastics
- Others
Based on Vessel:
- Cargo
- Passenger
- Boats
- Others
Based on Application:
- Deck Systems
- Glazing
- Panel Bonding
- Others
Based on Region:
- Asia-Pacific
- Europe
- North America
- Middle East & Africa
- South America
Available Customizations:
Along with the given market data, MarketsandMarkets offers customizations according to the company�s specific needs. The following customization options are available for the report:
Regional Analysis:
- Country-level analysis of the marine adhesives market
Company Information:
- Detailed analysis and profiles of additional market players
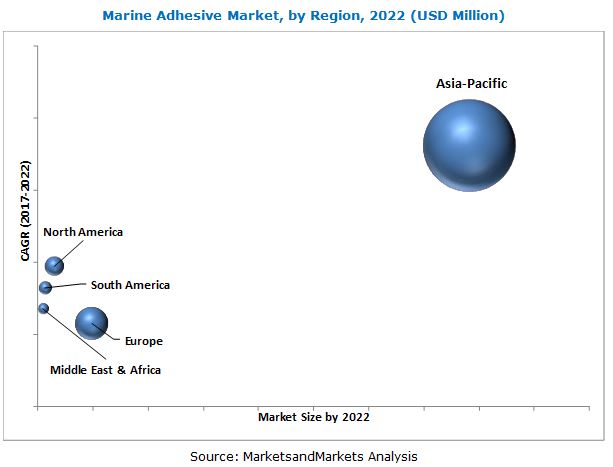
The global marine adhesives market is estimated to be USD 371.9 Million in 2017 and is projected to reach USD 466.2 Million by 2022, at a CAGR of 4.6% from 2017 to 2022. The growing demand for yachts, cruises, recreational boats, and commercial vessels have led to an increase in the demand for marine adhesives from the marine industry.
Based on vessel type, the boats segment is projected to witness the highest growth during the forecast period. In the coming years, with the increasing disposable income and rising spending on recreational and leisure activities, the population in various countries across the globe is expected to indulge in recreational boating activities. The growing coastal and maritime tourism is also expected to contribute significantly to the growth of the recreational boating market in North America and Europe. The marine adhesives market in Asia-Pacific, South America, and the Middle East & Africa is expected to witness a significant growth in the coming years.
Based on resin type, the polyurethane segment is expected to witness the highest growth during the forecast period. The growth of this segment can be attributed to the increasing use of polyurethane adhesives in the deck to hull bonding, general purpose bonding above and below the waterline, glass window bonding, wood deck caulking, bonding hatches & port lights, bonding deck hardware, and interior & exterior decorative panels. Polyurethane adhesives can be elastic or rigid, depending on the structure of thermoset or elastomer and curing technique.
The Asia-Pacific marine adhesives market is projected to witness the highest growth from 2017 to 2022, in terms of value and volume. Manufacturers of marine adhesives are targeting this region, as the marine industry in the region is the largest, globally.
The China marine adhesives market has grown rapidly in the recent years and is projected to witness high growth in the near future, due to the establishment of marine adhesive production facilities by several global manufacturers in the country. Countries such as the Philippines, Thailand, and Indonesia are making significant investments in various marine projects, which is anticipated to propel the growth of the marine adhesives market in these countries.
The growth of the marine adhesives market may be restrained by the rising environmental concerns and regulatory policies and the increasing use of eco-friendly products in various applications in several countries around the globe. Global manufacturers of marine adhesives are focusing on ensuring safety and avoiding health issues associated with VOC emissions from chemical products.
Companies such as Henkel (Germany), 3M (U.S.), Sika (Switzerland), ITW (U.S.), Huntsman (U.S.), H.B. Fuller (U.S.), Ashland (U.S.), Bostik (France), LORD Corporation (U.S.), Scott Bader (U.K.), MAPEI (Italy), Permabond (U.K.), SCIGRIP (U.S.), WEICON (Germany), Gurit (Switzerland), Master Bond (U.S.), Parson Adhesives (U.S.), Anabond (India), HYBOND (U.K.), SABA Dinxperlo (The Netherlands), Chemique Adhesives & Sealants (U.K.), Ri�d B.V. (The Netherlands), Hernon Manufacturing (U.S.), Engineered Bonding Solutions (U.S.), and Gougeon Brothers (U.S.) are the key players in the global marine adhesives market. Diverse product portfolios, strategically positioned R&D centers, adoption of varied development strategies, and technological advancements are some of the factors that have helped the companies strengthen their position in the marine adhesives market. These players have been adopting various organic and inorganic strategies to achieve growth in the market.
To speak to our analyst for a discussion on the above findings, click Speak to Analyst
 Exclusive indicates content/data unique to MarketsandMarkets and not available with any competitors.
Table of Contents
1 Introduction (Page No. - 17)
1.1 Objectives of the Study
1.2 Market Definition
1.3 Market Scope
1.3.1 Years Considered for the Study
1.4 Currency
1.5 Units Considered
1.6 Limitations
1.7 Stakeholders
2 Research Methodology (Page No. - 21)
2.1 Research Data
2.1.1 Secondary Data
2.1.1.1 Key Data From Secondary Sources
2.1.2 Primary Data
2.1.2.1 Key Data From Primary Sources
2.1.2.2 Key Industry Insights
2.1.2.3 Breakdown of Primary Interviews
2.2 Market Size Estimation
2.2.1 Bottom-Up Approach
2.2.2 Top-Down Approach
2.3 Data Triangulation
2.4 Assumptions
3 Executive Summary (Page No. - 27)
4 Premium Insights (Page No. - 32)
4.1 Attractive Opportunities for Market Players
4.2 Market Growth, By Substrate
4.3 Market Size in Key Countries
4.4 APAC Market Share, By Vessel and Country
4.5 Market Size, By Resin
4.6 Market Attractiveness
5 Market Overview (Page No. - 35)
5.1 Introduction
5.2 Market Dynamics
5.2.1 Drivers
5.2.1.1 Increasing Penetration of Adhesives Due to Increase in the Use of Composites as A Lightweight Material
5.2.1.2 Upcoming Shipbuilding Projects and Programs
5.2.2 Restraints
5.2.2.1 International Maritime Organization Environmental Regulation & Other Maritime Environmental Regulations
5.2.3 Opportunities
5.2.3.1 Expanding the Oil & Gas Exploration Industry
5.2.3.2 Increased Use of Adhesives Determined By the Construction of Multi-Material Marine Structures
5.2.4 Challenges
5.2.4.1 Increasing Demand for Sustainable Adhesives
5.3 Porter�s Five Forces Analysis
5.3.1 Threat of New Entrants
5.3.2 Threat ofSubstitutes
5.3.3 Bargaining Power of Buyers
5.3.4 Bargaining Power of Suppliers
5.3.5 Intensity of Competitive Rivalry
6 Marine Adhesives Market, By Resin (Page No. - 42)
6.1 Introduction
6.2 Epoxy
6.3 Polyurethane
6.4 Acrylic
6.5 Others
7 Marine Adhesives Market, By Substrate (Page No. - 49)
7.1 Introduction
7.2 Metals
7.3 Composites
7.4 Plastics
7.5 Others
8 Marine Adhesives Market, By Vessel (Page No. - 55)
8.1 Introduction
8.2 Cargo Ships
8.3 Passenger Ships
8.4 Boats
8.5 Others
9 Marine Adhesives Market, By Application (Page No. - 61)
9.1 Introduction
9.2 Deck System
9.3 Glazing System
9.4 Panel Bonding
9.5 Others
10 Marine Adhesives Market, By Region (Page No. - 68)
10.1 Introduction
10.2 APAC
10.2.1 Market, By Resin
10.2.2 Market, By Substrate
10.2.3 Market, By Vessel
10.2.4 Market, By Application
10.2.5 Market, By Country
10.2.5.1 South Korea
10.2.5.2 China
10.2.5.3 Japan
10.2.5.4 Philippines
10.2.5.5 Taiwan
10.2.5.6 Vietnam
10.2.5.7 Rest of APAC
10.3 North America
10.3.1 Market, By Resin
10.3.2 Market, By Substrate
10.3.3 Market, By Vessel
10.3.4 Market, By Application
10.3.5 Market, By Country
10.3.5.1 US
10.3.5.2 Rest of North America
10.4 Europe
10.4.1 Market, By Resin
10.4.2 Market, By Substrate
10.4.3 Market, By Vessel
10.4.4 Market, By Application
10.4.5 Market, By Country
10.4.5.1 Romania
10.4.5.2 Germany
10.4.5.3 Norway
10.4.5.4 Italy
10.4.5.5 France
10.4.5.6 Netherlands
10.4.5.7 Finland
10.4.5.8 Turkey
10.4.5.9 Spain
10.4.5.10 Russia
10.4.5.11 Croatia
10.4.5.12 Rest of Europe
10.5 South America
10.5.1 Market, By Resin
10.5.2 Market, By Substrate
10.5.3 Market, By Vessel
10.5.4 Market, By Application
10.5.5 Market, By Country
10.5.5.1 Brazil
10.5.5.2 Rest of South America
10.6 Middle East & Africa
10.6.1 Market, By Resin
10.6.2 Market, By Substrate
10.6.3 Market, By Vessel
10.6.4 Market, By Application
10.6.5 Market, By Country
10.6.5.1 Uae
10.6.5.2 Rest of Middle East & Africa
11 Competitive Landscape (Page No. - 106)
11.1 Overview
11.2 Market Ranking of Key Players
11.3 Competitive Situations and Trends
11.3.1 Investment & Expansion
11.3.2 Partnership & Agreement
11.3.3 New Product Development/Launch
11.3.4 Merger & Acquisition
12 Company Profiles (Page No. - 110)
12.1 Henkel
12.2 Sika
12.3 3M
12.4 Illinois Tool Works (ITW)
12.5 H.B. Fuller
12.6 Huntsman
12.7 Bostik
12.8 Ashland
12.9 LORD
12.1 Scott Bader
12.11 Gurit
12.12 Other Key Players
12.12.1 MAPEI
12.12.2 Permabond
12.12.3 SCIGRIP
12.12.4 Master Bond
12.12.5 Parson Adhesives
12.12.6 Hernon Manufacturing
12.12.7 Weicon
12.12.8 Ri�d
12.12.9 Engineered Bonding Solutions
12.12.10 HYBOND Adhesives
12.12.11 Chemique Adhesives
12.12.12 Anabond
12.12.13 SABA Dinxperlo
12.12.14 Gougeon Brothers
13 Appendix (Page No. - 132)
13.1 Insights From Industry Experts
13.2 Discussion Guide
13.3 Knowledge Store: Marketsandmarkets� Subscription Portal
13.4 Introducing RT: Real-Time Market Intelligence
13.5 Available Customizations
13.6 Related Reports
13.7 Authors Details
List of Tables (121 Tables)
Table 1 Market Snapshot (2017 vs. 2022)
Table 2 Global Passenger Snapshot for Ocean Cruise Ships (In Millions)
Table 3 New Orders to Key Countries in Shipbuilding Industry, 2016
Table 4 By Market Size, By Resin, 2015�2022 (Kiloton)
Table 5 By Market Size, By Resin, 2015�2022 (USD Million)
Table 6 Epoxy-Based Market Size, By Region, 2015�2022 (Kiloton)
Table 7 Epoxy-Based Market Size, By Region, 2015�2022 (USD Million)
Table 8 Polyurethane-Based Market Size, By Region, 2015�2022 (Kiloton)
Table 9 Polyurethane-Based Market Size, By Region, 2015�2022 (USD Million)
Table 10 Acrylic-Based Market Size, By Region, 2015�2022 (Kiloton)
Table 11 Acrylic-Based Market Size, By Region, 2015�2022 (USD Million)
Table 12 Other Resin-Based Market Size, By Region, 2015�2022 (Kiloton)
Table 13 Other Resin-Based Market Size, By Region, 2015�2022 (USD Million)
Table 14 Market Size, By Substrate, 2015�2022 (Kiloton)
Table 15 By Market Size, By Substrate, 2015�2022 (USD Million)
Table 16 Metal Market Size, By Region, 2015�2022 (Kiloton)
Table 17 Metal Market Size, By Region, 2015�2022 (USD Million)
Table 18 Composites Market Size, By Region, 2015�2022 (Kiloton)
Table 19 Composites Market Size, By Region, 2015�2022 (USD Million)
Table 20 Plastics Market Size, By Region, 2015�2022 (Kiloton)
Table 21 Plastics Market Size, By Region, 2015�2022 (USD Million)
Table 22 Other Marine Adhesives Substrates Market Size, By Region, 2015�2022 (Kiloton)
Table 23 Other Marine Adhesives Substrates Market Size, By Region, 2015�2022 (USD Million)
Table 24 By Market Size, By Vessel, 2015�2022 (Kiloton)
Table 25 By Market Size, By Vessel, 2015�2022 (USD Million)
Table 26 Cargo Ships Market Size, By Region, 2015�2022 (Kiloton)
Table 27 Cargo Ships Market Size, By Region, 2015�2022 (USD Million)
Table 28 Ocean and River Cruise Line Demand in Number, 2017-2026
Table 29 Passenger Ships Market Size, By Region, 2015�2022 (Kiloton)
Table 30 Passenger Ships Market Size, By Region, 2015�2022 (USD Million)
Table 31 Boats Market Size, By Region, 2015�2022 (Kiloton)
Table 32 Boats Market Size, By Region, 2015�2022 (USD Million)
Table 33 Other Vessels Market Size, By Region, 2015�2022 (Kiloton)
Table 34 Other Vessels Market Size, By Region, 2015�2022 (USD Million)
Table 35 By Market Size, By Application, 2015�2022 (Kiloton)
Table 36 By Market Size, By Application, 2015�2022 (USD Million)
Table 37 By Market Size in Deck System, By Region, 2015�2022 (Kiloton)
Table 38 By Market Size in Deck System, By Region, 2015�2022 (USD Million)
Table 39 By Market Size in Glazing System, By Region, 2015�2022 (Kiloton)
Table 40 By Market Size in Glazing System, By Region, 2015�2022 (USD Million)
Table 41 By Market Size in Panel Bonding, By Region, 2015�2022 (Kiloton)
Table 42 By Market Size in Panel Bonding, By Region, 2015�2022 (USD Million)
Table 43 By Market Size in Other Applications, By Region, 2015�2022 (Kiloton)
Table 44 By Market Size in Other Applications, By Region, 2015�2022 (USD Million)
Table 45 By Market Size, By Region, 2015�2022 (Kiloton)
Table 46 By Market Size, By Region, 2015�2022 (USD Million)
Table 47 APAC: Marine Adhesives Market Size, By Country, 2015�2022 (Kiloton)
Table 48 APAC: By Market Size, By Country, 2015�2022 (USD Million)
Table 49 APAC: By Market Size, By Resin, 2015�2022 (Kiloton)
Table 50 APAC: By Market Size, By Resin, 2015�2022 (USD Million)
Table 51 APAC: By Market Size, By Substrate, 2015�2022 (Kiloton)
Table 52 APAC: By Market Size, By Substrate, 2015�2022 (USD Million)
Table 53 APAC: By Market Size, By Vessel, 2015�2022 (Kiloton)
Table 54 APAC: By Market Size, By Vessel, 2015�2022 (USD Million)
Table 55 APAC: By Market Size, By Application, 2015�2022 (Kiloton)
Table 56 APAC: By Market Size, By Application, 2015�2022 (USD Million)
Table 57 South Korea: Marine Adhesives Market Size, By Resin, 2015�2022 (Kiloton)
Table 58 South Korea: By Market Size, By Resin, 2015�2022 (USD Million)
Table 59 China: Marine Adhesives Market Size, By Resin, 2015�2022 (Kiloton)
Table 60 China: By Market Size, By Resin, 2015�2022 (USD Million)
Table 61 Japan: By Market Size, By Resin, 2015�2022 (Kiloton)
Table 62 Japan: By Market Size, By Resin, 2015�2022 (USD Million)
Table 63 Philippines: By Market Size, By Resin, 2015�2022 (Kiloton)
Table 64 Philippines: By Market Size, By Resin, 2015�2022 (USD Million)
Table 65 North America: Marine Adhesives Market Size, By Country, 2015�2022 (Kiloton)
Table 66 North America: By Market Size, By Country, 2015�2022 (USD Million)
Table 67 North America: By Market Size, By Resin, 2015�2022 (Kiloton)
Table 68 North America: By Market Size, By Resin, 2015�2022 (USD Million)
Table 69 North America: By Market Size, By Substrate, 2015�2022 (Kiloton)
Table 70 North America: By Market Size, By Substrate, 2015�2022 (USD Million)
Table 71 North America: By Market Size, By Vessel, 2015�2022 (Kiloton)
Table 72 North America: By Market Size, By Vessel, 2015�2022 (USD Million)
Table 73 North America: By Market Size, By Application, 2015�2022 (Kiloton)
Table 74 North America: By Market Size, By Application, 2015�2022 (USD Million)
Table 75 US: Marine Adhesives Market Size, By Resin, 2015�2022 (Kiloton)
Table 76 US: By Market Size, By Resin, 2015�2022 (USD Million)
Table 77 Europe: By Market Size, By Country, 2015�2022 (Kiloton)
Table 78 Europe: By Market Size, By Country, 2015�2022 (USD Million)
Table 79 Europe: By Market Size, By Resin, 2015�2022 (Kiloton)
Table 80 Europe: By Market Size, By Resin, 2015�2022 (USD Million)
Table 81 Europe: By Market Size, By Substrate, 2015�2022 (Kiloton)
Table 82 Europe: By Market Size, By Substrate, 2015�2022 (USD Million)
Table 83 Europe: By Market Size, By Vessel, 2015�2022 (Kiloton)
Table 84 Europe: By Market Size, By Vessel, 2015�2022 (USD Million)
Table 85 Europe: By Market Size, By Application, 2015�2022 (Kiloton)
Table 86 Europe: By Market Size, By Application, 2015�2022 (USD Million)
Table 87 Romania: By Market Size, By Resin, 2015�2022 (Kiloton)
Table 88 Romania: By Market Size, By Resin, 2015�2022 (USD Million)
Table 89 Germany: By Market Size, By Resin, 2015�2022 (Kiloton)
Table 90 Germany: By Market Size, By Resin, 2015�2022 (USD Million)
Table 91 Norway: By Market Size, By Resin, 2015�2022 (Kiloton)
Table 92 Norway: By Market Size, By Resin, 2015�2022 (USD Million)
Table 93 Italy: By Market Size, By Resin, 2015�2022 (Kiloton)
Table 94 Italy: By Market Size, By Resin, 2015�2022 (USD Million)
Table 95 South America: By Market Size, By Country, 2015�2022 (Kiloton)
Table 96 South America: By Market Size, By Country, 2015�2022 (USD Million)
Table 97 South America: By Market Size, By Resin, 2015�2022 (Kiloton)
Table 98 South America: By Market Size, By Resin, 2015�2022 (USD Million)
Table 99 South America: By Market Size, By Substrate, 2015�2022 (Kiloton)
Table 100 South America: By Market Size, By Substrate, 2015�2022 (USD Million)
Table 101 South America: By Market Size, By Vessel, 2015�2022 (Kiloton)
Table 102 South America: By Market Size, By Vessel, 2015�2022 (USD Million)
Table 103 South America: By Market Size, By Application, 2015�2022 (Kiloton)
Table 104 South America: By Market Size, By Application, 2015�2022 (USD Million)
Table 105 Brazil: By Market Size, By Resin, 2015�2022 (Kiloton)
Table 106 Brazil: By Market Size, By Resin, 2015�2022 (USD Million)
Table 107 Middle East & Africa: By Market Size, By Country, 2015�2022 (Kiloton)
Table 108 Middle East & Africa: By Market Size, By Country, 2015�2022 (USD Million)
Table 109 Middle East & Africa: By Market Size, By Resin, 2015�2022 (Kiloton)
Table 110 Middle East & Africa: By Market Size, By Resin, 2015�2022 (USD Million)
Table 111 Middle East & Africa: By Market Size, By Substrate, 2015�2022 (Kiloton)
Table 112 Middle East & Africa: By Market Size, By Substrate, 2015�2022 (USD Million)
Table 113 Middle East & Africa: By Market Size, By Vessel, 2015�2022 (Kiloton)
Table 114 Middle East & Africa: By Market Size, By Vessel, 2015�2022 (USD Million)
Table 115 Middle East & Africa: By Market Size, By Application, 2015�2022 (Kiloton)
Table 116 Middle East & Africa: By Market Size, By Application, 2015�2022 (USD Million)
Table 117 Market Ranking of Key Players (2016)
Table 118 Investments & Expansions, 2015�September 2017
Table 119 Partnerships & Agreements, 2015 �September 2017
Table 120 New Product Developments/Launches, 2015 � September 2017
Table 121 Mergers & Acquisitions, 2015 �September 2017
List of Figures (35 Figures)
Figure 1 Market Segmentation
Figure 2 Market: Research Design
Figure 3 Market Size Estimation: Bottom-Up Approach
Figure 4 Market Size Estimation: Top-Down Approach
Figure 5 Marine Adhesives: Data Triangulation
Figure 6 Composites to Register Highest CAGR in Marine Adhesives Market During Forecast Period
Figure 7 Epoxy-Based Marine Adhesives to Register Highest CAGR During Forecast Period
Figure 8 Cargo Ships to Account for Largest Share of Marine Adhesives Market By 2022
Figure 9 Deck System to Account for Largest Share of Marine Adhesives Market By 2022
Figure 10 APAC Accounted for Largest Share of Marine Adhesives Market in 2016
Figure 11 Emerging Economies to Offer Lucrative Growth Opportunities to Key Players in Marine Adhesives Market Between 2017 and 2022
Figure 12 Composites Segment to Register the Highest CAGR Between 2017 and 2022
Figure 13 China to Be the Fastest Growing Marine Adhesives Market
Figure 14 Cargo Ships Segment Accounted for Largest Share in APAC Marine Adhesives Market in 2016
Figure 15 Epoxy Resin to Lead Marine Adhesives Market During Forecast Period
Figure 16 China to Account for the Highest CAGR in Marine Adhesives Market
Figure 17 Drivers, Restraints, Opportunities, and Challenges in Marine Adhesives Market
Figure 18 Porter�s Five Forces Analysis
Figure 19 Epoxy-Based Adhesives to Lead Marine Adhesives Market Between 2017 and 2022
Figure 20 Metal Substrates Segment to Lead Marine Adhesives Market Between 2017 and 2022
Figure 21 Cargo Ships Segment to Lead the Marine Adhesives Market, 2017�2022
Figure 22 Deck System to Register the Highest CAGR in Marine Adhesives Market
Figure 23 APAC has the Highest CAGR in Marine Adhesives Market, By Application
Figure 24 APAC Market Snapshot: South Korea is the Largest Marine Adhesives Market
Figure 25 North America Market Snapshot: US to Account for the Largest Market Share
Figure 26 Europe Market Snapshot: Romania to Account for the Largest Market Share
Figure 27 Companies Adopted Investments & Expansions as the Key Growth Strategy Between 2015 and September 2017
Figure 28 Henkel: Company Snapshot
Figure 29 Sika: Company Snapshot
Figure 30 3M: Company Snapshot
Figure 31 ITW: Company Snapshot
Figure 32 H.B. Fuller: Company Snapshot
Figure 33 Huntsman: Company Snapshot
Figure 34 Ashland: Company Snapshot
Figure 35 Gurit: Company Snapshot


Growth opportunities and latent adjacency in Marine Adhesives Market