Composite Adhesives Market by Resin (Epoxy, Polyurethane), Component (One-Component, Two-Component), Application (Automotive & Transportation, Marine, Aerospace, Wind Energy), and Region - Global Forecast to 2022


The composite adhesives market is projected to reach USD 1.78 Billion by 2022, at a CAGR of 7.9%. The market is driven by the pent-up demand for composite adhesives from end-use industries, specifically automotive & transportation, wind energy, and aerospace industries.
The years considered for the study include:
Base Year: 2016
Forecast Period: 2017–2022
Objectives of the Composite Adhesives Market Study
- To define, describe, and forecast the composite adhesives market on the basis of resin, component, application, and region
- To provide detailed information regarding the key factors influencing the growth of the market (drivers, restraints, opportunities, and challenges)
- To strategically analyze micromarkets with respect to individual growth trends, prospects, and contribution to the overall market
- To analyze the opportunities in the market for stakeholders and provide a competitive landscape of the market
- To strategically profile key players and comprehensively analyze their market shares and core competencies
Both top-down and bottom-up approaches have been used to estimate and validate the size of the overall composite adhesives market and estimate the sizes of various other dependent submarkets. The research study involved extensive use of secondary sources, directories, and databases such as, Hoovers, Bloomberg, Chemical Weekly, Factiva, ICIS, and Securities and Exchange Commission (SEC), among other government and private websites to identify and collect information useful for the technical, market-oriented, and commercial study of the global composite adhesives market.
To know about the assumptions considered for the study, download the pdf brochure
Composite adhesives are manufactured from various raw materials such as, different resins (epoxy, polyurethane, and others), and additives (pigments and tackifire). BASF SE (Germany), 3M Company (U.S.), Huntsman Corporation (U.S.), ExxonMobil Corporation (U.S.), and The Dow Chemical Company (U.S.) are the major raw material providers. These raw materials are supplied to the major manufacturers of composite adhesives such as,Henkel AG & Co. KGaA (Germany), SIKA AG (Switzerland), 3M Company (U.S.), The Dow Chemical Company (U.S.), Huntsman Corporation (U.S.), LORD Corporation (U.S.), and Illinois Tool Works Incorporation-Plexus (U.S.).
Key Target Audience in Composite Adhesives Market
- Manufacturers of Composite Adhesives
- Traders, Distributors, and Suppliers of Composite Adhesives
- Government and Regional Agencies and Research Organizations
- Investment Research Firms
Composite Adhesives Market Report Scope
This research report categorizes the global composite adhesives market on the basis of type, application, and region.
On the Basis of Resin:
- Epoxy
- Polyurethane
- Others
On the Basis of Component:
- One-Component
- Two-Component
On the Basis of Application:
- Automotive & Transportation
- Marine
- Wind Energy
- Aerospace
- Others
On the Basis of Region:
- North America
- Europe
- Asia-Pacific
- Middle East & Africa
- South America
The market is further analyzed on the basis of key countries in each of these regions.
Composite Adhesives Market Report Available Customizations
Along with the market data, MarketsandMarkets offers customizations according to the specific needs of the company. The following customization options are available for the report:
Composite Adhesives Market Regional Analysis:
- Country-level analysis of the global composite adhesives market, by resin and application
Composite Adhesives Market Company Information:
- Detailed analysis and profiles of additional market players
The global composite adhesives market is projected to reach USD 1.78 Billion by 2022, at a CAGR of 7.9% from 2017 to 2022. The growing use of composite adhesives in automotive & transportation, marine, and aerospace industries is driving the market for composite adhesives. The use of composites in the wind energy industry in the last few years has also driven the growth of the composite adhesives market.
Automotive & transportation is the largest application segment of composite adhesives worldwide. The increasing use of adhesives in the aftermarket of automobile & transportation industry has been increasing, as the use of adhesives provides better performance and appearance as compared to the use of mechanical fasteners and welds. Weight reduction, improved crash & impact resistance, emission reduction control, and enhanced efficiency are the major upgrades which the automotive & transportation industry is endeavoring to achieve. Composites play a significant role in meeting almost all of these requirements and thus, are pushing the demand for composite adhesives.
On the basis of resin type, the composite adhesives market has been segmented into epoxy, polyurethane, and others. Epoxy is projected to be the largest and fastest-growing resin type segment of the composite adhesives market from 2017 to 2022. The major driver for the epoxy segment is its increasing use in wind blade composites bonding and aircraft. This segment is also boosted by the increasing use of fiber-reinforced materials for fabricating components for rail, automotive, wind energy, marine, and building & construction applications.
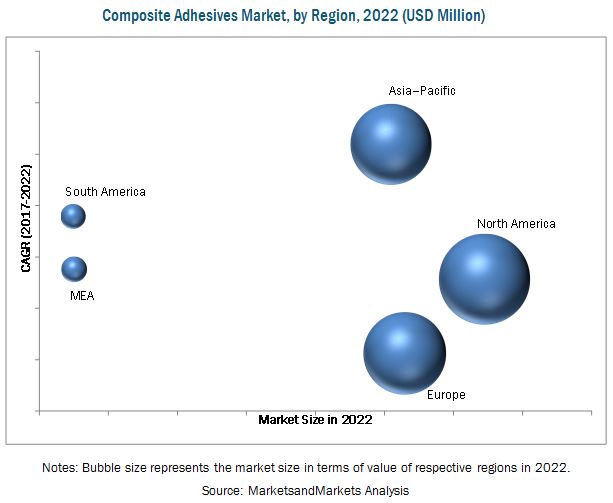
North America, Europe, Asia-Pacific, South America, and Middle East & Africa are considered the main regions for the composite adhesives market. The North America region leads the composite adhesives market, in terms of both value and volume, owing to the increased demand for green and renewable energy as well as aircraft, and the advancing automotive sector. The rising demand for high-quality composite adhesives products with superior properties has triggered the demand for composite adhesives. Increasing composite applications are also contributing to the growing demand for composite adhesives in the North America region.
Increasing demand for lightweight vehicles, renewable energy, and advanced aircraft solutions for aerospace industry are expected to lead to the growth of the composite adhesives market in the coming years. On the contrary, environmental regulations and unstable economic cycles are the major restraints for the composite adhesives market.
Key Players in Composite Adhesives Market Industry
The global composite adhesives market is led by companies such as, Henkel AG & Co. KGaA (Germany), SIKA AG (Switzerland), 3M Company (U.S.), The Dow Chemical Company (U.S.), Huntsman Corporation (U.S.), LORD Corporation (U.S.), and Illinois Tool Works Incorporation-Plexus (U.S.). Diverse product portfolios, strategically positioned R&D centers, adoption of development strategies, and technological advancements have helped these companies strengthen their position in the composite adhesives market. These companies are adopting various organic and inorganic growth strategies, such as expansions, partnerships, and new product launches to enhance their market share.
To speak to our analyst for a discussion on the above findings, click Speak to Analyst
 Exclusive indicates content/data unique to MarketsandMarkets and not available with any competitors.
Table of Contents
1 Introduction (Page No. - 16)
1.1 Objectives of the Study
1.2 Market Definition
1.3 Market Scope
1.3.1 Years Considered for the Study
1.4 Currency
1.5 Package Size
1.6 Limitations
1.7 Stakeholders
2 Research Methodology (Page No. - 19)
2.1 Research Data
2.1.1 Secondary Data
2.1.1.1 Key Data From Secondary Sources
2.1.2 Primary Data
2.1.2.1 Key Data From Primary Sources
2.1.2.2 Key Industry Insights
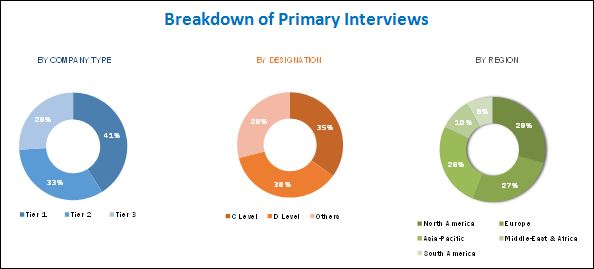
2.1.2.3 Breakdown of Primary Interviews
2.2 Market Size Estimation
2.2.1 Bottom-Up Approach
2.2.2 Top-Down Approach
2.3 Data Triangulation
2.4 Assumptions
3 Executive Summary (Page No. - 28)
4 Premium Insights (Page No. - 33)
4.1 Attractive Opportunities for Market Players
4.2 Composite Adhesives Market, By Component
4.3 Composite Adhesives Market: Developed vs Emerging Nations
4.4 North America Composite Adhesives Market
4.5 Asia-Pacific Composite Adhesives Market
4.6 Global Composite Adhesives Market
5 Market Overview (Page No. - 37)
5.1 Introduction
5.2 Market Dynamics
5.2.1 Drivers
5.2.1.1 Increasing Demand for Lightweight and Low Carbon Emitting Vehicles
5.2.1.2 Growing Demand for Composite Adhesives in End-Use Industries Such as Construction
5.2.1.3 Growing Demand for Wind Turbines to Harness Wind Energy
5.2.1.4 Increasing Delivery of New Aircraft
5.2.2 Restraints
5.2.2.1 Environmental Regulations in North American and European Countries
5.2.3 Opportunities
5.2.3.1 Growing Demand for Low VOC, Green, and Sustainable Adhesives
5.2.3.2 Rising Government Spending on End-Use Industries
5.2.4 Challenges
5.2.4.1 Limited Market Opportunities in Developed Countries
5.2.4.2 Unstable Economic Cycles
5.3 Porter’s Five Forces Analysis
5.3.1 Intensity of Competitive Rivalry
5.3.2 Bargaining Power of Buyers
5.3.3 Bargaining Power of Suppliers
5.3.4 Threat of Substitutes
5.3.5 Threat of New Entrants
5.4 Macroeconomic Indicators
5.4.1 Trends and Forecast of GDP
5.4.2 Trends and Forecast of the Construction Industry
5.4.2.1 Trends and Forecast of the Construction Industry in North America
5.4.2.2 Trends and Forecast of the Construction Industry in Europe
5.4.2.3 Trends and Forecast of the Construction Industry in Asia-Pacific
5.4.2.4 Trends and Forecast of the Construction Industry in the Middle East & Africa
5.4.2.5 Trends and Forecast of the Construction Industry in South America
5.4.3 Trends of the Automotive Industry
5.4.4 Trends and Forecast of the Wind Energy Industry
5.4.5 Trends and Forecast of the Aerospace Industry
6 Composite Adhesives Market, By Component (Page No. - 53)
6.1 Introduction
6.2 One-Component Composite Adhesives
6.3 Two-Component Composite Adhesives
7 Composite Adhesives Market, By Resin (Page No. - 58)
7.1 Introduction
7.2 Epoxy
7.3 Polyurethane
7.4 Others
8 Composite Adhesives Market, By Application (Page No. - 65)
8.1 Introduction
8.2 Automotive & Transportation
8.3 Aerospace
8.4 Wind Energy
8.5 Marine
8.6 Others
9 Composite Adhesives, By Region (Page No. - 75)
9.1 Introduction
9.2 Asia-Pacific
9.2.1 Composite Adhesives Market, By Resin
9.2.2 Market, By Component
9.2.3 Market, By Application
9.2.4 Market, By Country
9.2.4.1 China
9.2.4.2 Japan
9.2.4.3 India
9.2.4.4 South Korea
9.2.4.5 Taiwan
9.2.4.6 Malaysia
9.2.4.7 Thailand
9.2.4.8 Vietnam
9.2.4.9 Rest of Asia-Pacific
9.3 North America
9.3.1 Composite Adhesives Market, By Resin
9.3.2 Market, By Component
9.3.3 Market, By Application
9.3.4 Market,By Country
9.3.4.1 U.S.
9.3.4.2 Canada
9.3.4.3 Mexico
9.4 Europe
9.4.1 Composite Adhesives Market,By Resin
9.4.2 Market, By Component
9.4.3 Market, By Application
9.4.4 Market,By Country
9.4.4.1 Germany
9.4.4.2 France
9.4.4.3 Italy
9.4.4.4 U.K.
9.4.4.5 Turkey
9.4.4.6 Spain
9.4.4.7 Rest of Europe
9.5 South America
9.5.1 Composite Adhesives Market,By Resin
9.5.2 Market, By Component
9.5.3 Market,By Application
9.5.4 Market,By Country
9.5.4.1 Brazil
9.5.4.2 Argentina
9.5.4.3 Rest of South America
9.6 Middle East & Africa
9.6.1 Composite Adhesives Market, By Resin
9.6.2 Market, By Component
9.6.3 Market, By Application
9.6.4 Market, By Country
9.6.4.1 UAE
9.6.4.2 Africa
9.6.4.3 Rest of Middle East
10 Competitive Landscape (Page No. - 114)
10.1 Introduction
10.2 Dive Matrix Analysis
10.2.1 Dynamic
10.2.2 Innovator
10.2.3 Vanguard
10.2.4 Emerging
10.3 Competitive Benchmarking
10.3.1 Products Offering Scorecard
10.3.2 Business Strategy Scorecard
11 Company Profiles (Page No. - 118)
(Overview, Financial*, Products & Services, Strategy, and Developments)
11.1 Henkel AG & Co. KGaA
11.2 Sika AG
11.3 3M Company
11.4 The DOW Chemical Company
11.5 Huntsman Corporation
11.6 Lord Corporation
11.7 Illinois Tool Works Incorporation
11.8 Ashland Inc.
11.9 Bostik
11.10 H.B. Fuller
11.11 Hexcel Corporation
11.12 Gurit Holdings AG
11.13 Scott Bader Company Ltd.
11.14 Royal Adhesives & Sealants, LLC
11.15 Scigrip
11.16 Permabond LLC.
11.17 Master Bond Inc.
11.18 Parson Adhesives, Inc.
11.19 Engineered Bonding Solutions, LLC
11.20 L&L Products
11.21 Delo Industrial Adhesives, LLC
11.22 Dymax Corporation
11.23 Hernon Manufacturing, Inc.
11.24 Loxeal Engineering Adhesives
11.25 Hybond Adhesives
*Details Might Not Be Captured in Case of Unlisted Companies.
12 Appendix (Page No. - 170)
12.1 Key Insights From Industry Experts
12.2 Discussion Guide
12.3 Knowledge Store: Marketsandmarkets Subscription Portal
12.4 Introducing RT: Real-Time Market Intelligence
12.5 Available Customizations
12.6 Related Reports
12.7 Author Details
List of Tables (104 Tables)
Table 1 Composite Adhesives Market Snapshot (2017 & 2022)
Table 2 Trends and Forecast of GDP, 2015–2021 (USD Billion)
Table 3 Contribution of the Construction Industry to the GDP of North America, 2014-2021 (USD Billion)
Table 4 Contribution of the Construction Industry to the GDP of Europe, 2014-2021 (USD Billion)
Table 5 Contribution of the Construction Industry to the GDP of Asia-Pacific, 2014-2021 (USD Billion)
Table 6 Contribution of the Construction Industry to the GDP of the Middle East & Africa, 2014-2021 (USD Billion)
Table 7 Contribution of the Construction Industry to the GDP of South America, 2014-2021 (USD Billion)
Table 8 Automotive Production, 2012-2016 (Million Units)
Table 9 Wind Energy Installations, 2012-2016 (MW)
Table 10 Wind Energy Installations, 2017-2021 (GW)
Table 11 Growth Indicators of Aerospace Industry, 2015-2033
Table 12 Growth Indicators of Aerospace Industry, By Region, 2015-2033
Table 13 New Airplane Deliveries, By Region, 2015-2033
Table 14 Indicators Remain Encouraging for the Aeropsace Inustry
Table 15 Composite Adhesives Market Size, By Component, 2015–2022 (USD Million)
Table 16 Composite Adhesives Market Size, By Component, 2015–2022 (Kiloton)
Table 17 One-Component Composite Adhesives Market Size, By Region, 2015–2022 (USD Million)
Table 18 One-Component Composite Adhesives Market Size, By Region, 2015–2022 (Kiloton)
Table 19 Two-Component Composite Adhesives Market Size, By Region, 2015–2022 (USD Million)
Table 20 Two-Component Composite Adhesives Market Size, By Region, 2015–2022 (Kiloton)
Table 21 Composite Adhesives Market Size, By Resin, 2015-2022 (USD Million)
Table 22 Composite Adhesives Market Size, By Resin, 2015-2022 (Kiloton)
Table 23 Epoxy Composite Adhesives Market Size, By Region, 2015-2022 (USD Million)
Table 24 Epoxy Composite Adhesives Market Size, By Region, 2015-2022 (Kiloton)
Table 25 Polyurethane Composite Adhesives Market Size, By Region, 2015-2022 (USD Million)
Table 26 Polyurethane Composite Adhesives Market Size, By Region, 2015-2022 (Kiloton)
Table 27 Others Composite Adhesives Market Size, By Region, 2015-2022 (USD Million)
Table 28 Others Composite Adhesives Market Size, By Region, 2015-2022 (Kiloton)
Table 29 Composite Adhesives Market Size, By Application, 2015-2022 (USD Million)
Table 30 By Market Size, By Application, 2015-2022 (Kiloton)
Table 31 By Market in Automotive & Transportation, By Region, 2015-2022 (USD Million)
Table 32 By Market in Automotive & Transportation, By Region, 2015-2022 (Kiloton)
Table 33 By Market in Aerospace, By Region, 2015-2022 (USD Million)
Table 34 By Market in Aerospace, By Region, 2015-2022 (Kiloton)
Table 35 By Market in Wind Energy, By Region, 2015-2022 (USD Million)
Table 36 By Market in Wind Energy, By Region, 2015-2022 (Kiloton)
Table 37 By Market in Marine, By Region, 2015-2022 (USD Million)
Table 38 By Market in Marine, By Region, 2015-2022 (Kiloton)
Table 39 By Market in Others, By Region, 2015-2022 (USD Million)
Table 40 By Market in Others, By Region, 2015-2022 (Kiloton)
Table 41 By Market Size, By Region, 2015–2022 (USD Million)
Table 42 By Market Size, By Region, 2015–2022 (Kiloton)
Table 43 Asia-Pacific By Market Size, By Country, 2015–2022 (USD Million)
Table 44 Asia-Pacific By Market Size, By Country, 2015–2022 (Kiloton)
Table 45 Asia-Pacific: By Market Size, By Resin, 2015–2022 (USD Million)
Table 46 Asia-Pacific: By Market Size, By Resin, 2015–2022 (Kiloton)
Table 47 Asia-Pacific: By Market Size, By Component, 2015–2022 (USD Million)
Table 48 Asia-Pacific: By Market Size, By Component, 2015–2022 (Kiloton)
Table 49 Asia-Pacific: By Market Size, By Application, 2015–2022 (USD Million)
Table 50 Asia-Pacific: By Market Size, By Application, 2015–2022 (Kiloton)
Table 51 China: By Market Size, By Application, 2015–2022 (USD Million)
Table 52 China: By Market Size, By Application, 2015–2022 (Kiloton)
Table 53 Japan: By Market Size, By Application, 2015–2022 (USD Million)
Table 54 Japan: By Market Size, By Application, 2015–2022 (Kiloton)
Table 55 India: By Market Size, By Application, 2015–2022 (USD Million)
Table 56 India: By Market Size, By Application, 2015–2022 (Kiloton)
Table 57 North America: By Market Size, By Country, 2015–2022 (USD Million)
Table 58 North America: By Market Size, By Country, 2015–2022 (Kiloton)
Table 59 North America: By Market Size, By Resin, 2015–2022 (USD Million)
Table 60 North America: By Market Size, By Resin, 2015–2022 (Kiloton)
Table 61 North America: By Market Size, By Component, 2015–2022 (USD Million)
Table 62 North America: By Market Size, By Component, 2015–2022 (Kiloton)
Table 63 North America: By Market Size, By Application, 2015–2022 (USD Million)
Table 64 North America: By Market Size, By Application, 2015–2022 (Kiloton)
Table 65 U.S.: By Market Size, By Application, 2015–2022 (USD Million)
Table 66 U.S.: By Market Size, By Application, 2015–2022 (Kiloton)
Table 67 Canada: By Market Size, By Application, 2015–2022 (USD Million)
Table 68 Canada: By Market Size, By Application, 2015–2022 (Kiloton)
Table 69 Mexico: By Market Size, By Application, 2015–2022 (USD Million)
Table 70 Mexico: By Market Size, By Application, 2015–2022 (Kiloton)
Table 71 Europe: By Market Size, By Country, 2015–2022 (USD Million)
Table 72 Europe By Market Size, By Country, 2015–2022 (Kiloton)
Table 73 Europe: By Market Size, By Resin, 2015–2022 (USD Million)
Table 74 Europe By Market Size, By Resin, 2015–2022 (Kiloton)
Table 75 Europe: By Market Size, By Component, 2015–2022 (USD Million)
Table 76 Europe: By Market Size, By Component, 2015–2022 (Kiloton)
Table 77 Europe: By Market Size, By Application, 2015–2022 (USD Million)
Table 78 Europe: By Market Size, By Application, 2015–2022 (Kiloton)
Table 79 Germany: By Market Size, By Application, 2015–2022 (USD Million)
Table 80 Germany: By Market Size, By Application, 2015–2022 (Kiloton)
Table 81 France: By Market Size, By Application, 2015–2022 (USD Million)
Table 82 France: By Market Size, By Application, 2015–2022 (Kiloton)
Table 83 Italy: By Market Size, By Application, 2015–2022 (USD Million)
Table 84 Italy: By Market Size, By Application, 2015–2022 (Kiloton)
Table 85 U.K.: By Market Size, By Application, 2015–2022 (USD Million)
Table 86 U.K.: By Market Size, By Application, 2015–2022 (Kiloton)
Table 87 South America: By Market Size, By Country, 2015–2022 (USD Million)
Table 88 South America: By Market Size, By Country, 2015–2022 (Kiloton)
Table 89 South America: By Market Size, By Resin, 2015–2022 (USD Million)
Table 90 South America: By Market Size, By Resin, 2015–2022 (Kiloton)
Table 91 South America: By Market Size, By Component, 2015–2022 (USD Million)
Table 92 South America: By Market Size, By Component, 2015–2022 (Kiloton)
Table 93 South America: By Market Size, By Application, 2015–2022 (USD Million)
Table 94 South America: By Market Size, By Application, 2015–2022 (Kiloton)
Table 95 Brazil: By Market Size, By Application, 2015–2022 (USD Million)
Table 96 Brazil: By Market Size, By Application, 2015–2022 (Kiloton)
Table 97 Middle East & Africa: By Market Size, By Country, 2015–2022 (USD Million)
Table 98 Middle East & Africa: By Market Size, By Country, 2015–2022 (Kiloton)
Table 99 Middle East & Africa: By Market Size, By Resin, 2015–2022 (USD Million)
Table 100 Middle East & Africa: By Market Size, By Resin, 2015–2022 (Kiloton)
Table 101 Middle East & Africa: By Market Size, By Component, 2015–2022 (Kiloton)
Table 102 Middle East & Africa: By Market Size, By Component, 2015–2022 (Kiloton)
Table 103 Middle East & Africa: By Market Size, By Application, 2015–2022 (USD Million)
Table 104 Middle East & Africa: By Market Size, By Application, 2015–2022 (Kiloton)
List of Figures (39 Figures)
Figure 1 Composite Adhesives Market Segmentation
Figure 2 Composite Adhesives Market: Research Design
Figure 3 Market Size Estimation: Bottom-Up Approach
Figure 4 Market Size Estimation: Top-Down Approach
Figure 5 Composite Adhesive: Data Triangulation
Figure 6 Assumptions of the Research Study
Figure 7 North America is Projected to Lead the Composite Adhesives Market Between 2017 and 2022
Figure 8 The Two-Component Segment is Projected to Lead the Composite Adhesives Market During the Forecast Period
Figure 9 Asia-Pacific is the Fastest-Growing Composite Adhesives Market Between 2017 and 2022
Figure 10 Emerging Economies Will Offer Lucrative Growth Opportunities for Key Players in the Composite Adhesives Market
Figure 11 The One-Component Segment of the Composite Adhesives Market is Projected to Grow at the Highest CAGR Between 2017 and 2022
Figure 12 The Composite Adhesives Market in Emerging Countries is Projected to Grow at Higher Growth Rates as Compared to Developed Countries
Figure 13 The Automotive & Transportation Segment Accounted for the Largest Share of the North America Composite Adhesives Market in 2016
Figure 14 The Composite Adhesives Market in China is Projected to Grow at the Highest CAGR During the Forecast Period
Figure 15 U.S. and China Accounted for the Largest Shares of the Composite Adhesives Market in 2016
Figure 16 Drivers, Restraints, Opportunities, and Challenges of the Composite Adhesives Market
Figure 17 Porter’s Five Forces Analysis
Figure 18 Market Forecast Data for Wind Energy Installed Capacity, 2017–2021 (GW)
Figure 19 World Fleet Production, By Manufacturer
Figure 20 North America to Lead the Composite Adhesives Market in 2017
Figure 21 Epoxy Segment is Estimated to Lead the Market for Composite Adhesives in 2017
Figure 22 Automotive & Transportation Segment Expected to Lead the Composite Adhesives Market By 2022
Figure 23 Aerospace Segment is Projected to Grow at the Highest CAGR During the Forecast Period
Figure 24 Vehicle Production, 2013-2016 (Million Units)
Figure 25 India and China are Emerging as Lucrative Markets for Composite Adhesives
Figure 26 Asia-Pacific is Lucrative Markets for Composite Adhesives
Figure 27 Asia-Pacific Composite Adhesives Market Snapshot
Figure 28 North America Composite Adhesives Market Snapshot
Figure 29 Dive Chart
Figure 30 Henkel AG & Co. KGaA: Company Snapshot
Figure 31 Sika AG: Company Snapshot
Figure 32 3M Company: Company Snapshot
Figure 33 The DOW Chemical Company: Company Snapshot
Figure 34 Huntsman Corporation: Company Snapshot
Figure 35 Illinois Tool Works Incorporation: Company Snapshot
Figure 36 Ashland Inc.: Company Snapshot
Figure 37 H.B. Fuller: Company Snapshot
Figure 38 Hexcel Corporation: Company Snapshot
Figure 39 Gurit Holdings AG: Company Snapshot


Growth opportunities and latent adjacency in Composite Adhesives Market