Medical Waste Management Market

Medical Waste Management Market by Service (Collection, Treatment, Disposal, Incineration, Recycling), Type of Waste (Non-hazardous, Infectious, Pharmaceutical), Treatment Site (Offsite, Onsite), Waste Generator (Hospital, Labs) & Region - Global Forecast to 2028

Report Code: MD 3644 Mar, 2024, by marketsandmarkets.com

Medical waste management market is projected to reach USD 12.2 billion by 2028 from USD 9.2 billion in 2023, at the CAGR of 5.9%. The increase in investments by research centers, increased number of hospitals, research laboratiories, diagnostic laboratories generating a huge amount of medical waste, improving focus on reducing the medical waste and proper management of medical waste has expected to increase the medical waste management market. Moreover the advancements in the medical waste management technologies like incineration, auto cloaving and rising demand of these technologies combined with stringent government regulations for the disposal of medical waste in various countries for controlling the spread of infections and growing focus on the hazardous impact of medical waste on the environment will also support the growth of this market.

Medical Waste Management Market Size, Dynamics & Ecosystem
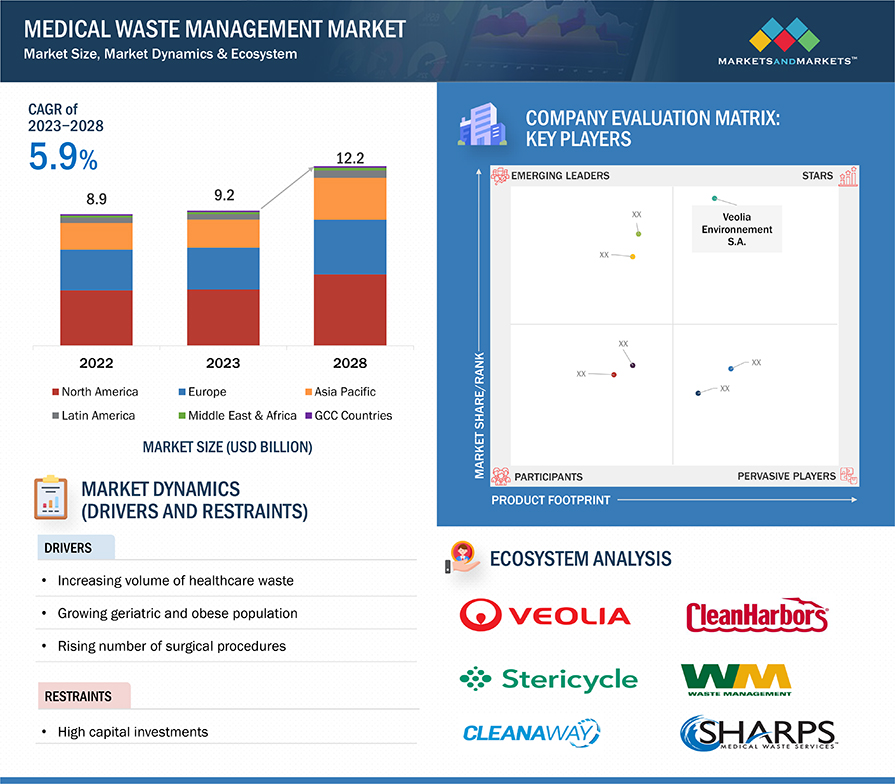
Medical Waste Management Market Size, Dynamics & Ecosystem

To know about the assumptions considered for the study, Request for Free Sample Report

Medical Waste Management Market Dynamics

DRIVER: Increasing volume of healthcare waste

The medical waste management market has experienced substantial growth due to the expansion of the healthcare industry. This growth is attributed to the rising demand for healthcare services worldwide, which has led to an increase in the number of hospitals, laboratories, research centers, mortuaries, autopsy centers, blood banks, and related collection activities. As these healthcare facilities expand their operations to meet the growing needs of patients, there is a parallel increase in the generation of medical waste. Consequently, there is a heightened demand for efficient medical waste management solutions to handle the larger volumes of waste produced. This trend underscores the critical importance of effective waste management practices within the healthcare sector to ensure public health and environmental safety.

RESTRAINT: High capital investment

Hospitals, healthcare institutions, and pharmaceutical companies face substantial capital requirements for effectively managing the collection and processing of waste in a manner that minimizes environmental pollution. This includes both hazardous and non-hazardous waste, for which advanced technologies and significant investments are necessary for proper disposal. These entities must allocate resources towards implementing sophisticated waste management systems to ensure compliance with environmental regulations and mitigate the impact on ecosystems. Such investments are crucial not only for meeting regulatory standards but also for safeguarding public health and preserving environmental integrity. Therefore, there is a pressing need for these organizations to prioritize substantial financial commitments towards adopting sustainable waste management practices that prioritize environmental sustainability and community well-being.

OPPORTUNITY: Increasing number of awareness programs for medical waste management in developed countries

In developed nations such as the US and UK, there has been a notable rise in initiatives aimed at promoting awareness regarding proper medical waste management and the prevention of mishandling. This surge includes the organization of awareness programs and conferences dedicated to educating stakeholders about the importance of effectively managing medical waste. These initiatives aim to highlight the potential risks associated with improper disposal practices and emphasize the need for adherence to established protocols and guidelines. By increasing awareness among healthcare professionals, policymakers, and the general public, these efforts seek to foster a culture of responsible waste management practices. Ultimately, the goal is to mitigate environmental harm, protect public health, and enhance overall sustainability within these nations' healthcare systems.

CHALLENGE: Lack of awareness about medical waste management in developing countries

In developing countries, effective medical waste management necessitates both heightened awareness and significant capital investment. However, these countries encounter challenges due to a shortage of focused and stringent regulations governing the medical waste management market. Additionally, limited financial resources hinder the adoption of advanced technologies and the establishment of medical waste treatment facilities. As a result, many healthcare facilities in these regions struggle to implement proper waste management practices, leading to environmental pollution and public health risks. Addressing these issues requires not only raising awareness about the importance of responsible waste management but also facilitating access to funding and support for the implementation of appropriate technologies and infrastructure. Efforts to strengthen regulatory frameworks and enhance financial assistance can play a crucial role in improving medical waste management practices in developing countries, thereby safeguarding both the environment and public health.

Medical Waste Management Market Segmentation & Geographical Spread

Medical Waste Management Market Segmentation & Geographical Spread

To know about the assumptions considered for the study, download the pdf brochure

In 2022, collection, transportation and storage services segment accounted for the largest share of the medical waste management industry, by services.

Based on services, medical waste management market is segmented into collection, transportation and storage services, treatment & disposal services and recycling services. In 2022, collection , transportation and storage services held the second highest CAGR. The growth rate of this market can be attributed to the improved public and government perception on the importance of medical waste management and healthcare cost reduction by appropriate disposal of waste.

In 2022, non-hazardous waste segment accounted for the largest share of the medical waste management industry, by type of waste segment

The medical waste management market is segmented into non-hazardous waste and hazardous waste based on type of waste. In 2022, the non-hazardous waste segment accounted for the largest share. Factors such as increased number of healthcare procedures related to chronic diseases as well as burns and accidents and rising economic developments along with improved healthcare facilities and infrastructure and revised regulatory guidelines for waste management leads to market growth.

In 2022, offsite treatment segment accounted for the largest share in the medical waste management industry, by treatment site

Based on treatment site, the medical waste management market is divided into offsite treatment and onsite treatment. Offsite treatmemt segment held the highest market share in 2022. Understanding the waste to energy opportunities during by waste management and increased collaboration between the healthcare facilities and medical waste management services for addressing complex medical waste management are the factors contributing to the growt of this market.

Hospital & diagnostic laboratories segment accounted for the largest share in the medical waste management industry in 2022, by waste generator

The medical waste management market is divided into hospitals & diagnostic laboratories and other waste generators based on waste generator. The hospital & diagnostic laboratories accounted for the highest market share along with highest growth rate in 2022. Increasing number of awareness programs and conferences for new technologies and practices for medical waste management in developed as well as developing countries is driving the growth of this segment.

North America is the largest regional market for medical waste management industry

Based on region, the medical waste management market is divided into mainly six regions – North America, Europe, the Asia Pacific, Latin America, Middle East & Africa and GCC Countries. North America held the largest market share of the market in 2022 and the Asia Pacific is estimated to have highest growth rate. The North American market's growth can be attributed to the advancements of the healthcare industry and rising healthcare expenditure. Wheres there is a lot of improvement in the healthcare facilities in the Asia Pacific regions along with increased medical tourism leading to the higher growth rate.

The major players in this market are:

Veolia Environnement S.A. (France), Clean Harbors, Inc. (US), Stericycle Inc. (US), Waste Management, Inc. (US), Cleanaway Waste Management Limited (Australia), among others.

These players' market leadership arises from their extensive service ranges and wide-reaching global presence. These dominant entities enjoy various advantages such as robust marketing and distribution networks, sizable research and development budgets, and firmly established brand recognition.

Scope of the Medical Waste Management Industry

Report Metric

Details

Market Revenue in 2023

$9.2 billion

Projected Revenue by 2028

$12.2 billion

Revenue Rate

Poised to Grow at a CAGR of 5.9%

Market Driver

Increasing volume of healthcare waste

Market Opportunity

Increasing number of awareness programs for medical waste management in developed countries

This report categorizes the medical waste management market to forecast revenue and analyze trends in each of the following submarkets:

By Service

  • Collection, transport and storage services
  • Treatment & disposal services
  • Recycling services

By Type of Waste

  • Non-hazardous Waste
  • Hazardous Waste

By Treatment Site

  • Offsite Treatment
  • Onsite Treatment

By Waste Generator

  • Hospital & diagnostic laboratories
  • Other waste generator

By Region

  • North America
    • US
    • Canada
  • Europe
    • Germany
    • UK
    • France
    • Italy
    • Spain
    • Rest of Europe
  • Asia Pacific
    • China
    • Japan
    • India
    • Rest of Asia Pacific
  • Latin America
  • Middle East & Africa
  • GCC Countries

Recent Developments of Medical Waste Management Industry:

  • In December 2021, the Veolia Environnement S.A. launched the Vigie COVID-19 solution, which can track signs of the Omicron variant in wastewater, acting as an early warning system for monitoring the progression of the pandemic.
  • In May 2022, Veolia Environnement S.A. acquired Suez Environnement. The companies signed an agreement for the acquisition of all of the hazardous waste assets in France to address the European Commission competition concerns made by Veolia.
  • In October 2020, Waste Management, Inc. acquired Advanced Disposal. This acquisition expanded Waste Management’s footprint and provided access to sustainable waste management and recycling services for customers in the US.

Frequently Asked Questions (FAQ):

To speak to our analyst for a discussion on the above findings, click Speak to Analyst

TABLE OF CONTENTS
 
1 INTRODUCTION
2 RESEARCH METHODOLOGY
3 EXECUTIVE SUMMARY
 
4 PREMIUM INSIGHTS (Page No. - 45)
    4.1 MEDICAL WASTE MANAGEMENT MARKET OVERVIEW 
    4.2 MEDICAL WASTE MANAGEMENT MARKET SHARE, BY SERVICE, 2023 VS. 2028 
    4.3 MEDICAL WASTE MANAGEMENT MARKET SHARE, BY TYPE OF WASTE, 2023 VS. 2028 
    4.4 MEDICAL WASTE MANAGEMENT MARKET SHARE, BY TREATMENT SITE, 2023 VS. 2028 
    4.5 MEDICAL WASTE MANAGEMENT MARKET SHARE, BY WASTE GENERATOR, 2023 VS. 2028 
    4.6 MEDICAL WASTE MANAGEMENT MARKET: GEOGRAPHIC GROWTH OPPORTUNITIES 
 
5 MARKET OVERVIEW (Page No. - 49)
    5.1 INTRODUCTION 
    5.2 MARKET DYNAMICS 
           5.2.1 DRIVERS
                    5.2.1.1 Increasing volume of healthcare waste
                    5.2.1.2 Growing geriatric and obese population
                    5.2.1.3 Rising number of surgical procedures
           5.2.2 RESTRAINTS
                    5.2.2.1 High capital investments
           5.2.3 OPPORTUNITIES
                    5.2.3.1 Increasing medical waste awareness programs in developed countries
                    5.2.3.2 Rising adoption of single-use medical nonwovens and devices
           5.2.4 CHALLENGES
                    5.2.4.1 Lack of awareness in developing economies
    5.3 PATENT ANALYSIS 
    5.4 TRADE ANALYSIS 
           5.4.1 TRADE ANALYSIS FOR INCINERATORS
    5.5 VALUE CHAIN ANALYSIS 
    5.6 SUPPLY CHAIN ANALYSIS 
    5.7 ECOSYSTEM ANALYSIS 
    5.8 PORTER’S FIVE FORCES ANALYSIS 
           5.8.1 THREAT OF NEW ENTRANTS
           5.8.2 THREAT OF SUBSTITUTES
           5.8.3 BARGAINING POWER OF BUYERS
           5.8.4 BARGAINING POWER OF SUPPLIERS
           5.8.5 DEGREE OF COMPETITION
    5.9 PESTLE ANALYSIS 
    5.10 REGULATORY ANALYSIS 
           5.10.1 NORTH AMERICA
                    5.10.1.1 US
                    5.10.1.2 Canada
           5.10.2 EUROPE
           5.10.3 ASIA PACIFIC
                    5.10.3.1 Japan
                    5.10.3.2 India
           5.10.4 LATIN AMERICA
                    5.10.4.1 Brazil
                    5.10.4.2 Mexico
           5.10.5 MIDDLE EAST
           5.10.6 AFRICA
    5.11 TECHNOLOGY ANALYSIS 
           5.11.1 INCINERATION
           5.11.2 AUTOCLAVING
    5.12 KEY CONFERENCES & EVENTS, 2024–2025 
    5.13 TRENDS/DISRUPTIONS IMPACTING CUSTOMERS’ BUSINESSES 
    5.14 KEY STAKEHOLDERS AND BUYING CRITERIA 
           5.14.1 KEY STAKEHOLDERS IN BUYING PROCESS
           5.14.2 BUYING CRITERIA
    5.15 CASE STUDY ANALYSIS 
           5.15.1 CASE STUDY: HEALTHCARE WASTE MANAGEMENT IN SUDAN
 
6 MEDICAL WASTE MANAGEMENT MARKET, BY SERVICE (Page No. - 71)
    6.1 INTRODUCTION 
           6.1.1 PRIMARY NOTES
                    6.1.1.1 Key industry insights
    6.2 COLLECTION, TRANSPORTATION, AND STORAGE SERVICES 
           6.2.1 COLLECTION, TRANSPORTATION, STORAGE SERVICES TO HOLD DOMINANT MARKET SHARE
    6.3 TREATMENT & DISPOSAL SERVICES 
           6.3.1 INCINERATION
                    6.3.1.1 Rising investments in developing incinerators for small and medium-scale healthcare facilities to drive market
           6.3.2 AUTOCLAVING
                    6.3.2.1 Initiatives by government and non-government organizations to support market growth
           6.3.3 CHEMICAL TREATMENT
                    6.3.3.1 Increasing focus on onsite treatment of medical waste to support market growth
           6.3.4 OTHER TREATMENTS
    6.4 RECYCLING SERVICES 
           6.4.1 INCREASING AWARENESS ABOUT RECYCLING TO DRIVE MARKET
 
7 MEDICAL WASTE MANAGEMENT MARKET, BY TYPE OF WASTE (Page No. - 88)
    7.1 INTRODUCTION 
    7.2 NON-HAZARDOUS WASTE 
           7.2.1 GROWING VOLUME OF SURGICAL PROCEDURES TO INCREASE GENERATION OF NON-HAZARDOUS WASTE
    7.3 HAZARDOUS WASTE 
           7.3.1 INFECTIOUS & PATHOLOGICAL WASTE
                    7.3.1.1 Rising incidence of infectious diseases to drive large-volume infectious waste generation
           7.3.2 SHARPS WASTE
                    7.3.2.1 Increasing surgical volume to support market growth
           7.3.3 PHARMACEUTICAL WASTE
                    7.3.3.1 Stringent regulations and protocols for monitoring and disposal of pharmaceutical waste to drive market
           7.3.4 OTHER HAZARDOUS WASTE
 
8 MEDICAL WASTE MANAGEMENT MARKET, BY TREATMENT SITE (Page No. - 105)
    8.1 INTRODUCTION 
    8.2 OFFSITE TREATMENT 
           8.2.1 COST-EFFECTIVENESS OF OFFSITE TREATMENT TO DRIVE MARKET GROWTH
    8.3 ONSITE TREATMENT 
           8.3.1 GROWING COMPANY INITIATIVES TO PROVIDE ADVANCED ONSITE EQUIPMENT TO SUPPORT MARKET GROWTH
 
9 MEDICAL WASTE MANAGEMENT MARKET, BY WASTE GENERATOR (Page No. - 111)
    9.1 INTRODUCTION 
    9.2 HOSPITALS & DIAGNOSTIC LABORATORIES 
           9.2.1 RISING NUMBER OF SURGERIES TO CONTRIBUTE TO WASTE GENERATION
    9.3 OTHER WASTE GENERATORS 
 
10 MEDICAL WASTE MANAGEMENT MARKET, BY REGION (Page No. - 118)
     10.1 INTRODUCTION 
     10.2 NORTH AMERICA 
             10.2.1 NORTH AMERICA: RECESSION IMPACT
             10.2.2 US
                        10.2.2.1 Stringent regulations for handling medical waste to support market growth
             10.2.3 CANADA
                        10.2.3.1 Increasing number of surgical procedures to drive market
     10.3 EUROPE 
             10.3.1 EUROPE: RECESSION IMPACT
             10.3.2 GERMANY
                        10.3.2.1 Increasing healthcare expenditure to drive market
             10.3.3 UK
                        10.3.3.1 Rising incidence of chronic diseases to propel market growth
             10.3.4 FRANCE
                        10.3.4.1 Growing geriatric population to aid market growth
             10.3.5 ITALY
                        10.3.5.1 Improving quality and accessibility to medical to favor market growth
             10.3.6 SPAIN
                        10.3.6.1 Increasing life expectancy and growing geriatric population to ensure market growth
             10.3.7 REST OF EUROPE
     10.4 ASIA PACIFIC 
             10.4.1 ASIA PACIFIC: RECESSION IMPACT
             10.4.2 CHINA
                        10.4.2.1 China to hold largest share of APAC market
             10.4.3 JAPAN
                        10.4.3.1 Large geriatric population and well-developed healthcare system to drive market
             10.4.4 INDIA
                        10.4.4.1 Government initiatives and expansion in healthcare infrastructure to drive demand for waste management
             10.4.5 REST OF ASIA PACIFIC
     10.5 LATIN AMERICA 
             10.5.1 RISING PENETRATION OF HEALTHCARE TO SUPPORT MARKET GROWTH
             10.5.2 LATIN AMERICA: RECESSION IMPACT
     10.6 MIDDLE EAST & AFRICA 
             10.6.1 INCREASING TARGET POPULATION TO DRIVE MARKET
             10.6.2 MIDDLE EAST & AFRICA: RECESSION IMPACT
     10.7 GCC COUNTRIES 
             10.7.1 RISING POPULATION AND PREVALENCE OF CHRONIC DISEASES TO SUPPORT MARKET GROWTH
             10.7.2 GCC COUNTRIES: RECESSION IMPACT
 
11 COMPETITIVE LANDSCAPE (Page No. - 173)
     11.1 OVERVIEW 
     11.2 KEY PLAYER STRATEGIES/RIGHT TO WIN 
     11.3 REVENUE SHARE ANALYSIS 
     11.4 MARKET SHARE ANALYSIS 
     11.5 COMPANY EVALUATION MATRIX: KEY PLAYERS 
             11.5.1 STARS
             11.5.2 EMERGING LEADERS
             11.5.3 PERVASIVE PLAYERS
             11.5.4 PARTICIPANTS
             11.5.5 COMPANY FOOTPRINT
     11.6 COMPANY EVALUATION MATRIX: STARTUPS/SMES 
             11.6.1 PROGRESSIVE COMPANIES
             11.6.2 STARTING BLOCKS
             11.6.3 RESPONSIVE COMPANIES
             11.6.4 DYNAMIC COMPANIES
             11.6.5 COMPETITIVE BENCHMARKING OF STARTUPS/SME PLAYERS
     11.7 COMPETITIVE SCENARIO 
             11.7.1 SERVICE LAUNCHES
             11.7.2 DEALS
 
12 COMPANY PROFILES (Page No. - 184)
     12.1 KEY PLAYERS 
             12.1.1 VEOLIA ENVIRONNEMENT S.A.
                        12.1.1.1 Business overview
                        12.1.1.2 Services offered
                        12.1.1.3 Recent developments
                                     12.1.1.3.1 Service launches
                                     12.1.1.3.2 Deals
                        12.1.1.4 MnM view
                                     12.1.1.4.1 Key strengths/Right to win
                                     12.1.1.4.2 Strategic choices made
                                     12.1.1.4.3 Weaknesses and competitive threats
             12.1.2 CLEAN HARBORS, INC.
                        12.1.2.1 Business overview
                        12.1.2.2 Services offered
                        12.1.2.3 MnM view
                                     12.1.2.3.1 Key strengths/Right to win
                                     12.1.2.3.2 Strategic choices
                                     12.1.2.3.3 Weaknesses and competitive threats
             12.1.3 STERICYCLE INC.
                        12.1.3.1 Business overview
                        12.1.3.2 Services offered
                        12.1.3.3 MnM view
                                     12.1.3.3.1 Key strengths/Right to win
                                     12.1.3.3.2 Strategic choices made
                                     12.1.3.3.3 Weaknesses and competitive threats
             12.1.4 WASTE MANAGEMENT, INC.
                        12.1.4.1 Business overview
                        12.1.4.2 Services offered
                        12.1.4.3 Recent developments
                                     12.1.4.3.1 Deals
                        12.1.4.4 MnM view
                                     12.1.4.4.1 Key strengths/Right to win
                                     12.1.4.4.2 Strategic choices made
                                     12.1.4.4.3 Weaknesses and competitive threats
             12.1.5 CLEANAWAY WASTE MANAGEMENT LIMITED
                        12.1.5.1 Business overview
                        12.1.5.2 Services offered
                        12.1.5.3 MnM view
                                     12.1.5.3.1 Key strengths/Right to win
                                     12.1.5.3.2 Strategic choices made
                                     12.1.5.3.3 Weaknesses and competitive threats
             12.1.6 CASELLA WASTE SYSTEMS, INC.
                        12.1.6.1 Business overview
                        12.1.6.2 Services offered
                        12.1.6.3 Business overview
                        12.1.6.4 Services offered
                        12.1.6.5 Recent developments
                                     12.1.6.5.1 Deals
     12.2 OTHER PLAYERS 
             12.2.1 COVANTA HOLDING CORPORATION
             12.2.2 HAZARDOUS WASTE EXPERTS
             12.2.3 REMONDIS SE & CO. KG
             12.2.4 BIOMEDICAL WASTE SOLUTIONS, LLC
             12.2.5 ECOMED SERVICES
             12.2.6 GRP & ASSOCIATES, INC.
             12.2.7 BWS INCORPORATED
             12.2.8 MEDPRO DISPOSAL, LLC
             12.2.9 GIC MEDICAL DISPOSAL
             12.2.10 GAMMA WASTE SERVICES
             12.2.11 TRIUMVIRATE ENVIRONMENTAL
             12.2.12 EPCO
             12.2.13 ALL MEDICAL WASTE AUSTRALIA PTY LTD.
             12.2.14 PRO-DISPOSAL MEDICAL WASTE SERVICES
             12.2.15 SSO MEDICAL WASTE MANAGEMENT
             12.2.16 SAFEGUARD WASTE SOLUTIONS
             12.2.17 MEDWASTE INDUSTRIES, INC.
             12.2.18 DULSCO
 
13 APPENDIX (Page No. - 215)
     13.1 DISCUSSION GUIDE 
     13.2 KNOWLEDGESTORE: MARKETSANDMARKETS’ SUBSCRIPTION PORTAL 
     13.3 CUSTOMIZATION OPTIONS 
     13.4 RELATED REPORTS 
     13.5 AUTHOR DETAILS 
 
 
LIST OF TABLES (235 TABLES)
 
TABLE 1 RISK ASSESSMENT: MEDICAL WASTE MANAGEMENT MARKET
TABLE 2 ESTIMATED INCREASE IN GERIATRIC POPULATION, BY REGION (2019-2050)
TABLE 3 TOTAL NUMBER OF KNEE REPLACEMENTS, 2021
TABLE 4 TOTAL NUMBER OF CORONARY ARTERY BYPASS GRAFT PROCEDURES, 2022
TABLE 5 MEDICAL WASTE MANAGEMENT MARKET: LIST OF MAJOR PATENTS
TABLE 6 IMPORT DATA FOR INCINERATORS, BY COUNTRY, 2018–2022 (USD MILLION)
TABLE 7 EXPORT DATA FOR INCINERATORS, BY COUNTRY, 2018–2022 (USD MILLION)
TABLE 8 MEDICAL WASTE MANAGEMENT MARKET: ROLE IN ECOSYSTEM
TABLE 9 MEDICAL WASTE MANAGEMENT MARKET: PORTER’S FIVE FORCES ANALYSIS
TABLE 10 NORTH AMERICA: LIST OF REGULATORY BODIES, GOVERNMENT AGENCIES, AND OTHER ORGANIZATIONS
TABLE 11 ASIA PACIFIC: LIST OF REGULATORY BODIES, GOVERNMENT AGENCIES, AND OTHER ORGANIZATIONS
TABLE 12 EUROPE: LIST OF REGULATORY BODIES, GOVERNMENT AGENCIES, AND OTHER ORGANIZATIONS
TABLE 13 LATIN AMERICA: LIST OF REGULATORY BODIES, GOVERNMENT AGENCIES, AND OTHER ORGANIZATIONS
TABLE 14 REST OF THE WORLD: LIST OF REGULATORY BODIES, GOVERNMENT AGENCIES, AND OTHER ORGANIZATIONS
TABLE 15 MEDICAL WASTE MANAGEMENT MARKET: DETAILED LIST OF CONFERENCES & EVENTS
TABLE 16 INFLUENCE OF STAKEHOLDERS ON BUYING PROCESS FOR MEDICAL WASTE MANAGEMENT SERVICES (%)
TABLE 17 KEY BUYING CRITERIA, BY END USER
TABLE 18 MEDICAL WASTE MANAGEMENT MARKET, BY SERVICE, 2021–2028 (USD MILLION)
TABLE 19 MEDICAL WASTE MANAGEMENT MARKET FOR COLLECTION, TRANSPORTATION, AND STORAGE SERVICES, BY REGION, 2021–2028 (USD MILLION)
TABLE 20 NORTH AMERICA: MEDICAL WASTE MANAGEMENT MARKET FOR COLLECTION, TRANSPORTATION, AND STORAGE SERVICES, BY COUNTRY, 2021–2028 (USD MILLION)
TABLE 21 EUROPE: MEDICAL WASTE MANAGEMENT MARKET FOR COLLECTION, TRANSPORTATION, AND STORAGE SERVICES, BY COUNTRY, 2021–2028 (USD MILLION)
TABLE 22 ASIA PACIFIC: MEDICAL WASTE MANAGEMENT MARKET FOR COLLECTION, TRANSPORTATION, AND STORAGE SERVICES, BY COUNTRY, 2021–2028 (USD MILLION)
TABLE 23 MEDICAL WASTE MANAGEMENT MARKET FOR TREATMENT & DISPOSAL SERVICES, BY TYPE, 2021–2028 (USD MILLION)
TABLE 24 MEDICAL WASTE MANAGEMENT MARKET FOR TREATMENT & DISPOSAL SERVICES, BY REGION, 2021–2028 (USD MILLION)
TABLE 25 NORTH AMERICA: MEDICAL WASTE MANAGEMENT MARKET FOR TREATMENT & DISPOSAL SERVICES, BY COUNTRY, 2021–2028 (USD MILLION)
TABLE 26 EUROPE: MEDICAL WASTE MANAGEMENT MARKET FOR TREATMENT & DISPOSAL SERVICES, BY COUNTRY, 2021–2028 (USD MILLION)
TABLE 27 ASIA PACIFIC: MEDICAL WASTE MANAGEMENT MARKET FOR TREATMENT & DISPOSAL SERVICES, BY COUNTRY, 2021–2028 (USD MILLION)
TABLE 28 MEDICAL WASTE MANAGEMENT MARKET FOR INCINERATION, BY REGION, 2021–2028 (USD MILLION)
TABLE 29 NORTH AMERICA: MEDICAL WASTE MANAGEMENT MARKET FOR INCINERATION, BY COUNTRY, 2021–2028 (USD MILLION)
TABLE 30 EUROPE: MEDICAL WASTE MANAGEMENT MARKET FOR INCINERATION, BY COUNTRY, 2021–2028 (USD MILLION)
TABLE 31 ASIA PACIFIC: MEDICAL WASTE MANAGEMENT MARKET FOR INCINERATION, BY COUNTRY, 2021–2028 (USD MILLION)
TABLE 32 MEDICAL WASTE MANAGEMENT MARKET FOR AUTOCLAVING, BY REGION, 2021–2028 (USD MILLION)
TABLE 33 NORTH AMERICA: MEDICAL WASTE MANAGEMENT MARKET FOR AUTOCLAVING, BY COUNTRY, 2021–2028 (USD MILLION)
TABLE 34 EUROPE: MEDICAL WASTE MANAGEMENT MARKET FOR AUTOCLAVING, BY COUNTRY, 2021–2028 (USD MILLION)
TABLE 35 ASIA PACIFIC: MEDICAL WASTE MANAGEMENT MARKET FOR AUTOCLAVING, BY COUNTRY, 2021–2028 (USD MILLION)
TABLE 36 MEDICAL WASTE MANAGEMENT MARKET FOR CHEMICAL TREATMENT, BY REGION, 2021–2028 (USD MILLION)
TABLE 37 NORTH AMERICA: MEDICAL WASTE MANAGEMENT MARKET FOR CHEMICAL TREATMENT, BY COUNTRY, 2021–2028 (USD MILLION)
TABLE 38 EUROPE: MEDICAL WASTE MANAGEMENT MARKET FOR CHEMICAL TREATMENT, BY COUNTRY, 2021–2028 (USD MILLION)
TABLE 39 ASIA PACIFIC: MEDICAL WASTE MANAGEMENT MARKET FOR CHEMICAL TREATMENT, BY COUNTRY, 2021–2028 (USD MILLION)
TABLE 40 MEDICAL WASTE MANAGEMENT MARKET FOR OTHER TREATMENTS, BY REGION, 2021–2028 (USD MILLION)
TABLE 41 NORTH AMERICA: MEDICAL WASTE MANAGEMENT MARKET FOR OTHER TREATMENTS, BY COUNTRY, 2021–2028 (USD MILLION)
TABLE 42 EUROPE: MEDICAL WASTE MANAGEMENT MARKET FOR OTHER TREATMENTS, BY COUNTRY, 2021–2028 (USD MILLION)
TABLE 43 ASIA PACIFIC: MEDICAL WASTE MANAGEMENT MARKET FOR OTHER TREATMENTS, BY COUNTRY, 2021–2028 (USD MILLION)
TABLE 44 MEDICAL WASTE MANAGEMENT MARKET FOR RECYCLING SERVICES, BY REGION, 2021–2028 (USD MILLION)
TABLE 45 NORTH AMERICA: MEDICAL WASTE MANAGEMENT MARKET FOR RECYCLING SERVICES, BY COUNTRY, 2021–2028 (USD MILLION)
TABLE 46 EUROPE: MEDICAL WASTE MANAGEMENT MARKET FOR RECYCLING SERVICES, BY COUNTRY, 2021–2028 (USD MILLION)
TABLE 47 ASIA PACIFIC: MEDICAL WASTE MANAGEMENT MARKET FOR RECYCLING SERVICES, BY COUNTRY, 2021–2028 (USD MILLION)
TABLE 48 MEDICAL WASTE MANAGEMENT MARKET, BY TYPE OF WASTE, 2021–2028 (USD MILLION)
TABLE 49 MEDICAL WASTE MANAGEMENT MARKET, BY TYPE OF WASTE, 2021–2028 (TONS)
TABLE 50 NON-HAZARDOUS MEDICAL WASTE MANAGEMENT MARKET, BY REGION, 2021–2028 (USD MILLION)
TABLE 51 NORTH AMERICA: NON-HAZARDOUS MEDICAL WASTE MANAGEMENT MARKET, BY COUNTRY, 2021–2028 (USD MILLION)
TABLE 52 EUROPE: NON-HAZARDOUS MEDICAL WASTE MANAGEMENT MARKET, BY COUNTRY, 2021–2028 (USD MILLION)
TABLE 53 ASIA PACIFIC: NON-HAZARDOUS MEDICAL WASTE MANAGEMENT MARKET, BY COUNTRY, 2021–2028 (USD MILLION)
TABLE 54 HAZARDOUS MEDICAL WASTE MANAGEMENT MARKET, BY TYPE, 2021–2028 (USD MILLION)
TABLE 55 HAZARDOUS MEDICAL WASTE MANAGEMENT MARKET, BY REGION, 2021–2028 (USD MILLION)
TABLE 56 NORTH AMERICA: HAZARDOUS MEDICAL WASTE MANAGEMENT MARKET, BY COUNTRY, 2021–2028 (USD MILLION)
TABLE 57 EUROPE: HAZARDOUS MEDICAL WASTE MANAGEMENT MARKET, BY COUNTRY, 2021–2028 (USD MILLION)
TABLE 58 ASIA PACIFIC: HAZARDOUS MEDICAL WASTE MANAGEMENT MARKET, BY COUNTRY, 2021–2028 (USD MILLION)
TABLE 59 INFECTIOUS & PATHOLOGICAL MEDICAL WASTE MANAGEMENT MARKET, BY REGION, 2021–2028 (USD MILLION)
TABLE 60 NORTH AMERICA: INFECTIOUS & PATHOLOGICAL MEDICAL WASTE MANAGEMENT MARKET, BY COUNTRY, 2021–2028 (USD MILLION)
TABLE 61 EUROPE: INFECTIOUS & PATHOLOGICAL MEDICAL WASTE MANAGEMENT MARKET, BY COUNTRY, 2021–2028 (USD MILLION)
TABLE 62 ASIA PACIFIC: INFECTIOUS & PATHOLOGICAL MEDICAL WASTE MANAGEMENT MARKET, BY COUNTRY, 2021–2028 (USD MILLION)
TABLE 63 SHARPS MEDICAL WASTE MANAGEMENT MARKET, BY REGION, 2021–2028 (USD MILLION)
TABLE 64 NORTH AMERICA: SHARPS MEDICAL WASTE MANAGEMENT MARKET, BY COUNTRY, 2021–2028 (USD MILLION)
TABLE 65 EUROPE: SHARPS MEDICAL WASTE MANAGEMENT MARKET, BY COUNTRY, 2021–2028 (USD MILLION)
TABLE 66 ASIA PACIFIC: SHARPS MEDICAL WASTE MANAGEMENT MARKET, BY COUNTRY, 2021–2028 (USD MILLION)
TABLE 67 PHARMACEUTICAL MEDICAL WASTE MANAGEMENT MARKET, BY REGION, 2021–2028 (USD MILLION)
TABLE 68 NORTH AMERICA: PHARMACEUTICAL MEDICAL WASTE MANAGEMENT MARKET, BY COUNTRY, 2021–2028 (USD MILLION)
TABLE 69 EUROPE: PHARMACEUTICAL MEDICAL WASTE MANAGEMENT MARKET, BY COUNTRY, 2021–2028 (USD MILLION)
TABLE 70 ASIA PACIFIC: PHARMACEUTICAL MEDICAL WASTE MANAGEMENT MARKET, BY COUNTRY, 2021–2028 (USD MILLION)
TABLE 71 CHEMICAL WASTE GENERATED FROM HEALTHCARE ACTIVITIES
TABLE 72 MEDICAL WASTE MANAGEMENT MARKET FOR OTHER HAZARDOUS WASTE, BY REGION, 2021–2028 (USD MILLION)
TABLE 73 NORTH AMERICA: MEDICAL WASTE MANAGEMENT MARKET FOR OTHER HAZARDOUS WASTE, BY COUNTRY, 2021–2028 (USD MILLION)
TABLE 74 EUROPE: MEDICAL WASTE MANAGEMENT MARKET FOR OTHER HAZARDOUS WASTE, BY COUNTRY, 2021–2028 (USD MILLION)
TABLE 75 ASIA PACIFIC: MEDICAL WASTE MANAGEMENT MARKET FOR OTHER HAZARDOUS WASTE, BY COUNTRY, 2021–2028 (USD MILLION)
TABLE 76 MEDICAL WASTE MANAGEMENT MARKET, BY TREATMENT SITE, 2021–2028 (USD MILLION)
TABLE 77 OFFSITE MEDICAL WASTE TREATMENT MARKET, BY REGION, 2021–2028 (USD MILLION)
TABLE 78 NORTH AMERICA: OFFSITE MEDICAL WASTE TREATMENT MARKET, BY COUNTRY, 2021–2028 (USD MILLION)
TABLE 79 EUROPE: OFFSITE MEDICAL WASTE TREATMENT MARKET, BY COUNTRY, 2021–2028 (USD MILLION)
TABLE 80 ASIA PACIFIC: OFFSITE MEDICAL WASTE TREATMENT MARKET, BY COUNTRY, 2021–2028 (USD MILLION)
TABLE 81 ONSITE MEDICAL WASTE TREATMENT MARKET, BY REGION, 2021–2028 (USD MILLION)
TABLE 82 NORTH AMERICA: ONSITE MEDICAL WASTE TREATMENT MARKET, BY COUNTRY, 2021–2028 (USD MILLION)
TABLE 83 EUROPE: ONSITE MEDICAL WASTE TREATMENT MARKET, BY COUNTRY, 2021–2028 (USD MILLION)
TABLE 84 ASIA PACIFIC: ONSITE MEDICAL WASTE TREATMENT MARKET, BY COUNTRY, 2021–2028 (USD MILLION)
TABLE 85 MEDICAL WASTE MANAGEMENT MARKET, BY WASTE GENERATOR, 2021–2028 (USD MILLION)
TABLE 86 HEALTHCARE WASTE GENERATED BY HOSPITALS & DIAGNOSTIC LABORATORIES
TABLE 87 MEDICAL WASTE MANAGEMENT FOR HOSPITALS & DIAGNOSTIC LABORATORIES, BY REGION, 2021–2028 (USD MILLION)
TABLE 88 NORTH AMERICA: MEDICAL WASTE MANAGEMENT FOR HOSPITALS & DIAGNOSTIC LABORATORIES, BY COUNTRY, 2021–2028 (USD MILLION)
TABLE 89 EUROPE: MEDICAL WASTE MANAGEMENT FOR HOSPITALS & DIAGNOSTIC LABORATORIES, BY COUNTRY, 2021–2028 (USD MILLION)
TABLE 90 ASIA PACIFIC: MEDICAL WASTE MANAGEMENT FOR HOSPITALS & DIAGNOSTIC LABORATORIES, BY COUNTRY, 2021–2028 (USD MILLION)
TABLE 91 MEDICAL WASTE MANAGEMENT FOR OTHER WASTE GENERATORS, BY REGION, 2021–2028 (USD MILLION)
TABLE 92 NORTH AMERICA: MEDICAL WASTE MANAGEMENT FOR OTHER WASTE GENERATORS, BY COUNTRY, 2021–2028 (USD MILLION)
TABLE 93 EUROPE: MEDICAL WASTE MANAGEMENT FOR OTHER WASTE GENERATORS, BY COUNTRY, 2021–2028 (USD MILLION)
TABLE 94 ASIA PACIFIC: MEDICAL WASTE MANAGEMENT FOR OTHER WASTE GENERATORS, BY COUNTRY, 2021–2028 (USD MILLION)
TABLE 95 MEDICAL WASTE MANAGEMENT MARKET, BY REGION, 2021–2028 (USD MILLION)
TABLE 96 NORTH AMERICA: MEDICAL WASTE MANAGEMENT MARKET, BY COUNTRY, 2021–2028 (USD MILLION)
TABLE 97 NORTH AMERICA: MEDICAL WASTE MANAGEMENT MARKET, BY SERVICE, 2021–2028 (USD MILLION)
TABLE 98 NORTH AMERICA: MEDICAL WASTE MANAGEMENT MARKET FOR TREATMENT & DISPOSAL SERVICES, BY TYPE, 2021–2028 (USD MILLION)
TABLE 99 NORTH AMERICA: MEDICAL WASTE MANAGEMENT MARKET, BY TYPE OF WASTE, 2021–2028 (USD MILLION)
TABLE 100 NORTH AMERICA: HAZARDOUS MEDICAL WASTE MANAGEMENT MARKET, BY TYPE, 2021–2028 (USD MILLION)
TABLE 101 NORTH AMERICA: MEDICAL WASTE MANAGEMENT MARKET, BY TREATMENT SITE, 2021–2028 (USD MILLION)
TABLE 102 NORTH AMERICA: MEDICAL WASTE MANAGEMENT MARKET, BY WASTE GENERATOR, 2021–2028 (USD MILLION)
TABLE 103 US: MEDICAL WASTE MANAGEMENT MARKET, BY SERVICE, 2021–2028 (USD MILLION)
TABLE 104 US: MEDICAL WASTE MANAGEMENT MARKET FOR TREATMENT & DISPOSAL SERVICES, BY TYPE, 2021–2028 (USD MILLION)
TABLE 105 US: MEDICAL WASTE MANAGEMENT MARKET, BY TYPE OF WASTE, 2021–2028 (USD MILLION)
TABLE 106 US: HAZARDOUS MEDICAL WASTE MANAGEMENT MARKET, BY TYPE, 2021–2028 (USD MILLION)
TABLE 107 US: MEDICAL WASTE MANAGEMENT MARKET, BY TREATMENT SITE, 2021–2028 (USD MILLION)
TABLE 108 US: MEDICAL WASTE MANAGEMENT MARKET, BY WASTE GENERATOR, 2021–2028 (USD MILLION)
TABLE 109 CANADA: INCIDENCE OF DIABETES, 2022 VS. 2032
TABLE 110 CANADA: MEDICAL WASTE MANAGEMENT MARKET, BY SERVICE, 2021–2028 (USD MILLION)
TABLE 111 CANADA: MEDICAL WASTE MANAGEMENT MARKET FOR TREATMENT & DISPOSAL SERVICES, BY TYPE, 2021–2028 (USD MILLION)
TABLE 112 CANADA: MEDICAL WASTE MANAGEMENT MARKET, BY TYPE OF WASTE, 2021–2028 (USD MILLION)
TABLE 113 CANADA: HAZARDOUS MEDICAL WASTE MANAGEMENT MARKET, BY TYPE, 2021–2028 (USD MILLION)
TABLE 114 CANADA: MEDICAL WASTE MANAGEMENT MARKET, BY TREATMENT SITE, 2021–2028 (USD MILLION)
TABLE 115 CANADA: MEDICAL WASTE MANAGEMENT MARKET, BY WASTE GENERATOR, 2021–2028 (USD MILLION)
TABLE 116 EUROPE: HEALTHCARE EXPENDITURE, BY COUNTRY (% OF GDP)
TABLE 117 EUROPE: MEDICAL WASTE MANAGEMENT MARKET, BY COUNTRY, 2021–2028 (USD MILLION)
TABLE 118 EUROPE: MEDICAL WASTE MANAGEMENT MARKET, BY SERVICE, 2021–2028 (USD MILLION)
TABLE 119 EUROPE: MEDICAL WASTE MANAGEMENT MARKET FOR TREATMENT & DISPOSAL SERVICES, BY TYPE, 2021–2028 (USD MILLION)
TABLE 120 EUROPE: MEDICAL WASTE MANAGEMENT MARKET, BY TYPE OF WASTE, 2021–2028 (USD MILLION)
TABLE 121 EUROPE: HAZARDOUS MEDICAL WASTE MANAGEMENT MARKET, BY TYPE, 2021–2028 (USD MILLION)
TABLE 122 EUROPE: MEDICAL WASTE MANAGEMENT MARKET, BY TREATMENT SITE, 2021–2028 (USD MILLION)
TABLE 123 EUROPE: MEDICAL WASTE MANAGEMENT MARKET, BY WASTE GENERATOR, 2021–2028 (USD MILLION)
TABLE 124 GERMANY: MEDICAL WASTE MANAGEMENT MARKET, BY SERVICE, 2021–2028 (USD MILLION)
TABLE 125 GERMANY: MEDICAL WASTE MANAGEMENT MARKET FOR TREATMENT & DISPOSAL SERVICES, BY TYPE, 2021–2028 (USD MILLION)
TABLE 126 GERMANY: MEDICAL WASTE MANAGEMENT MARKET, BY TYPE OF WASTE, 2021–2028 (USD MILLION)
TABLE 127 GERMANY: HAZARDOUS MEDICAL WASTE MANAGEMENT MARKET, BY TYPE, 2021–2028 (USD MILLION)
TABLE 128 GERMANY: MEDICAL WASTE MANAGEMENT MARKET, BY TREATMENT SITE, 2021–2028 (USD MILLION)
TABLE 129 GERMANY: MEDICAL WASTE MANAGEMENT MARKET, BY WASTE GENERATOR, 2021–2028 (USD MILLION)
TABLE 130 UK: MEDICAL WASTE MANAGEMENT MARKET, BY SERVICE, 2021–2028 (USD MILLION)
TABLE 131 UK: MEDICAL WASTE MANAGEMENT MARKET FOR TREATMENT & DISPOSAL SERVICES, BY TYPE, 2021–2028 (USD MILLION)
TABLE 132 UK: MEDICAL WASTE MANAGEMENT MARKET, BY TYPE OF WASTE, 2021–2028 (USD MILLION)
TABLE 133 UK: HAZARDOUS MEDICAL WASTE MANAGEMENT MARKET, BY TYPE, 2021–2028 (USD MILLION)
TABLE 134 UK: MEDICAL WASTE MANAGEMENT MARKET, BY TREATMENT SITE, 2021–2028 (USD MILLION)
TABLE 135 UK: MEDICAL WASTE MANAGEMENT MARKET, BY WASTE GENERATOR, 2021–2028 (USD MILLION)
TABLE 136 FRANCE: MEDICAL WASTE MANAGEMENT MARKET, BY SERVICE, 2021–2028 (USD MILLION)
TABLE 137 FRANCE: MEDICAL WASTE MANAGEMENT MARKET FOR TREATMENT & DISPOSAL SERVICES, BY TYPE, 2021–2028 (USD MILLION)
TABLE 138 FRANCE: MEDICAL WASTE MANAGEMENT MARKET, BY TYPE OF WASTE, 2021–2028 (USD MILLION)
TABLE 139 FRANCE: HAZARDOUS MEDICAL WASTE MANAGEMENT MARKET, BY TYPE, 2021–2028 (USD MILLION)
TABLE 140 FRANCE: MEDICAL WASTE MANAGEMENT MARKET, BY TREATMENT SITE, 2021–2028 (USD MILLION)
TABLE 141 FRANCE: MEDICAL WASTE MANAGEMENT MARKET, BY WASTE GENERATOR, 2021–2028 (USD MILLION)
TABLE 142 ITALY: MEDICAL WASTE MANAGEMENT MARKET, BY SERVICE, 2021–2028 (USD MILLION)
TABLE 143 ITALY: MEDICAL WASTE MANAGEMENT MARKET FOR TREATMENT & DISPOSAL SERVICES, BY TYPE, 2021–2028 (USD MILLION)
TABLE 144 ITALY: MEDICAL WASTE MANAGEMENT MARKET, BY TYPE OF WASTE, 2021–2028 (USD MILLION)
TABLE 145 ITALY: HAZARDOUS MEDICAL WASTE MANAGEMENT MARKET, BY TYPE, 2021–2028 (USD MILLION)
TABLE 146 ITALY: MEDICAL WASTE MANAGEMENT MARKET, BY TREATMENT SITE, 2021–2028 (USD MILLION)
TABLE 147 ITALY: MEDICAL WASTE MANAGEMENT MARKET, BY WASTE GENERATOR, 2021–2028 (USD MILLION)
TABLE 148 SPAIN: MEDICAL WASTE MANAGEMENT MARKET, BY SERVICE, 2021–2028 (USD MILLION)
TABLE 149 SPAIN: MEDICAL WASTE MANAGEMENT MARKET FOR TREATMENT & DISPOSAL SERVICES, BY TYPE, 2021–2028 (USD MILLION)
TABLE 150 SPAIN: MEDICAL WASTE MANAGEMENT MARKET, BY TYPE OF WASTE, 2021–2028 (USD MILLION)
TABLE 151 SPAIN: HAZARDOUS MEDICAL WASTE MANAGEMENT MARKET, BY TYPE, 2021–2028 (USD MILLION)
TABLE 152 SPAIN: MEDICAL WASTE MANAGEMENT MARKET, BY TREATMENT SITE, 2021–2028 (USD MILLION)
TABLE 153 SPAIN: MEDICAL WASTE MANAGEMENT MARKET, BY WASTE GENERATOR, 2021–2028 (USD MILLION)
TABLE 154 REST OF EUROPE: PERCENTAGE OF GDP ON HEALTHCARE EXPENDITURE, BY COUNTRY
TABLE 155 REST OF EUROPE: MEDICAL WASTE MANAGEMENT MARKET, BY SERVICE, 2021–2028 (USD MILLION)
TABLE 156 REST OF EUROPE: MEDICAL WASTE MANAGEMENT MARKET FOR TREATMENT & DISPOSAL SERVICES, BY TYPE, 2021–2028 (USD MILLION)
TABLE 157 REST OF EUROPE: MEDICAL WASTE MANAGEMENT MARKET, BY TYPE OF WASTE, 2021–2028 (USD MILLION)
TABLE 158 REST OF EUROPE: HAZARDOUS MEDICAL WASTE MANAGEMENT MARKET, BY TYPE, 2021–2028 (USD MILLION)
TABLE 159 REST OF EUROPE: MEDICAL WASTE MANAGEMENT MARKET, BY TREATMENT SITE, 2021–2028 (USD MILLION)
TABLE 160 REST OF EUROPE: MEDICAL WASTE MANAGEMENT MARKET, BY WASTE GENERATOR, 2021–2028 (USD MILLION)
TABLE 161 ASIA PACIFIC: MEDICAL WASTE MANAGEMENT MARKET, BY COUNTRY, 2021–2028 (USD MILLION)
TABLE 162 ASIA PACIFIC: MEDICAL WASTE MANAGEMENT MARKET, BY SERVICE, 2021–2028 (USD MILLION)
TABLE 163 ASIA PACIFIC: MEDICAL WASTE MANAGEMENT MARKET FOR TREATMENT & DISPOSAL SERVICES, BY TYPE, 2021–2028 (USD MILLION)
TABLE 164 ASIA PACIFIC: MEDICAL WASTE MANAGEMENT MARKET, BY TYPE OF WASTE, 2021–2028 (USD MILLION)
TABLE 165 ASIA PACIFIC: HAZARDOUS MEDICAL WASTE MANAGEMENT MARKET, BY TYPE, 2021–2028 (USD MILLION)
TABLE 166 ASIA PACIFIC: MEDICAL WASTE MANAGEMENT MARKET, BY TREATMENT SITE, 2021–2028 (USD MILLION)
TABLE 167 ASIA PACIFIC: MEDICAL WASTE MANAGEMENT MARKET, BY WASTE GENERATOR, 2021–2028 (USD MILLION)
TABLE 168 CHINA: MEDICAL WASTE MANAGEMENT MARKET, BY SERVICE, 2021–2028 (USD MILLION)
TABLE 169 CHINA: MEDICAL WASTE MANAGEMENT MARKET FOR TREATMENT & DISPOSAL SERVICES, BY TYPE, 2021–2028 (USD MILLION)
TABLE 170 CHINA: MEDICAL WASTE MANAGEMENT MARKET, BY TYPE OF WASTE, 2021–2028 (USD MILLION)
TABLE 171 CHINA: HAZARDOUS MEDICAL WASTE MANAGEMENT MARKET, BY TYPE, 2021–2028 (USD MILLION)
TABLE 172 CHINA: MEDICAL WASTE MANAGEMENT MARKET, BY TREATMENT SITE, 2021–2028 (USD MILLION)
TABLE 173 CHINA: MEDICAL WASTE MANAGEMENT MARKET, BY WASTE GENERATOR, 2021–2028 (USD MILLION)
TABLE 174 JAPAN: MEDICAL WASTE MANAGEMENT MARKET, BY SERVICE, 2021–2028 (USD MILLION)
TABLE 175 JAPAN: MEDICAL WASTE MANAGEMENT MARKET FOR TREATMENT & DISPOSAL SERVICES, BY TYPE, 2021–2028 (USD MILLION)
TABLE 176 JAPAN: MEDICAL WASTE MANAGEMENT MARKET, BY TYPE OF WASTE, 2021–2028 (USD MILLION)
TABLE 177 JAPAN: HAZARDOUS MEDICAL WASTE MANAGEMENT MARKET, BY TYPE, 2021–2028 (USD MILLION)
TABLE 178 JAPAN: MEDICAL WASTE MANAGEMENT MARKET, BY TREATMENT SITE, 2021–2028 (USD MILLION)
TABLE 179 JAPAN: MEDICAL WASTE MANAGEMENT MARKET, BY WASTE GENERATOR, 2021–2028 (USD MILLION)
TABLE 180 INDIA: MEDICAL WASTE MANAGEMENT MARKET, BY SERVICE, 2021–2028 (USD MILLION)
TABLE 181 INDIA: MEDICAL WASTE MANAGEMENT MARKET FOR TREATMENT & DISPOSAL SERVICES, BY TYPE, 2021–2028 (USD MILLION)
TABLE 182 INDIA: MEDICAL WASTE MANAGEMENT MARKET, BY TYPE OF WASTE, 2021–2028 (USD MILLION)
TABLE 183 INDIA: HAZARDOUS MEDICAL WASTE MANAGEMENT MARKET, BY TYPE, 2021–2028 (USD MILLION)
TABLE 184 INDIA: MEDICAL WASTE MANAGEMENT MARKET, BY TREATMENT SITE, 2021–2028 (USD MILLION)
TABLE 185 INDIA: MEDICAL WASTE MANAGEMENT MARKET, BY WASTE GENERATOR, 2021–2028 (USD MILLION)
TABLE 186 REST OF ASIA PACIFIC: MEDICAL WASTE MANAGEMENT MARKET, BY SERVICE, 2021–2028 (USD MILLION)
TABLE 187 REST OF ASIA PACIFIC: MEDICAL WASTE MANAGEMENT MARKET FOR TREATMENT & DISPOSAL SERVICES, BY TYPE, 2021–2028 (USD MILLION)
TABLE 188 REST OF ASIA PACIFIC: MEDICAL WASTE MANAGEMENT MARKET, BY TYPE OF WASTE, 2021–2028 (USD MILLION)
TABLE 189 REST OF ASIA PACIFIC: HAZARDOUS MEDICAL WASTE MANAGEMENT MARKET, BY TYPE, 2021–2028 (USD MILLION)
TABLE 190 REST OF ASIA PACIFIC: MEDICAL WASTE MANAGEMENT MARKET, BY TREATMENT SITE, 2021–2028 (USD MILLION)
TABLE 191 REST OF ASIA PACIFIC: MEDICAL WASTE MANAGEMENT MARKET, BY WASTE GENERATOR, 2021–2028 (USD MILLION)
TABLE 192 LATIN AMERICA: MEDICAL WASTE MANAGEMENT MARKET, BY SERVICE, 2021–2028 (USD MILLION)
TABLE 193 LATIN AMERICA: MEDICAL WASTE MANAGEMENT MARKET FOR TREATMENT & DISPOSAL SERVICES, BY TYPE, 2021–2028 (USD MILLION)
TABLE 194 LATIN AMERICA: MEDICAL WASTE MANAGEMENT MARKET, BY TYPE OF WASTE, 2021–2028 (USD MILLION)
TABLE 195 LATIN AMERICA: HAZARDOUS MEDICAL WASTE MANAGEMENT MARKET, BY TYPE, 2021–2028 (USD MILLION)
TABLE 196 LATIN AMERICA: MEDICAL WASTE MANAGEMENT MARKET, BY TREATMENT SITE, 2021–2028 (USD MILLION)
TABLE 197 LATIN AMERICA: MEDICAL WASTE MANAGEMENT MARKET, BY WASTE GENERATOR, 2021–2028 (USD MILLION)
TABLE 198 MIDDLE EAST & AFRICA: MEDICAL WASTE MANAGEMENT MARKET, BY SERVICE, 2021–2028 (USD MILLION)
TABLE 199 MIDDLE EAST & AFRICA: MEDICAL WASTE MANAGEMENT MARKET FOR TREATMENT & DISPOSAL SERVICES, BY TYPE, 2021–2028 (USD MILLION)
TABLE 200 MIDDLE EAST & AFRICA: MEDICAL WASTE MANAGEMENT MARKET, BY TYPE OF WASTE, 2021–2028 (USD MILLION)
TABLE 201 MIDDLE EAST & AFRICA: HAZARDOUS MEDICAL WASTE MANAGEMENT MARKET, BY TYPE, 2021–2028 (USD MILLION)
TABLE 202 MIDDLE EAST & AFRICA: MEDICAL WASTE MANAGEMENT MARKET, BY TREATMENT SITE, 2021–2028 (USD MILLION)
TABLE 203 MIDDLE EAST & AFRICA: MEDICAL WASTE MANAGEMENT MARKET, BY WASTE GENERATOR, 2021–2028 (USD MILLION)
TABLE 204 GCC COUNTRIES: MEDICAL WASTE MANAGEMENT MARKET, BY SERVICE, 2021–2028 (USD MILLION)
TABLE 205 GCC COUNTRIES: MEDICAL WASTE MANAGEMENT MARKET FOR TREATMENT & DISPOSAL SERVICES, BY TYPE, 2021–2028 (USD MILLION)
TABLE 206 GCC COUNTRIES: MEDICAL WASTE MANAGEMENT MARKET, BY TYPE OF WASTE, 2021–2028 (USD MILLION)
TABLE 207 GCC COUNTRIES: HAZARDOUS MEDICAL WASTE MANAGEMENT MARKET, BY TYPE, 2021–2028 (USD MILLION)
TABLE 208 GCC COUNTRIES: MEDICAL WASTE MANAGEMENT MARKET, BY TREATMENT SITE, 2021–2028 (USD MILLION)
TABLE 209 GCC COUNTRIES: MEDICAL WASTE MANAGEMENT MARKET, BY WASTE GENERATOR, 2021–2028 (USD MILLION)
TABLE 210 OVERVIEW OF STRATEGIES DEPLOYED BY KEY MEDICAL WASTE MANAGEMENT SERVICE PROVIDERS
TABLE 211 MEDICAL WASTE MANAGEMENT MARKET: DEGREE OF COMPETITION
TABLE 212 COMPANY FOOTPRINT
TABLE 213 COMPANY SERVICE FOOTPRINT
TABLE 214 COMPANY REGIONAL FOOTPRINT
TABLE 215 MEDICAL WASTE MANAGEMENT MARKET: DETAILED LIST OF KEY STARTUPS/SMES
TABLE 216 KEY SERVICE LAUNCHES (JANUARY 2020–JANUARY 2024)
TABLE 217 KEY DEALS (JANUARY 2020– JANUARY 2024)
TABLE 218 VEOLIA ENVIRONNEMENT S.A.: COMPANY OVERVIEW
TABLE 219 VEOLIA ENVIRONNEMENT S.A.: SERVICES OFFERED
TABLE 220 VEOLIA ENVIRONNEMENT S.A.: SERVICE LAUNCHES (JANUARY 2020–JANUARY 2024)
TABLE 221 VEOLIA ENVIRONNEMENT S.A.: DEALS (JANUARY 2020–JANUARY 2024)
TABLE 222 CLEAN HARBORS, INC.: COMPANY OVERVIEW
TABLE 223 CLEAN HARBORS, INC.: SERVICES OFFERED
TABLE 224 STERICYCLE INC.: COMPANY OVERVIEW
TABLE 225 STERICYCLE INC.: SERVICES OFFERED
TABLE 226 WASTE MANAGEMENT INC.: COMPANY OVERVIEW
TABLE 227 WASTE MANAGEMENT, INC.: SERVICES OFFERED
TABLE 228 WASTE MANAGEMENT, INC.: DEALS (JANUARY 2020–JANUARY 2024)
TABLE 229 CLEANAWAY WASTE MANAGEMENT LIMITED: COMPANY OVERVIEW
TABLE 230 CLEANAWAY WASTE MANAGEMENT LIMITED: SERVICES OFFERED
TABLE 231 CASELLA WASTE SYSTEMS, INC.: COMPANY OVERVIEW
TABLE 232 CASELLA WASTE SYSTEMS, INC.: SERVICES OFFERED
TABLE 233 SHARPS COMPLIANCE, INC.: COMPANY OVERVIEW
TABLE 234 SHARPS COMPLIANCE, INC.: SERVICES OFFERED
TABLE 235 SHARPS COMPLIANCE, INC.: DEALS (JANUARY 2020–JANUARY 2024)
 
 
LIST OF FIGURES (39 FIGURES)
 
FIGURE 1 MEDICAL WASTE MANAGEMENT MARKET: RESEARCH DESIGN METHODOLOGY
FIGURE 2 BREAKDOWN OF PRIMARY INTERVIEWS: SUPPLY-SIDE AND DEMAND-SIDE PARTICIPANTS
FIGURE 3 BREAKDOWN OF PRIMARY INTERVIEWS: BY COMPANY TYPE, DESIGNATION, AND REGION
FIGURE 4 BOTTOM-UP APPROACH: COMPANY REVENUE ESTIMATION APPROACH
FIGURE 5 CAGR PROJECTIONS: SUPPLY-SIDE ANALYSIS
FIGURE 6 MEDICAL WASTE MANAGEMENT MARKET: TOP-DOWN APPROACH
FIGURE 7 DATA TRIANGULATION METHODOLOGY
FIGURE 8 MEDICAL WASTE MANAGEMENT MARKET, BY SERVICE, 2023 VS. 2028 (USD MILLION)
FIGURE 9 MEDICAL WASTE MANAGEMENT MARKET, BY TYPE OF WASTE, 2023 VS. 2028 (USD MILLION)
FIGURE 10 MEDICAL WASTE MANAGEMENT MARKET, BY TREATMENT SITE, 2023 VS. 2028 (USD MILLION)
FIGURE 11 MEDICAL WASTE MANAGEMENT MARKET, BY WASTE GENERATOR, 2023 VS. 2028 (USD MILLION)
FIGURE 12 MEDICAL WASTE MANAGEMENT MARKET, BY REGION, 2023 VS. 2028 (USD MILLION)
FIGURE 13 INCREASING VOLUME OF HEALTHCARE WASTE TO DRIVE MARKET
FIGURE 14 COLLECTION, TRANSPORTATION, AND STORAGE SERVICES SEGMENT TO DOMINATE MARKET TILL 2028
FIGURE 15 NON-HAZARDOUS WASTE SEGMENT TO DOMINATE MARKET DURING FORECAST PERIOD
FIGURE 16 OFFSITE TREATMENT SEGMENT TO ACCOUNT FOR LARGER MARKET SHARE IN 2022
FIGURE 17 HOSPITALS & DIAGNOSTIC LABORATORIES TO DOMINATE MEDICAL WASTE MANAGEMENT MARKET
FIGURE 18 ASIA PACIFIC REGION TO REGISTER HIGHEST GROWTH IN FORECAST PERIOD
FIGURE 19 MEDICAL WASTE MANAGEMENT MARKET: DRIVERS, RESTRAINTS, OPPORTUNITIES AND CHALLENGES
FIGURE 20 PATENT ANALYSIS OF MEDICAL WASTE MANAGEMENT MARKET (JANUARY 2014–DECEMBER 2023)
FIGURE 21 SORTING AND PROCESSING PHASES CLAIM MAJOR VALUE ADDITION
FIGURE 22 MEDICAL WASTE MANAGEMENT MARKET: SUPPLY CHAIN ANALYSIS
FIGURE 23 MEDICAL WASTE MANAGEMENT MARKET: ECOSYSTEM ANALYSIS
FIGURE 24 REVENUE SHIFT IN MEDICAL WASTE MANAGEMENT MARKET
FIGURE 25 INFLUENCE OF STAKEHOLDERS ON BUYING PROCESS FOR MEDICAL WASTE MANAGEMENT SERVICES
FIGURE 26 KEY BUYING CRITERIA FOR MEDICAL WASTE MANAGEMENT END USERS
FIGURE 27 NORTH AMERICA: MEDICAL WASTE MANAGEMENT MARKET SNAPSHOT
FIGURE 28 ASIA PACIFIC: MEDICAL WASTE MANAGEMENT MARKET SNAPSHOT
FIGURE 29 REVENUE SHARE ANALYSIS OF TOP PLAYERS IN MEDICAL WASTE MANAGEMENT MARKET (2018–2022)
FIGURE 30 MARKET SHARE OF KEY PLAYERS (2022)
FIGURE 31 MEDICAL WASTE MANAGEMENT MARKET: COMPANY EVALUATION MATRIX (KEY PLAYERS), 2022
FIGURE 32 MEDICAL WASTE MANAGEMENT MARKET: COMPANY FOOTPRINT
FIGURE 33 MEDICAL WASTE MANAGEMENT MARKET: COMPANY EVALUATION MATRIX (STARTUPS/SMES), 2022
FIGURE 34 VEOLIA ENVIRONNEMENT S.A.: COMPANY SNAPSHOT (2022)
FIGURE 35 CLEAN HARBORS, INC.: COMPANY SNAPSHOT (2022)
FIGURE 36 STERICYCLE INC.: COMPANY SNAPSHOT (2022)
FIGURE 37 WASTE MANAGEMENT, INC.: COMPANY SNAPSHOT (2022)
FIGURE 38 CLEANAWAY WASTE MANAGEMENT LIMITED: COMPANY SNAPSHOT (2023)
FIGURE 39 CASELLA WASTE SYSTEMS, INC.: COMPANY SNAPSHOT (2022)

The objective of the study is to analyze the key market dynamics, such as drivers, opportunities, restraints, challenges and key player strategies. To track company developments such as service launch, acquisition, agreement and partnership of the leading players, the competitive landscape of the medical waste management market to analyze market players on various parameters within the broad categories of business and service strategy. Top-down and bottom-up approaches were used to estimate the market size. To estimate the market size of segments and subsegments, the market breakdown and data triangulation were used.

The four steps involved in estimating the market size are

Secondary Research

In the secondary research process, various secondary sources such as annual reports, press releases & investor presentations of companies, white papers, certified publications, articles by recognized authors, gold-standard & silver-standard websites, regulatory bodies, and databases (such as D&B Hoovers, Bloomberg Business, and Factiva) were referred to identify and collect information for this study.

Primary Research

In the primary research process, various sources from both the supply and demand sides were interviewed to obtain qualitative and quantitative information for this report. Primary sources were mainly industry experts from the core and related industries and preferred suppliers, manufacturers, distributors, service providers, technology developers, researchers, and organizations related to all segments of this industry’s value chain. In-depth interviews were conducted with various primary respondents, including key industry participants, subject-matter experts, C-level executives of key market players, and industry consultants, to obtain and verify critical qualitative and quantitative information as well as assess prospects.

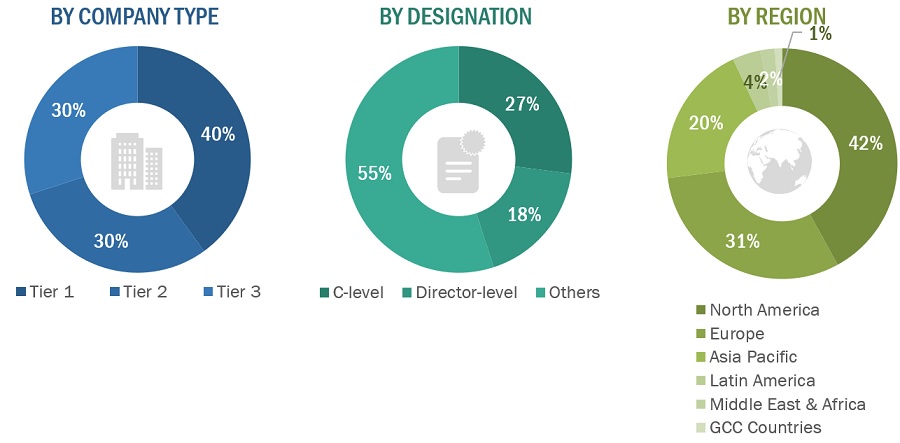
The following is a breakdown of the primary respondents:

Breakdown of Primary Participants:
Medical  Waste Management Market Size, and Share

Note 1: Others include sales managers, marketing managers, and product managers.

Note 2: Companies are classified into tiers based on their total revenues. As of 2022, Tier 1 = >USD 100 million, Tier 2 = USD 10 million to USD 100 million, and Tier 3 = <USD 10 million.

To know about the assumptions considered for the study, download the pdf brochure

COMPANY NAME

DESIGNATION

Veolia Environnement S.A.

Senior Product Manager

Waste Management, Inc.

Quality Control Manager

Clean Harbor, Inc.

Marketing Manager

Market Size Estimation

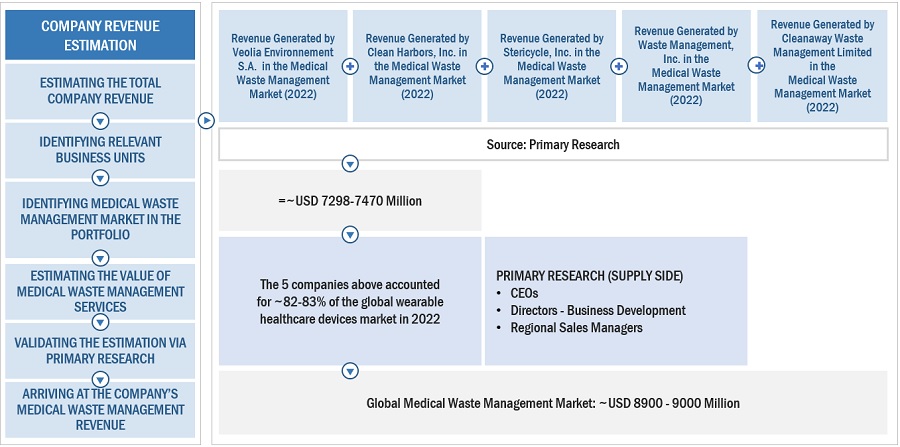
Both top-down and bottom-up approaches were used to estimate and validate the medical waste management market's total size. These methods were also used extensively to estimate the size of various subsegments in the market. The research methodology used to estimate the market size includes the following:

  • The key players in the industry have been identified through extensive secondary research
  • The revenues generated by leading players operating in the medical waste management market have been determined through primary and secondary research.
  • All percentage shares, splits, and breakdowns have been determined using secondary sources and verified through primary sources.

Global Medical Waste Management Market Size: Botton Up Approach
Medical  Waste Management Market Size, and Share

To know about the assumptions considered for the study, Request for Free Sample Report

Global Medical Waste Management Market Size: Top-Down Approach

Medical  Waste Management Market Size, and Share

Data Triangulation

After arriving at the overall market size by applying the process mentioned above, the total market was split into several segments and subsegments. To complete the overall market engineering process and arrive at the exact statistics for all segments and subsegments, data triangulation and market breakdown procedures were employed, wherever applicable. The data was triangulated by studying various factors and trends from both the demand and supply sides.

Market Definition

Medical waste encompasses materials such as infectious waste, hazardous waste, sharps waste, cytotoxic waste, and any other waste produced by medical facilities such as hospitals, laboratories, or pharmaceutical companies. The process of managing medical waste, known as medical waste management, involves collecting, transporting, storing, treating, disposing, and recycling medical waste through methods such as incineration and autoclaving.

Key Stakeholders

  • Medical Waste Treatment Device Manufacturers
  • Medical Waste Management Service Providers
  • Research Institutes
  • Research and Consulting Firms
  • Environment, Health, and Safety Organizations
  • Regulatory Bodies

Report Objectives

  • To define, describe, segment, and forecast the medical waste management market by services, type of waste, treatment site, waste generator and region.
  • To provide detailed information regarding the major factors influencing the market growth (drivers, restraints, opportunities, and challenges).
  • To analyze micromarkets1 with respect to individual growth trends, prospects, and contributions to the overall market.
  • To analyze market opportunities for stakeholders and provide details of the competitive landscape for key players.
  • To forecast the size of the market segments with respect to five regions, namely, North America, Europe, the Asia Pacific, Latin America, the Middle East & Africa and GCC Countries.
  • To profile the key players and comprehensively analyze their service portfolios, market positions, and core competencies2.
  • To track and analyze company developments such as Service launch, acquisition, agreement, Partnership in the medical waste management market.
  • To benchmark players within the market using the proprietary “Competitive Leadership Mapping” framework, which analyzes market players on various parameters within the broad categories of business and service strategy.

Available Customizations

  • MarketsandMarkets offers the following customizations for this market report.

Country Information

  • Additional country-level analysis of the medical waste management market

Company profiles

  • Additional five company profiles of players operating in the medical waste management market.

Product Analysis

  • Service matrix, which provides a detailed comparison of the service portfolio of each company in the medical waste management market
Custom Market Research Services

We will customize the research for you, in case the report listed above does not meet with your exact requirements. Our custom research will comprehensively cover the business information you require to help you arrive at strategic and profitable business decisions.

Request Customization

Instant Answers with GPT - Ask Now!

Ask real questions. Get complete answers !
Report Code
MD 3644
Published ON
Mar, 2024
Choose License Type
BUY NOW
  • SHARE
X
Request Customization
Speak to Analyst
Speak to Analyst
OR FACE-TO-FACE MEETING
PERSONALIZE THIS RESEARCH
  • Triangulate with your Own Data
  • Get Data as per your Format and Definition
  • Gain a Deeper Dive on a Specific Application, Geography, Customer or Competitor
  • Any level of Personalization
REQUEST A FREE CUSTOMIZATION
LET US HELP YOU!
  • What are the Known and Unknown Adjacencies Impacting the Medical Waste Management Market
  • What will your New Revenue Sources be?
  • Who will be your Top Customer; what will make them switch?
  • Defend your Market Share or Win Competitors
  • Get a Scorecard for Target Partners
CUSTOMIZED WORKSHOP REQUEST
  • Call Us
  • +1-888-600-6441 (Corporate office hours)
  • +1-888-600-6441 (US/Can toll free)
  • +44-800-368-9399 (UK office hours)
CONNECT WITH US
ABOUT TRUST ONLINE
©2024 MarketsandMarkets Research Private Ltd. All rights reserved
DMCA.com Protection Status Website Feedback