Metal Recycling Market

Metal Recycling Market by Type (Ferrous Metals, Non-Ferrous Metals), Scrap Type (Old Scrap, New Scrap), Equipment Used (Shredder, Shear, Granulation Machine, Briquetting Machine), End-Use Industry, and Region - Global Forecast to 2029

Report Code: MM 3943 Jun, 2024, by marketsandmarkets.com

The metal recycling market size is projected to grow from USD 551.9 billion in 2024 and is projected to reach USD 767.9 billion by 2029, at a CAGR of 6.8%. The metal recycling market is experiencing a significant surge, largely driven by environmental regulations, the industrial need for sustainable raw materials, cost savings, and technological advancements. This trend is particularly evident in the Asia Pacific (APAC) region, which stands out as the fastest-growing market for metal recycling. China, in particular, plays a pivotal role in this growth trajectory, witnessing a substantial rise in both production and consumption of metal recycling. The metal recycling market in the Asia Pacific region is driven by rapid industrialization, urbanization, stringent environmental regulations, and the economic and environmental benefits of recycling, such as reduced energy consumption and lower production costs. Technological advancements also enhance recycling efficiency and quality. Key end-use industries experiencing growth include automotive, construction, and electronics. The automotive sector benefits from cost savings and sustainability, the construction industry uses recycled metals for urban development and infrastructure projects, and the electronics industry recycles metals to manage e-waste and meet regulatory and consumer demands for eco-friendly products. This growth not only underscores the region's industrial prowess but also highlights the indispensable role metal recycling play in driving technological innovation and sustainable development initiatives.

Attractive Opportunities in the Metal Recycling Market

Metal Recycling Market

To know about the assumptions considered for the study, Request for Free Sample Report

Metal Recycling Market

Metal recycling Market Dynamics

Driver: Increasing urbanization and industrialization

Increasing urbanization and industrialization significantly drive the metal recycling market. As cities expand, the construction of buildings, infrastructure, and transportation systems creates substantial demand for metals. This demand leads to a greater reliance on recycled metals, which are more cost-effective and environmentally friendly than newly mined materials. Industrialization increases the production of goods, generating more manufacturing waste and end-of-life products that can be recycled. Recycling metals helps industries reduce production costs, lower their carbon footprint, and comply with stringent environmental regulations. This sustainable approach supports resource conservation and is integral to modern urban and industrial growth.

Restraint: Disorganized metal waste collection in developing countries 

Disorganized metal waste collection in developing countries poses a significant restrains to the growth of the metal recycling market. In these regions, the absence of a structured waste management system leads to inefficient collection and segregation of recyclable metals. As a result, large quantities of metal waste end up in landfills or remain unmanaged, making it challenging to recover and recycle these valuable materials. While informal recycling sectors exist, they often lack the necessary capacity, technology, and regulatory oversight to process metals effectively and safely. This inefficiency leads to low recycling rates, preventing the full realization of the economic and environmental benefits associated with metal recycling. Consequently, the disorganization within the waste collection system hampers the development of a sustainable metal recycling industry and obstructs efforts to achieve broader environmental and resource management objectives.

Opportunities: Metal recovery from slag residue

Slag is a valuable resource for steelmakers, as a significant amount of metal is often lost in slag and metal-slag mixtures during the smelting process. Depending on the smelting method and the age of the slag dump, metal content can range from 3% to 15%. Globally, slag stockpiles are estimated to exceed 60 million tons. Companies such as Harsco Corporation (US), Fandej Corporation (The Netherlands), and LOESCHE GmbH (Germany) specialize in recovering metal from slag. Before signing a metal recovery contract with a client, these companies analyze a sample of the slag to assess the potential for metal recovery and the properties of the slag. Recovering metal from slag benefits steelmakers by reducing disposal costs and providing recovered metal for further steel production. Metal can be reclaimed from slag produced during the manufacture of stainless steel, LD slag, and metallurgical modified slag.

Metal recovery from slag residue presents opportunities in the metal recycling market by offering a sustainable and economical method to extract valuable metals from waste materials. This approach reduces reliance on virgin ore mining, preserves natural resources, and reduces environmental harm. The reclaimed metals can be reintegrated into the supply chain, fulfilling the growing demand for recycled materials across different industries. It advances circular economy principles, fostering innovation and expansion in the metal recycling industry.

Challenges: Growing complexity of products poses challenges to recycling efforts

The increasing complexity of modern products significantly challenges metal recycling efforts. Advanced products often incorporate a variety of metals and other materials that are tightly integrated and difficult to separate. For example, electronic devices like smartphones and laptops contain intricate assemblies of metals, plastics, and other components, making the recycling process labor-intensive and technologically demanding. One major challenge is the need for advanced sorting and separation technologies. Traditional recycling methods are often inadequate for handling the mixed materials and intricate designs of contemporary products. This requires developing and implementing innovative recycling technologies, which can be costly and necessitate significant investment.

The presence of hazardous materials and rare earth elements in modern products complicates the recycling process. These substances must be carefully handled to prevent environmental contamination and ensure the safety of recycling workers. Extracting valuable metals from these complex products also requires specialized processes that can be both time-consuming and expensive. Hence, the growing complexity of products poses challenges to metal recycling efforts by necessitating advanced sorting and separation technologies, careful handling of hazardous materials, and continuous adaptation to new product designs. These factors collectively increase the cost and complexity of recycling, hindering the efficiency and effectiveness of metal recovery efforts.

ECOSYSTEM

Metal Recycling Market Ecosystem

The ferrous metals segment is projected to be the larger type segment of metal recycling market during the forecast period.

Ferrous metals, which primarily consist of iron and steel, include materials such as steel, carbon steel, alloy steel, cast iron, and wrought iron. These metals are characterized by their magnetic properties and high tensile strength, making them crucial for a variety of applications. In construction, ferrous metals are used for structural frameworks, bridges, and reinforcement bars due to their strength and durability. The automotive industry relies on them for manufacturing car bodies, engines, and various components. Additionally, these metals are vital in the production of industrial machinery, tools, and equipment.

Recycling ferrous metals is an important process that involves collecting scrap metal from several end-use industries. The construction and demolition sector is a major contributor, providing steel beams, rebar, and other structural elements. The automotive industry also contributes significantly with scrap from old vehicles and parts. The manufacturing industry supplies ferrous scrap from machinery, and tools. Recycling ferrous metals not only conserves natural resources but also reduces energy consumption and greenhouse gas emissions compared to producing new metals from raw materials.

The old scrap segment is projected to grow at the highest CAGR during the forecast period.

Outdated or post-consumer scrap, commonly referred to as old scrap, originates from discarded goods that are no longer concidered functional. This type of scrap comes from various sources including electrical and electronic appliances, municipal waste, rejected automobiles, building metal scrap, railway tracks, and others. Old scrap encompasses any steel product that has reached the end of its utility, such as automobile, recycled cans, and structural beams from infrastructure like buildings or bridges. Annually, the scrap recycling industry converts over 130 million metric tons of obsolete materials sourced from consumers, businesses, and manufacturers into valuable raw material.

Asia Pacific is estimated to account for the largest market share during the forecast period.

The Asia Pacific region is poised to dominate the metal recycling industry during the forecast period, with China at the forefront of this dominance.  The metal recycling market in the Asia Pacific region is bolstered by factors like rapid industrialization, urbanization, and growing environmental awareness. China, being a major producer and consumer of metals, plays a crucial role in this growth. Its large manufacturing sector generates significant metal scrap, driving the demand for recycling. Additionally, Chinese government policies promoting domestic recycling and restricting imported scrap further stimulate market expansion. China's influence as a major exporter of goods also contributes to the region's demand for recycling services and technologies.

Metal Recycling Market by Region

To know about the assumptions considered for the study, download the pdf brochure

Key Market Players

The Metal recycling market comprises key manufacturers such as are ArcelorMittal (Luxembourg),  Nucor (US), CMC (US), Sims Limited (Australia), Aurubis AG (Germany), Dowa Holdings Co., Ltd. (Japan), Tata Steel (India), Radius Recycling, Inc. (US),  European Metal Recycling Ltd. (UK), and Upstate Shredding – Weitsman Recycling (US)  are the top manufacturers covered in the metal recycling market. Expansions, mergers & acquisitions, new product launches and deals were some of the major strategies adopted by these key players to enhance their positions in the metal recycling market. A major focus was given to the expansions and deals.

Get online access to the report on the World's First Market Intelligence Cloud

  • Easy to Download Historical Data & Forecast Numbers
  • Company Analysis Dashboard for high growth potential opportunities
  • Research Analyst Access for customization & queries
  • Competitor Analysis with Interactive dashboard
  • Latest News, Updates & Trend analysis
Request Sample

Scope of the Report

Report Metric

Details

Market size available for years

2019–2029

Base year considered

2023

Forecast period

2024–2029

Forecast units

Value (USD Million), Volume (Million Ton)

Segments Covered

Type, Scrap Type, Equipment Used, End-Use Industry, and Region

Geographies covered

North America, Asia Pacific, Europe, South America, and Middle East & Africa.

Companies covered

ArcelorMittal (Luxembourg),  Nucor (US), CMC (US), Sims Limited (Australia), Aurubis AG (Germany), Dowa Holdings Co., Ltd. (Japan), Tata Steel (India), Radius Recycling, Inc. (US),  European Metal Recycling Ltd. (UK), and  Upstate Shredding – Weitsman Recycling (US), among others.
25 manufacturers are covered in the metal recycling market.

This research report categorizes the metal recycling market based on Type, Scrap Type, Equipment Used, End-Use Industry, and Region.

Based on Type:
  • Ferrous Metals
  • Non-Ferrous Metals
Based on Scrap Type:
  • New Scrap
  • Old Scrap
Based on Equipment Used:
  • Shredder
  • Shearing
  • Granulation Machine
  • Briquetting Machine
Based on End-Use Industry:
  • Building & Construction
  • Automotive
  • Equipment Manufacturing
  • Shipbuilding
  • Packaging
  • Consumer Appliances
  • Other End-Use Industries
Based on Region:
  • North America
  • Europe
  • Asia Pacific
  • Middle East & Africa
  • South America
Recent Developments
  • In January 2023, ArcelorMittal finalized the acquisition of Riwald Recycling ("Riwald"), a cutting-edge ferrous scrap metal recycling company in the Netherlands, as part of its decarbonization strategy. The company also acquired Italpannelli Germany, a German manufacturer of insulation panels, enhancing its geographic reach and bolstering the product offerings of ArcelorMittal Downstream Solutions' construction division.
  • In November 2023, ArcelorMittal and Schneider Electric formed a partnership in which ArcelorMittal will provide Schneider Electric with XCarb recycled and renewably produced steel for use in its electrical cabinets and enclosures.
  • In October 2023, Nucor Corporation's recycling subsidiary, River Metals Recycling (RMR), completed an acquisition, acquiring all assets of Cincinnati-based Garden Street Iron & Metal. This includes one feeder and one shredder yard, thereby expanding RMR's network to a total of 19 recycling facilities.
  • In July 2023, CMC declared that it received a permit from the West Virginia Department of Environmental Protection, enabling the commencement of construction for its fourth state-of-the-art micro mill. This permit marks a significant milestone in its Steel West Virginia micro mill project.
  • In February 2024, Sims Metal made investment in sustainable technology at Providence Facility. Sims Metal unveiled its investment in a state-of-the-art electric car flattener, replacing the previous diesel model, at the local Sims Metal facility situated on Allens Avenue. This cutting-edge electric equipment is anticipated to diminish the site's CO2 emissions by 9.6 tons annually, aligning with the company's sustainability endeavors and coinciding with the State of Rhode Island's 2021 Act on Climate.  

Frequently Asked Questions (FAQ):

To speak to our analyst for a discussion on the above findings, click Speak to Analyst

TABLE OF CONTENTS
 
1 INTRODUCTION (Page No. - 43)
    1.1 STUDY OBJECTIVES 
    1.2 MARKET DEFINITION 
           1.2.1 INCLUSIONS AND EXCLUSIONS
    1.3 STUDY SCOPE 
           1.3.1 MARKET SEGMENTATION
           1.3.2 REGIONS COVERED
           1.3.3 YEARS CONSIDERED
    1.4 CURRENCY CONSIDERED 
    1.5 UNITS CONSIDERED 
    1.6 LIMITATIONS 
    1.7 STAKEHOLDERS 
    1.8 SUMMARY OF CHANGES 
 
2 RESEARCH METHODOLOGY (Page No. - 48)
    2.1 RESEARCH DATA 
          FIGURE 1 METAL RECYCLING MARKET: RESEARCH DESIGN
           2.1.1 SECONDARY DATA
                    2.1.1.1 Key data from secondary sources
           2.1.2 PRIMARY DATA
                    2.1.2.1 Key data from primary sources
                    2.1.2.2 Key industry insights
                    2.1.2.3 Breakdown of primary interviews
    2.2 MARKET SIZE ESTIMATION 
          FIGURE 2 MARKET SIZE ESTIMATION METHODOLOGY: BOTTOM-UP APPROACH
          FIGURE 3 MARKET SIZE ESTIMATION METHODOLOGY: TOP-DOWN APPROACH
           2.2.1 VOLUME MARKET APPROACH
                    2.2.1.1 Approach 1 (Based on type, by country)
                                FIGURE 4 MARKET SIZE ESTIMATION METHODOLOGY: BOTTOM-UP APPROACH, BY METAL TYPE
                    2.2.1.2 Approach 2 (Based on scrap type)
                                FIGURE 5 MARKET SIZE ESTIMATION METHODOLOGY, BY SCRAP TYPE
    2.3 DATA TRIANGULATION 
          FIGURE 6 DATA TRIANGULATION: METAL RECYCLING MARKET
    2.4 FACTOR ANALYSIS 
    2.5 IMPACT OF RECESSION 
    2.6 RESEARCH ASSUMPTIONS 
    2.7 RESEARCH LIMITATIONS 
    2.8 RISK ASSESSMENT 
 
3 EXECUTIVE SUMMARY (Page No. - 59)
    FIGURE 7 FERROUS METAL SEGMENT TO REGISTER HIGHER CAGR DURING FORECAST PERIOD
    FIGURE 8 OLD SCRAP SEGMENT TO WITNESS HIGHER GROWTH RATE DURING FORECAST PERIOD
    FIGURE 9 BUILDING & CONSTRUCTION TO BE LARGEST END-USE INDUSTRY OF METAL RECYCLING
    FIGURE 10 ASIA PACIFIC TO LEAD METAL RECYCLING MARKET
 
4 PREMIUM INSIGHTS (Page No. - 63)
    4.1 ATTRACTIVE OPPORTUNITIES FOR PLAYERS IN METAL RECYCLING MARKET 
          FIGURE 11 EMERGING ECONOMIES OFFER ATTRACTIVE OPPORTUNITIES IN METAL RECYCLING MARKET
    4.2 ASIA PACIFIC: METAL RECYCLING MARKET, BY TYPE AND COUNTRY 
          FIGURE 12 CHINA DOMINATED METAL RECYCLING MARKET IN 2023
    4.3 METAL RECYCLING MARKET, BY TYPE 
          FIGURE 13 FERROUS METALS SEGMENT TO LEAD OVERALL MARKET DURING FORECAST PERIOD
    4.4 METAL RECYCLING MARKET, BY SCRAP TYPE 
          FIGURE 14 OLD SCRAP TO REGISTER HIGHER GROWTH RATE DURING FORECAST PERIOD
    4.5 METAL RECYCLING MARKET, BY END-USE INDUSTRY 
          FIGURE 15 BUILDING & CONSTRUCTION TO LEAD METAL RECYCLING MARKET
    4.6 METAL RECYCLING MARKET, BY COUNTRY 
          FIGURE 16 CHINA PROJECTED TO REGISTER HIGHEST CAGR FROM 2024 TO 2029
 
5 MARKET OVERVIEW (Page No. - 67)
    5.1 INTRODUCTION 
    5.2 MARKET DYNAMICS 
          FIGURE 17 DRIVERS, RESTRAINTS, OPPORTUNITIES, AND CHALLENGES IN METAL RECYCLING MARKET
           5.2.1 DRIVERS
                    5.2.1.1 Growing demand from automotive, consumer electronics, and construction industries
                                FIGURE 18 GLOBAL VEHICLE PRODUCTION IN 2022 (THOUSAND UNITS)
                                FIGURE 19 GLOBAL ELECTRIC VEHICLE SALES, 2019–2023 (UNITS)
                                TABLE 1 POPULATION AND URBANIZATION, BY REGION, 2021–2050 (MILLION)
                                TABLE 2 POPULATION GROWTH, BY REGION, 2022–2050 (MILLION)
                    5.2.1.2 Expansion of steel industry
                                TABLE 3 GLOBAL CRUDE STEEL PRODUCTION, 2019–2023 (MILLION TONNES)
                                TABLE 4 USE OF RECYCLED STEEL FOR STEELMAKING IN KEY COUNTRIES/ REGIONS (MILLION TONNES)
                    5.2.1.3 Implementation of stringent regulations
           5.2.2 RESTRAINTS
                    5.2.2.1 Unorganized metal waste collection in developing countries
           5.2.3 OPPORTUNITIES
                    5.2.3.1 Establishment of net-zero emission targets
                    5.2.3.2 Recovery of metals from slag residue
           5.2.4 CHALLENGES
                    5.2.4.1 Growing complexity of products
 
6 INDUSTRY TRENDS (Page No. - 76)
    6.1 PORTER'S FIVE FORCES ANALYSIS 
          FIGURE 20 PORTER'S FIVE FORCES ANALYSIS: METAL RECYCLING MARKET
          TABLE 5 METAL RECYCLING MARKET: PORTER'S FIVE FORCES ANALYSIS
           6.1.1 THREAT OF NEW ENTRANTS
           6.1.2 THREAT OF SUBSTITUTES
           6.1.3 BARGAINING POWER OF SUPPLIERS
           6.1.4 BARGAINING POWER OF BUYERS
           6.1.5 INTENSITY OF COMPETITIVE RIVALRY
    6.2 VALUE CHAIN ANALYSIS 
          FIGURE 21 METAL RECYCLING MARKET: VALUE CHAIN ANALYSIS
    6.3 TRADE DATA ANALYSIS 
           6.3.1 EXPORT SCENARIO OF METAL RECYCLING MARKET
                    FIGURE 22 EXPORT OF FERROUS WASTE AND SCRAP; REMELTING SCRAP INGOTS OF IRON OR STEEL (EXCL. SLAG, SCALE, AND OTHER WASTE FROM THE PRODUCTION OF IRON OR STEEL; RADIOACTIVE WASTE AND SCRAP; FRAGMENTS OF PIGS, BLOCKS OR OTHER PRIMARY FORMS OF PIG IRON OR SPIEGELEISEN), BY KEY COUNTRIES, 2018–2022
           6.3.2 IMPORT SCENARIO OF METAL RECYCLING MARKET
                    FIGURE 23 IMPORT OF FERROUS WASTE AND SCRAP; REMELTING SCRAP INGOTS OF IRON OR STEEL (EXCL. SLAG, SCALE, AND OTHER WASTE FROM THE PRODUCTION OF IRON OR STEEL; RADIOACTIVE WASTE AND SCRAP; FRAGMENTS OF PIGS, BLOCKS OR OTHER PRIMARY FORMS OF PIG IRON OR SPIEGELEISEN, BY KEY COUNTRIES, 2018–2022
    6.4 MACROECONOMIC OVERVIEW 
           6.4.1 GLOBAL GDP OUTLOOK
                    TABLE 6 WORLD GDP GROWTH PROJECTION, 2019–2026 (USD BILLION)
    6.5 TECHNOLOGY ANALYSIS 
           6.5.1 KEY TECHNOLOGIES
                    6.5.1.1 Electric arc furnace (EAF)
                    6.5.1.2 Shredding and sorting technologies
           6.5.2 COMPLEMENTARY TECHNOLOGIES
                    6.5.2.1 Hydrometallurgical process
                    6.5.2.2 Pyrometallurgical process
    6.6 TARIFF AND REGULATORY LANDSCAPE 
           6.6.1 TARIFF RELATED TO METAL RECYCLING MARKET
                    TABLE 7 AVERAGE TARIFF, BY COUNTRY
           6.6.2 REGULATORY BODIES, GOVERNMENT AGENCIES, AND OTHER ORGANIZATIONS
                    TABLE 8 NORTH AMERICA: LIST OF REGULATORY BODIES, GOVERNMENT AGENCIES, AND OTHER ORGANIZATIONS
                    TABLE 9 EUROPE: LIST OF REGULATORY BODIES, GOVERNMENT AGENCIES, AND OTHER ORGANIZATIONS
                    TABLE 10 ASIA PACIFIC: LIST OF REGULATORY BODIES, GOVERNMENT AGENCIES, AND OTHER ORGANIZATIONS
                    TABLE 11 MIDDLE EAST & AFRICA: LIST OF REGULATORY BODIES, GOVERNMENT AGENCIES, AND OTHER ORGANIZATIONS
                    TABLE 12 SOUTH AMERICA: LIST OF REGULATORY BODIES, GOVERNMENT AGENCIES, AND OTHER ORGANIZATIONS
    6.7 CASE STUDY ANALYSIS 
          TABLE 13 RADIUS RECYCLING'S INTEGRATED APPROACH
          TABLE 14 OMNISOURCE, LLC 'S SUSTAINABLE PRACTICES
          TABLE 15 UPSTATE SHREDDING – WEITSMAN RECYCLING'S EXPANSION
    6.8 TRENDS AND DISRUPTIONS IMPACTING CUSTOMER BUSINESS 
          FIGURE 24 EMERGING TRENDS AND ADVANCEMENTS IN TECHNOLOGY TO IMPACT REVENUE MIX
    6.9 KEY CONFERENCES & EVENTS 
          TABLE 16 METAL RECYCLING MARKET: DETAILED LIST OF CONFERENCES & EVENTS, 2024–2025
    6.10 KEY STAKEHOLDERS AND BUYING CRITERIA 
           6.10.1 KEY STAKEHOLDERS IN BUYING PROCESS
                     FIGURE 25 INFLUENCE OF STAKEHOLDERS ON BUYING PROCESS FOR TOP END-USE INDUSTRIES
                     TABLE 17 INFLUENCE OF STAKEHOLDERS ON BUYING PROCESS IN METAL RECYCLING MARKET
           6.10.2 BUYING CRITERIA
                     FIGURE 26 KEY BUYING CRITERIA FOR TOP THREE END-USE INDUSTRIES
                     TABLE 18 KEY BUYING CRITERIA FOR TOP THREE END-USE INDUSTRIES
    6.11 ECOSYSTEM ANALYSIS 
           TABLE 19 METAL RECYCLING MARKET: ROLE IN ECOSYSTEM
           FIGURE 27 METAL RECYCLING MARKET: ECOSYSTEM MAP
    6.12 PATENT ANALYSIS 
           6.12.1 INTRODUCTION
           6.12.2 METHODOLOGY
                     FIGURE 28 NUMBER OF PATENTS GRANTED FOR METAL RECYCLING, 2013–2023
                     FIGURE 29 JURISDICTION ANALYSIS: REPUBLIC OF KOREA REGISTERED HIGHEST SHARE OF PATENTS, 2013–2023
                     TABLE 20 LIST OF MAJOR PATENTS IN METAL RECYCLING MARKET, 2022–2023
    6.13 PRICING ANALYSIS 
           6.13.1 AVERAGE SELLING PRICE TREND OF KEY PLAYERS, BY TYPE
                     TABLE 21 AVERAGE SELLING PRICE OF KEY PLAYERS, BY TYPE (USD/TON)
           6.13.2 AVERAGE SELLING PRICE, BY REGION
                     FIGURE 30 AVERAGE SELLING PRICE FOR FERROUS METALS, BY REGION (USD/TON)
                     TABLE 22 AVERAGE SELLING PRICE OF KEY PLAYERS FOR FERROUS METALS, BY REGION, 2023–2029 (USD/TON)
                     FIGURE 31 AVERAGE SELLING PRICE FOR NONFERROUS METALS, BY REGION (USD/TON)
                     TABLE 23 AVERAGE SELLING PRICE OF KEY PLAYERS FOR NONFERROUS METALS, BY REGION, 2023–2029 (USD/TON)
           6.13.3 INVESTMENT LANDSCAPE AND FUNDING SCENARIO
                     FIGURE 32 INVESTOR DEALS AND FUNDING IN METAL RECYCLING SOARED IN 2023
 
7 METAL RECYCLING MARKET, BY EQUIPMENT USED (Page No. - 103)
    7.1 INTRODUCTION 
    7.2 SHREDDER 
           7.2.1 MOST WIDELY USED EQUIPMENT IN METAL RECYCLING INDUSTRY
    7.3 SHEARING 
           7.3.1 RISE IN INTEGRATION AND AUTOMATION TECHNOLOGY TO AUGMENT DEMAND FOR SHEARING EQUIPMENT
    7.4 GRANULATION MACHINE 
           7.4.1 GRANULATION USED TO REDUCE WASTE AND PROMOTE SUSTAINABILITY
    7.5 BRIQUETTING MACHINE 
           7.5.1 NEED FOR COST SAVINGS AND ENHANCED EFFICIENCY TO DRIVE DEMAND
 
8 METAL RECYCLING MARKET, BY SCRAP TYPE (Page No. - 106)
    8.1 INTRODUCTION 
          FIGURE 33 OLD SCRAP SEGMENT TO DOMINATE OVERALL MARKET DURING FORECAST PERIOD
          TABLE 24 METAL RECYCLING MARKET, BY SCRAP TYPE, 2019–2021 (USD MILLION)
          TABLE 25 METAL RECYCLING MARKET, BY SCRAP TYPE, 2022–2029 (USD MILLION)
          TABLE 26 METAL RECYCLING MARKET, BY SCRAP TYPE, 2019–2021 (MILLION TON)
          TABLE 27 METAL RECYCLING MARKET, BY SCRAP TYPE, 2022–2029 (MILLION TON)
    8.2 OLD SCRAP 
           8.2.1 OLD SCRAP SEGMENT TO REGISTER HIGHER CAGR DURING FORECAST PERIOD
    8.3 NEW SCRAP 
           8.3.1 AUTOMOTIVE INDUSTRY TO FUEL GROWTH OF NEW SCRAP SEGMENT
 
9 METAL RECYCLING MARKET, BY TYPE (Page No. - 111)
    9.1 INTRODUCTION 
          FIGURE 34 FERROUS METALS SEGMENT TO DOMINATE MARKET DURING FORECAST PERIOD
          TABLE 28 METAL RECYCLING MARKET, BY TYPE, 2019–2021 (USD MILLION)
          TABLE 29 METAL RECYCLING MARKET, BY TYPE, 2022–2029 (USD MILLION)
          TABLE 30 METAL RECYCLING MARKET, BY TYPE, 2019–2021 (MILLION TON)
          TABLE 31 METAL RECYCLING MARKET, BY TYPE, 2022–2029 (MILLION TON)
    9.2 FERROUS METALS 
           9.2.1 INCREASING SCRAP CONSUMPTION AND RECYCLING RATES TO PROPEL DEMAND
    9.3 NON-FERROUS METALS 
           9.3.1 INCREASING DEMAND FOR NON-FERROUS METALS TO DRIVE MARKET
 
10 METAL RECYCLING MARKET, BY END-USE INDUSTRY (Page No. - 116)
     10.1 INTRODUCTION 
             FIGURE 35 BUILDING & CONSTRUCTION TO BE LARGEST END USER IN METAL RECYCLING MARKET
             TABLE 32 METAL RECYCLING MARKET, BY END-USE INDUSTRY, 2019–2021 (USD MILLION)
             TABLE 33 METAL RECYCLING MARKET, BY END-USE INDUSTRY, 2022–2029 (USD MILLION)
             TABLE 34 METAL RECYCLING MARKET, BY END-USE INDUSTRY, 2019–2021 (MILLION TON)
             TABLE 35 METAL RECYCLING MARKET, BY END-USE INDUSTRY, 2022–2029 (MILLION TON)
     10.2 BUILDING & CONSTRUCTION 
             10.2.1 INTEGRATING RECYCLED STEEL IN CONSTRUCTION TO DRIVE MARKET
     10.3 AUTOMOTIVE 
             10.3.1 INCREASE IN ADOPTION OF ELECTRIC VEHICLES AND AUTOMAKERS' FOCUS ON SUSTAINABILITY TO BOOST MARKET
     10.4 EQUIPMENT MANUFACTURING 
             10.4.1 ADOPTION OF EXTENDED PRODUCER RESPONSIBILITY (EPR) PROGRAMS TO DRIVE MARKET
     10.5 SHIPBUILDING 
             10.5.1 ENVIRONMENTAL RESPONSIBILITY IN SHIPBUILDING INDUSTRY TO SUPPORT MARKET GROWTH
     10.6 PACKAGING 
             10.6.1 IMPLEMENTATION OF MORE STRINGENT REGULATIONS BY GOVERNMENTS TO FUEL GROWTH
     10.7 CONSUMER APPLIANCES 
             10.7.1 INNOVATIONS IN RECYCLING TECHNOLOGIES TO SUPPORT MARKET GROWTH
     10.8 OTHER END-USE INDUSTRIES 
 
11 METAL RECYCLING MARKET, BY REGION (Page No. - 123)
     11.1 INTRODUCTION 
             FIGURE 36 METAL RECYCLING MARKET GROWTH, BY COUNTRY (2024–2029)
             TABLE 36 METAL RECYCLING MARKET, BY REGION, 2019–2021 (USD MILLION)
             TABLE 37 METAL RECYCLING MARKET, BY REGION, 2022–2029 (USD MILLION)
             TABLE 38 METAL RECYCLING MARKET, BY REGION, 2019–2021 (MILLION TON)
             TABLE 39 METAL RECYCLING MARKET, BY REGION, 2022–2029 (MILLION TON)
     11.2 ASIA PACIFIC 
             11.2.1 RECESSION IMPACT
                        FIGURE 37 ASIA PACIFIC: METAL RECYCLING MARKET SNAPSHOT
                        TABLE 40 ASIA PACIFIC: METAL RECYCLING MARKET, BY COUNTRY, 2019–2021 (USD MILLION)
                        TABLE 41 ASIA PACIFIC: METAL RECYCLING MARKET, BY COUNTRY, 2022–2029 (USD MILLION)
                        TABLE 42 ASIA PACIFIC: METAL RECYCLING MARKET, BY COUNTRY, 2019–2021 (MILLION TON)
                        TABLE 43 ASIA PACIFIC: METAL RECYCLING MARKET, BY COUNTRY, 2022–2029 (MILLION TON)
                        TABLE 44 ASIA PACIFIC: METAL RECYCLING MARKET, BY TYPE, 2019–2021 (USD MILLION)
                        TABLE 45 ASIA PACIFIC: METAL RECYCLING MARKET, BY TYPE, 2022–2029 (USD MILLION)
                        TABLE 46 ASIA PACIFIC: METAL RECYCLING MARKET, BY TYPE, 2019–2021 (MILLION TON)
                        TABLE 47 ASIA PACIFIC: METAL RECYCLING MARKET, BY TYPE, 2022–2029 (MILLION TON)
                        TABLE 48 ASIA PACIFIC: METAL RECYCLING MARKET, BY SCRAP TYPE, 2019–2021 (USD MILLION)
                        TABLE 49 ASIA PACIFIC: METAL RECYCLING MARKET, BY SCRAP TYPE, 2022–2029 (USD MILLION)
                        TABLE 50 ASIA PACIFIC: METAL RECYCLING MARKET, BY SCRAP TYPE, 2019–2021 (MILLION TON)
                        TABLE 51 ASIA PACIFIC: METAL RECYCLING MARKET, BY SCRAP TYPE, 2022–2029 (MILLION TON)
                        TABLE 52 ASIA PACIFIC: METAL RECYCLING MARKET, BY END-USE INDUSTRY, 2019–2021 (USD MILLION)
                        TABLE 53 ASIA PACIFIC: METAL RECYCLING MARKET, BY END-USE INDUSTRY, 2022–2029 (USD MILLION)
                        TABLE 54 ASIA PACIFIC: METAL RECYCLING MARKET, BY END-USE INDUSTRY, 2019–2021 (MILLION TON)
                        TABLE 55 ASIA PACIFIC: METAL RECYCLING MARKET, BY END-USE INDUSTRY, 2022–2029 (MILLION TON)
             11.2.2 CHINA
                        11.2.2.1 Strict environmental regulations and rapid industrialization to drive demand
                                      TABLE 56 CHINA: METAL RECYCLING MARKET, BY TYPE, 2019–2021 (USD MILLION)
                                      TABLE 57 CHINA: METAL RECYCLING MARKET, BY TYPE, 2022–2029 (USD MILLION)
                                      TABLE 58 CHINA: METAL RECYCLING MARKET, BY TYPE, 2019–2021 (MILLION TON)
                                      TABLE 59 CHINA: METAL RECYCLING MARKET, BY TYPE, 2022–2029 (MILLION TON)
                                      TABLE 60 CHINA: METAL RECYCLING MARKET, BY SCRAP TYPE, 2019–2021 (USD MILLION)
                                      TABLE 61 CHINA: METAL RECYCLING MARKET, BY SCRAP TYPE, 2022–2029 (USD MILLION)
                                      TABLE 62 CHINA: METAL RECYCLING MARKET, BY SCRAP TYPE, 2019–2021 (MILLION TON)
                                      TABLE 63 CHINA: METAL RECYCLING MARKET, BY SCRAP TYPE, 2022–2029 (MILLION TON)
             11.2.3 INDIA
                        11.2.3.1 Growth in construction industry to fuel demand
                                      TABLE 64 INDIA: METAL RECYCLING MARKET, BY TYPE, 2019–2021 (USD MILLION)
                                      TABLE 65 INDIA: METAL RECYCLING MARKET, BY TYPE, 2022–2029 (USD MILLION)
                                      TABLE 66 INDIA: METAL RECYCLING MARKET, BY TYPE, 2019–2021 (MILLION TON)
                                      TABLE 67 INDIA: METAL RECYCLING MARKET, BY TYPE, 2022–2029 (MILLION TON)
                                      TABLE 68 INDIA: METAL RECYCLING MARKET, BY SCRAP TYPE, 2019–2021 (USD MILLION)
                                      TABLE 69 INDIA: METAL RECYCLING MARKET, BY SCRAP TYPE, 2022–2029 (USD MILLION)
                                      TABLE 70 INDIA: METAL RECYCLING MARKET, BY SCRAP TYPE, 2019–2021 (MILLION TON)
                                      TABLE 71 INDIA: METAL RECYCLING MARKET, BY SCRAP TYPE, 2022–2029 (MILLION TON)
             11.2.4 JAPAN
                        11.2.4.1 Surge in automotive and electronics industries to drive growth
                                      TABLE 72 JAPAN: METAL RECYCLING MARKET, BY TYPE, 2019–2021 (USD MILLION)
                                      TABLE 73 JAPAN: METAL RECYCLING MARKET, BY TYPE, 2022–2029 (USD MILLION)
                                      TABLE 74 JAPAN: METAL RECYCLING MARKET, BY TYPE, 2019–2021 (MILLION TON)
                                      TABLE 75 JAPAN: METAL RECYCLING MARKET, BY TYPE, 2022–2029 (MILLION TON)
                                      TABLE 76 JAPAN: METAL RECYCLING MARKET, BY SCRAP TYPE, 2019–2021 (USD MILLION)
                                      TABLE 77 JAPAN: METAL RECYCLING MARKET, BY SCRAP TYPE, 2022–2029 (USD MILLION)
                                      TABLE 78 JAPAN: METAL RECYCLING MARKET, BY SCRAP TYPE, 2019–2021 (MILLION TON)
                                      TABLE 79 JAPAN: METAL RECYCLING MARKET, BY SCRAP TYPE, 2022–2029 (MILLION TON)
             11.2.5 AUSTRALIA
                        11.2.5.1 Growing population and s                                      TABLE economic climate to support market growth
                                      TABLE 80 AUSTRALIA: METAL RECYCLING MARKET, BY TYPE, 2019–2021 (USD MILLION)
                                      TABLE 81 AUSTRALIA: METAL RECYCLING MARKET, BY TYPE, 2022–2029 (USD MILLION)
                                      TABLE 82 AUSTRALIA: METAL RECYCLING MARKET, BY TYPE, 2019–2021 (MILLION TON)
                                      TABLE 83 AUSTRALIA: METAL RECYCLING MARKET, BY TYPE, 2022–2029 (MILLION TON)
                                      TABLE 84 AUSTRALIA: METAL RECYCLING MARKET, BY SCRAP TYPE, 2019–2021 (USD MILLION)
                                      TABLE 85 AUSTRALIA: METAL RECYCLING MARKET, BY SCRAP TYPE, 2022–2029 (USD MILLION)
                                      TABLE 86 AUSTRALIA: METAL RECYCLING MARKET, BY SCRAP TYPE, 2019–2021 (MILLION TON)
                                      TABLE 87 AUSTRALIA: METAL RECYCLING MARKET, BY SCRAP TYPE, 2022–2029 (MILLION TON)
             11.2.6 SOUTH KOREA
                        11.2.6.1 Growing construction and automotive industries to drive demand
                                      TABLE 88 SOUTH KOREA: METAL RECYCLING MARKET, BY TYPE, 2019–2021 (USD MILLION)
                                      TABLE 89 SOUTH KOREA: METAL RECYCLING MARKET, BY TYPE, 2022–2029 (USD MILLION)
                                      TABLE 90 SOUTH KOREA: METAL RECYCLING MARKET, BY TYPE, 2019–2021 (MILLION TON)
                                      TABLE 91 SOUTH KOREA: METAL RECYCLING MARKET, BY TYPE, 2022–2029 (MILLION TON)
                                      TABLE 92 SOUTH KOREA: METAL RECYCLING MARKET, BY SCRAP TYPE, 2019–2021 (USD MILLION)
                                      TABLE 93 SOUTH KOREA: METAL RECYCLING MARKET, BY SCRAP TYPE, 2022–2029 (USD MILLION)
                                      TABLE 94 SOUTH KOREA: METAL RECYCLING MARKET, BY SCRAP TYPE, 2019–2021 (MILLION TON)
                                      TABLE 95 SOUTH KOREA: METAL RECYCLING MARKET, BY SCRAP TYPE, 2022–2029 (MILLION TON)
             11.2.7 REST OF ASIA PACIFIC
                        TABLE 96 REST OF ASIA PACIFIC: METAL RECYCLING MARKET, BY TYPE, 2019–2021 (USD MILLION)
                        TABLE 97 REST OF ASIA PACIFIC: METAL RECYCLING MARKET, BY TYPE, 2022–2029 (USD MILLION)
                        TABLE 98 REST OF ASIA PACIFIC: METAL RECYCLING MARKET, BY TYPE, 2019–2021 (MILLION TON)
                        TABLE 99 REST OF ASIA PACIFIC: METAL RECYCLING MARKET, BY TYPE, 2022–2029 (MILLION TON)
                        TABLE 100 REST OF ASIA PACIFIC: METAL RECYCLING MARKET, BY SCRAP TYPE, 2019–2021 (USD MILLION)
                        TABLE 101 REST OF ASIA PACIFIC: METAL RECYCLING MARKET, BY SCRAP TYPE, 2022–2029 (USD MILLION)
                        TABLE 102 REST OF ASIA PACIFIC: METAL RECYCLING MARKET, BY SCRAP TYPE, 2019–2021 (MILLION TON)
                        TABLE 103 REST OF ASIA PACIFIC: METAL RECYCLING MARKET, BY SCRAP TYPE, 2022–2029 (MILLION TON)
     11.3 NORTH AMERICA 
             11.3.1 IMPACT OF RECESSION
                        TABLE 104 NORTH AMERICA: METAL RECYCLING MARKET, BY COUNTRY, 2019–2021 (USD MILLION)
                        TABLE 105 NORTH AMERICA: METAL RECYCLING MARKET, BY COUNTRY, 2022–2029 (USD MILLION)
                        TABLE 106 NORTH AMERICA: METAL RECYCLING MARKET, BY COUNTRY, 2019–2021 (MILLION TON)
                        TABLE 107 NORTH AMERICA: METAL RECYCLING MARKET, BY COUNTRY, 2022–2029 (MILLION TON)
                        TABLE 108 NORTH AMERICA: METAL RECYCLING MARKET, BY TYPE, 2019–2021 (USD MILLION)
                        TABLE 109 NORTH AMERICA: METAL RECYCLING MARKET, BY TYPE, 2022–2029 (USD MILLION)
                        TABLE 110 NORTH AMERICA: METAL RECYCLING MARKET, BY TYPE, 2019–2021 (MILLION TON)
                        TABLE 111 NORTH AMERICA: METAL RECYCLING MARKET, BY TYPE, 2022–2029 (MILLION TON)
                        TABLE 112 NORTH AMERICA: METAL RECYCLING MARKET, BY SCRAP TYPE, 2019–2021 (USD MILLION)
                        TABLE 113 NORTH AMERICA: METAL RECYCLING MARKET, BY SCRAP TYPE, 2022–2029 (USD MILLION)
                        TABLE 114 NORTH AMERICA: METAL RECYCLING MARKET, BY SCRAP TYPE, 2019–2021 (MILLION TON)
                        TABLE 115 NORTH AMERICA: METAL RECYCLING MARKET, BY SCRAP TYPE, 2022–2029 (MILLION TON)
                        TABLE 116 NORTH AMERICA: METAL RECYCLING MARKET, BY END-USE INDUSTRY, 2019–2021 (USD MILLION)
                        TABLE 117 NORTH AMERICA: METAL RECYCLING MARKET, BY END-USE INDUSTRY, 2022–2029 (USD MILLION)
                        TABLE 118 NORTH AMERICA: METAL RECYCLING MARKET, BY END-USE INDUSTRY, 2019–2021 (MILLION TON)
                        TABLE 119 NORTH AMERICA: METAL RECYCLING MARKET, BY END-USE INDUSTRY, 2022–2029 (MILLION TON)
             11.3.2 US
                        11.3.2.1 Growing construction sector to drive market
                                      TABLE 120 US: METAL RECYCLING MARKET, BY TYPE, 2019–2021 (USD MILLION)
                                      TABLE 121 US: METAL RECYCLING MARKET, BY TYPE, 2022–2029 (USD MILLION)
                                      TABLE 122 US: METAL RECYCLING MARKET, BY TYPE, 2019–2021 (MILLION TON)
                                      TABLE 123 US: METAL RECYCLING MARKET, BY TYPE, 2022–2029 (MILLION TON)
                                      TABLE 124 US: METAL RECYCLING MARKET, BY SCRAP TYPE, 2019–2021 (USD MILLION)
                                      TABLE 125 US: METAL RECYCLING MARKET, BY SCRAP TYPE, 2022–2029 (USD MILLION)
                                      TABLE 126 US: METAL RECYCLING MARKET, BY SCRAP TYPE, 2019–2021 (MILLION TON)
                                      TABLE 127 US: METAL RECYCLING MARKET, BY SCRAP TYPE, 2022–2029 (MILLION TON)
             11.3.3 CANADA
                        11.3.3.1 Increasing electric vehicle adoption and environmental regulations to propel market
                                      TABLE 128 CANADA: METAL RECYCLING MARKET, BY TYPE, 2019–2021 (USD MILLION)
                                      TABLE 129 CANADA: METAL RECYCLING MARKET, BY TYPE, 2022–2029 (USD MILLION)
                                      TABLE 130 CANADA: METAL RECYCLING MARKET, BY TYPE, 2019–2021 (MILLION TON)
                                      TABLE 131 CANADA: METAL RECYCLING MARKET, BY TYPE, 2022–2029 (MILLION TON)
                                      TABLE 132 CANADA: METAL RECYCLING MARKET, BY SCRAP TYPE, 2019–2021 (USD MILLION)
                                      TABLE 133 CANADA: METAL RECYCLING MARKET, BY SCRAP TYPE, 2022–2029 (USD MILLION)
                                      TABLE 134 CANADA: METAL RECYCLING MARKET, BY SCRAP TYPE, 2019–2021 (MILLION TON)
                                      TABLE 135 CANADA: METAL RECYCLING MARKET, BY SCRAP TYPE, 2022–2029 (MILLION TON)
             11.3.4 MEXICO
                        11.3.4.1 Mexico's Green Building initiatives to fuel market growth
                                      TABLE 136 MEXICO: METAL RECYCLING MARKET, BY TYPE, 2019–2021 (USD MILLION)
                                      TABLE 137 MEXICO: METAL RECYCLING MARKET, BY TYPE, 2022–2029 (USD MILLION)
                                      TABLE 138 MEXICO: METAL RECYCLING MARKET, BY TYPE, 2019–2021 (MILLION TON)
                                      TABLE 139 MEXICO: METAL RECYCLING MARKET, BY TYPE, 2022–2029 (MILLION TON)
                                      TABLE 140 MEXICO: METAL RECYCLING MARKET, BY SCRAP TYPE, 2019–2021 (USD MILLION)
                                      TABLE 141 MEXICO: METAL RECYCLING MARKET, BY SCRAP TYPE, 2022–2029 (USD MILLION)
                                      TABLE 142 MEXICO: METAL RECYCLING MARKET, BY SCRAP TYPE, 2019–2021 (MILLION TON)
                                      TABLE 143 MEXICO: METAL RECYCLING MARKET, BY SCRAP TYPE, 2022–2029 (MILLION TON)
     11.4 EUROPE 
             11.4.1 IMPACT OF RECESSION
                        FIGURE 38 EUROPE: METAL RECYCLING MARKET SNAPSHOT
                        TABLE 144 EUROPE: METAL RECYCLING MARKET, BY COUNTRY, 2019–2021 (USD MILLION)
                        TABLE 145 EUROPE: METAL RECYCLING MARKET, BY COUNTRY, 2022–2029 (USD MILLION)
                        TABLE 146 EUROPE: METAL RECYCLING MARKET, BY COUNTRY, 2019–2021 (MILLION TON)
                        TABLE 147 EUROPE: METAL RECYCLING MARKET, BY COUNTRY, 2022–2029 (MILLION TON)
                        TABLE 148 EUROPE: METAL RECYCLING MARKET, BY TYPE, 2019–2021 (USD MILLION)
                        TABLE 149 EUROPE: METAL RECYCLING MARKET, BY TYPE, 2022–2029 (USD MILLION)
                        TABLE 150 EUROPE: METAL RECYCLING MARKET, BY TYPE, 2019–2021 (MILLION TON)
                        TABLE 151 EUROPE: METAL RECYCLING MARKET, BY TYPE, 2022–2029 (MILLION TON)
                        TABLE 152 EUROPE: METAL RECYCLING MARKET, BY SCRAP TYPE, 2019–2021 (USD MILLION)
                        TABLE 153 EUROPE: METAL RECYCLING MARKET, BY SCRAP TYPE, 2022–2029 (USD MILLION)
                        TABLE 154 EUROPE: METAL RECYCLING MARKET, BY SCRAP TYPE, 2019–2021 (MILLION TON)
                        TABLE 155 EUROPE: METAL RECYCLING MARKET, BY SCRAP TYPE, 2022–2029 (MILLION TON)
                        TABLE 156 EUROPE: METAL RECYCLING MARKET, BY END-USE INDUSTRY, 2019–2021 (USD MILLION)
                        TABLE 157 EUROPE: METAL RECYCLING MARKET, BY END-USE INDUSTRY, 2022–2029 (USD MILLION)
                        TABLE 158 EUROPE: METAL RECYCLING MARKET, BY END-USE INDUSTRY, 2019–2021 (MILLION TON)
                        TABLE 159 EUROPE: METAL RECYCLING MARKET, BY END-USE INDUSTRY, 2022–2029 (MILLION TON)
             11.4.2 GERMANY
                        11.4.2.1 Advancing circular economy and automotive sector to drive market
                                      TABLE 160 GERMANY: METAL RECYCLING MARKET, BY TYPE, 2019–2021 (USD MILLION)
                                      TABLE 161 GERMANY: METAL RECYCLING MARKET, BY TYPE, 2022–2029 (USD MILLION)
                                      TABLE 162 GERMANY: METAL RECYCLING MARKET, BY TYPE, 2019–2021 (MILLION TON)
                                      TABLE 163 GERMANY: METAL RECYCLING MARKET, BY TYPE, 2022–2029 (MILLION TON)
                                      TABLE 164 GERMANY: METAL RECYCLING MARKET, BY SCRAP TYPE, 2019–2021 (USD MILLION)
                                      TABLE 165 GERMANY: METAL RECYCLING MARKET, BY SCRAP TYPE, 2022–2029 (USD MILLION)
                                      TABLE 166 GERMANY: METAL RECYCLING MARKET, BY SCRAP TYPE, 2019–2021 (MILLION TON)
                                      TABLE 167 GERMANY: METAL RECYCLING MARKET, BY SCRAP TYPE, 2022–2029 (MILLION TON)
             11.4.3 UK
                        11.4.3.1 Market characterized by significant export of scrap metals
                                      TABLE 168 UK: METAL RECYCLING MARKET, BY TYPE, 2019–2021 (USD MILLION)
                                      TABLE 169 UK: METAL RECYCLING MARKET, BY TYPE, 2022–2029 (USD MILLION)
                                      TABLE 170 UK: METAL RECYCLING MARKET, BY TYPE, 2019–2021 (MILLION TON)
                                      TABLE 171 UK: METAL RECYCLING MARKET, BY TYPE, 2022–2029 (MILLION TON)
                                      TABLE 172 UK: METAL RECYCLING MARKET, BY SCRAP TYPE, 2019–2021 (USD MILLION)
                                      TABLE 173 UK: METAL RECYCLING MARKET, BY SCRAP TYPE, 2022–2029 (USD MILLION)
                                      TABLE 174 UK: METAL RECYCLING MARKET, BY SCRAP TYPE, 2019–2021 (MILLION TON)
                                      TABLE 175 UK: METAL RECYCLING MARKET, BY SCRAP TYPE, 2022–2029 (MILLION TON)
             11.4.4 FRANCE
                        11.4.4.1 Growing construction industry to drive market growth
                                      TABLE 176 FRANCE: METAL RECYCLING MARKET, BY TYPE, 2019–2021 (USD MILLION)
                                      TABLE 177 FRANCE: METAL RECYCLING MARKET, BY TYPE, 2022–2029 (USD MILLION)
                                      TABLE 178 FRANCE: METAL RECYCLING MARKET, BY TYPE, 2019–2021 (MILLION TON)
                                      TABLE 179 FRANCE: METAL RECYCLING MARKET, BY TYPE, 2022–2029 (MILLION TON)
                                      TABLE 180 FRANCE: METAL RECYCLING MARKET, BY SCRAP TYPE, 2019–2021 (USD MILLION)
                                      TABLE 181 FRANCE: METAL RECYCLING MARKET, BY SCRAP TYPE, 2022–2029 (USD MILLION)
                                      TABLE 182 FRANCE: METAL RECYCLING MARKET, BY SCRAP TYPE, 2019–2021 (MILLION TON)
                                      TABLE 183 FRANCE: METAL RECYCLING MARKET, BY SCRAP TYPE, 2022–2029 (MILLION TON)
             11.4.5 ITALY
                        11.4.5.1 Growing automotive sector to fuel market growth
                                      TABLE 184 ITALY: METAL RECYCLING MARKET, BY TYPE, 2019–2021 (USD MILLION)
                                      TABLE 185 ITALY: METAL RECYCLING MARKET, BY TYPE, 2022–2029 (USD MILLION)
                                      TABLE 186 ITALY: METAL RECYCLING MARKET, BY TYPE, 2019–2021 (MILLION TON)
                                      TABLE 187 ITALY: METAL RECYCLING MARKET, BY TYPE, 2022–2029 (MILLION TON)
                                      TABLE 188 ITALY: METAL RECYCLING MARKET, BY SCRAP TYPE, 2019–2021 (USD MILLION)
                                      TABLE 189 ITALY: METAL RECYCLING MARKET, BY SCRAP TYPE, 2022–2029 (USD MILLION)
                                      TABLE 190 ITALY: METAL RECYCLING MARKET, BY SCRAP TYPE, 2019–2021 (MILLION TON)
                                      TABLE 191 ITALY: METAL RECYCLING MARKET, BY SCRAP TYPE, 2022–2029 (MILLION TON)
             11.4.6 RUSSIA
                        11.4.6.1 Industrial strength and environmental commitment to fuel market growth
                                      TABLE 192 RUSSIA: METAL RECYCLING MARKET, BY TYPE, 2019–2021 (USD MILLION)
                                      TABLE 193 RUSSIA: METAL RECYCLING MARKET, BY TYPE, 2022–2029 (USD MILLION)
                                      TABLE 194 RUSSIA: METAL RECYCLING MARKET, BY TYPE, 2019–2021 (MILLION TON)
                                      TABLE 195 RUSSIA: METAL RECYCLING MARKET, BY TYPE, 2022–2029 (MILLION TON)
                                      TABLE 196 RUSSIA: METAL RECYCLING MARKET, BY SCRAP TYPE, 2019–2021 (USD MILLION)
                                      TABLE 197 RUSSIA: METAL RECYCLING MARKET, BY SCRAP TYPE, 2022–2029 (USD MILLION)
                                      TABLE 198 RUSSIA: METAL RECYCLING MARKET, BY SCRAP TYPE, 2019–2021 (MILLION TON)
                                      TABLE 199 RUSSIA: METAL RECYCLING MARKET, BY SCRAP TYPE, 2022–2029 (MILLION TON)
             11.4.7 SPAIN
                        11.4.7.1 Presence of strong industrial sector to support market growth
                                      TABLE 200 SPAIN: METAL RECYCLING MARKET, BY TYPE, 2019–2021 (USD MILLION)
                                      TABLE 201 SPAIN: METAL RECYCLING MARKET, BY TYPE, 2022–2029 (USD MILLION)
                                      TABLE 202 SPAIN: METAL RECYCLING MARKET, BY TYPE, 2019–2021 (MILLION TON)
                                      TABLE 203 SPAIN: METAL RECYCLING MARKET, BY TYPE, 2022–2029 (MILLION TON)
                                      TABLE 204 SPAIN: METAL RECYCLING MARKET, BY SCRAP TYPE, 2019–2021 (USD MILLION)
                                      TABLE 205 SPAIN: METAL RECYCLING MARKET, BY SCRAP TYPE, 2022–2029 (USD MILLION)
                                      TABLE 206 SPAIN: METAL RECYCLING MARKET, BY SCRAP TYPE, 2019–2021 (MILLION TON)
                                      TABLE 207 SPAIN: METAL RECYCLING MARKET, BY SCRAP TYPE, 2022–2029 (MILLION TON)
             11.4.8 TURKEY
                        11.4.8.1 Flourishing steel industry to drive metal recycling
                                      TABLE 208 TURKEY: METAL RECYCLING MARKET, BY TYPE, 2019–2021 (USD MILLION)
                                      TABLE 209 TURKEY: METAL RECYCLING MARKET, BY TYPE, 2022–2029 (USD MILLION)
                                      TABLE 210 TURKEY: METAL RECYCLING MARKET, BY TYPE, 2019–2021 (MILLION TON)
                                      TABLE 211 TURKEY: METAL RECYCLING MARKET, BY TYPE, 2022–2029 (MILLION TON)
                                      TABLE 212 TURKEY: METAL RECYCLING MARKET, BY SCRAP TYPE, 2019–2021 (USD MILLION)
                                      TABLE 213 TURKEY: METAL RECYCLING MARKET, BY SCRAP TYPE, 2022–2029 (USD MILLION)
                                      TABLE 214 TURKEY: METAL RECYCLING MARKET, BY SCRAP TYPE, 2019–2021 (MILLION TON)
                                      TABLE 215 TURKEY: METAL RECYCLING MARKET, BY SCRAP TYPE, 2022–2029 (MILLION TON)
             11.4.9 REST OF EUROPE
                        TABLE 216 REST OF EUROPE: METAL RECYCLING MARKET, BY TYPE, 2019–2021 (USD MILLION)
                        TABLE 217 REST OF EUROPE: METAL RECYCLING MARKET, BY TYPE, 2022–2029 (USD MILLION)
                        TABLE 218 REST OF EUROPE: METAL RECYCLING MARKET, BY TYPE, 2019–2021 (MILLION TON)
                        TABLE 219 REST OF EUROPE: METAL RECYCLING MARKET, BY TYPE, 2022–2029 (MILLION TON)
                        TABLE 220 REST OF EUROPE: METAL RECYCLING MARKET, BY SCRAP TYPE, 2019–2021 (USD MILLION)
                        TABLE 221 REST OF EUROPE: METAL RECYCLING MARKET, BY SCRAP TYPE, 2022–2029 (USD MILLION)
                        TABLE 222 REST OF EUROPE: METAL RECYCLING MARKET, BY SCRAP TYPE, 2019–2021 (MILLION TON)
                        TABLE 223 REST OF EUROPE: METAL RECYCLING MARKET, BY SCRAP TYPE, 2022–2029 (MILLION TON)
     11.5 MIDDLE EAST & AFRICA 
             11.5.1 RECESSION IMPACT
                        TABLE 224 MIDDLE EAST & AFRICA: METAL RECYCLING MARKET, BY COUNTRY, 2019–2021 (USD MILLION)
                        TABLE 225 MIDDLE EAST & AFRICA: METAL RECYCLING MARKET, BY COUNTRY, 2022–2029 (USD MILLION)
                        TABLE 226 MIDDLE EAST & AFRICA: METAL RECYCLING MARKET, BY COUNTRY, 2019–2021 (MILLION TON)
                        TABLE 227 MIDDLE EAST & AFRICA: METAL RECYCLING MARKET, BY COUNTRY, 2022–2029 (MILLION TON)
                        TABLE 228 MIDDLE EAST & AFRICA: METAL RECYCLING MARKET, BY TYPE, 2019–2021 (USD MILLION)
                        TABLE 229 MIDDLE EAST & AFRICA: METAL RECYCLING MARKET, BY TYPE, 2022–2029 (USD MILLION)
                        TABLE 230 MIDDLE EAST & AFRICA: METAL RECYCLING MARKET, BY TYPE, 2019–2021 (MILLION TON)
                        TABLE 231 MIDDLE EAST & AFRICA: METAL RECYCLING MARKET, BY TYPE, 2022–2029 (MILLION TON)
                        TABLE 232 MIDDLE EAST & AFRICA: METAL RECYCLING MARKET, BY SCRAP TYPE, 2019–2021 (USD MILLION)
                        TABLE 233 MIDDLE EAST & AFRICA: METAL RECYCLING MARKET, BY SCRAP TYPE, 2022–2029 (USD MILLION)
                        TABLE 234 MIDDLE EAST & AFRICA: METAL RECYCLING MARKET, BY SCRAP TYPE, 2019–2021 (MILLION TON)
                        TABLE 235 MIDDLE EAST & AFRICA: METAL RECYCLING MARKET, BY SCRAP TYPE, 2022–2029 (MILLION TON)
                        TABLE 236 MIDDLE EAST & AFRICA: METAL RECYCLING MARKET, BY END-USE INDUSTRY, 2019–2021 (USD MILLION)
                        TABLE 237 MIDDLE EAST & AFRICA: METAL RECYCLING MARKET, BY END-USE INDUSTRY, 2022–2029 (USD MILLION)
                        TABLE 238 MIDDLE EAST & AFRICA: METAL RECYCLING MARKET, BY END-USE INDUSTRY, 2019–2021 (MILLION TON)
                        TABLE 239 MIDDLE EAST & AFRICA: METAL RECYCLING MARKET, BY END-USE INDUSTRY, 2022–2029 (MILLION TON)
             11.5.2 GCC COUNTRIES
                        TABLE 240 GCC COUNTRIES: METAL RECYCLING MARKET, BY TYPE, 2019–2021 (USD MILLION)
                        TABLE 241 GCC COUNTRIES: METAL RECYCLING MARKET, BY TYPE, 2022–2029 (USD MILLION)
                        TABLE 242 GCC COUNTRIES: METAL RECYCLING MARKET, BY TYPE, 2019–2021 (MILLION TON)
                        TABLE 243 GCC COUNTRIES: METAL RECYCLING MARKET, BY TYPE, 2022–2029 (MILLION TON)
                        TABLE 244 GCC COUNTRIES: METAL RECYCLING MARKET, BY SCRAP TYPE, 2019–2021 (USD MILLION)
                        TABLE 245 GCC COUNTRIES: METAL RECYCLING MARKET, BY SCRAP TYPE, 2022–2029 (USD MILLION)
                        TABLE 246 GCC COUNTRIES: METAL RECYCLING MARKET, BY SCRAP TYPE, 2019–2021 (MILLION TON)
                        TABLE 247 GCC COUNTRIES: METAL RECYCLING MARKET, BY SCRAP TYPE, 2022–2029 (MILLION TON)
                        11.5.2.1 Saudi Arabia
                                     11.5.2.1.1 Saudi Vision 2030 to play a crucial role in driving market
                                                      TABLE 248 SAUDI ARABIA: METAL RECYCLING MARKET, BY TYPE, 2019–2021 (USD MILLION)
                                                      TABLE 249 SAUDI ARABIA: METAL RECYCLING MARKET, BY TYPE, 2022–2029 (USD MILLION)
                                                      TABLE 250 SAUDI ARABIA: METAL RECYCLING MARKET, BY TYPE, 2019–2021 (MILLION TON)
                                                      TABLE 251 SAUDI ARABIA: METAL RECYCLING MARKET, BY TYPE, 2022–2029 (MILLION TON)
                                                      TABLE 252 SAUDI ARABIA: METAL RECYCLING MARKET, BY SCRAP TYPE, 2019–2021 (USD MILLION)
                                                      TABLE 253 SAUDI ARABIA: METAL RECYCLING MARKET, BY SCRAP TYPE, 2022–2029 (USD MILLION)
                                                      TABLE 254 SAUDI ARABIA: METAL RECYCLING MARKET, BY SCRAP TYPE, 2019–2021 (MILLION TON)
                                                      TABLE 255 SAUDI ARABIA: METAL RECYCLING MARKET, BY SCRAP TYPE, 2022–2029 (MILLION TON)
                        11.5.2.2 UAE
                                     11.5.2.2.1 Rapid urbanization and infrastructure development to drive market
                                                      TABLE 256 UAE: METAL RECYCLING MARKET, BY TYPE, 2019–2021 (USD MILLION)
                                                      TABLE 257 UAE: METAL RECYCLING MARKET, BY TYPE, 2022–2029 (USD MILLION)
                                                      TABLE 258 UAE: METAL RECYCLING MARKET, BY TYPE, 2019–2021 (MILLION TON)
                                                      TABLE 259 UAE: METAL RECYCLING MARKET, BY TYPE, 2022–2029 (MILLION TON)
                                                      TABLE 260 UAE: METAL RECYCLING MARKET, BY SCRAP TYPE, 2019–2021 (USD MILLION)
                                                      TABLE 261 UAE: METAL RECYCLING MARKET, BY SCRAP TYPE, 2022–2029 (USD MILLION)
                                                      TABLE 262 UAE: METAL RECYCLING MARKET, BY SCRAP TYPE, 2019–2021 (MILLION TON)
                                                      TABLE 263 UAE: METAL RECYCLING MARKET, BY SCRAP TYPE, 2022–2029 (MILLION TON)
                        11.5.2.3 Rest of GCC countries
                                      TABLE 264 REST OF GCC COUNTRIES: METAL RECYCLING MARKET, BY TYPE, 2019–2021 (USD MILLION)
                                      TABLE 265 REST OF GCC COUNTRIES: METAL RECYCLING MARKET, BY TYPE, 2022–2029 (USD MILLION)
                                      TABLE 266 REST OF GCC COUNTRIES: METAL RECYCLING MARKET, BY TYPE, 2019–2021 (MILLION TON)
                                      TABLE 267 REST OF GCC COUNTRIES: METAL RECYCLING MARKET, BY TYPE, 2022–2029 (MILLION TON)
                                      TABLE 268 REST OF GCC COUNTRIES: METAL RECYCLING MARKET, BY SCRAP TYPE, 2019–2021 (USD MILLION)
                                      TABLE 269 REST OF GCC COUNTRIES: METAL RECYCLING MARKET, BY SCRAP TYPE, 2022–2029 (USD MILLION)
                                      TABLE 270 REST OF GCC COUNTRIES: METAL RECYCLING MARKET, BY SCRAP TYPE, 2019–2021 (MILLION TON)
                                      TABLE 271 REST OF GCC COUNTRIES: METAL RECYCLING MARKET, BY SCRAP TYPE, 2022–2029 (MILLION TON)
             11.5.3 SOUTH AFRICA
                        11.5.3.1 Government initiatives to support growth of metal recycling market
                                      TABLE 272 SOUTH AFRICA: METAL RECYCLING MARKET, BY TYPE, 2019–2021 (USD MILLION)
                                      TABLE 273 SOUTH AFRICA: METAL RECYCLING MARKET, BY TYPE, 2022–2029 (USD MILLION)
                                      TABLE 274 SOUTH AFRICA: METAL RECYCLING MARKET, BY TYPE, 2019–2021 (MILLION TON)
                                      TABLE 275 SOUTH AFRICA: METAL RECYCLING MARKET, BY TYPE, 2022–2029 (MILLION TON)
                                      TABLE 276 SOUTH AFRICA: METAL RECYCLING MARKET, BY SCRAP TYPE, 2019–2021 (USD MILLION)
                                      TABLE 277 SOUTH AFRICA: METAL RECYCLING MARKET, BY SCRAP TYPE, 2022–2029 (USD MILLION)
                                      TABLE 278 SOUTH AFRICA: METAL RECYCLING MARKET, BY SCRAP TYPE, 2019–2021 (MILLION TON)
                                      TABLE 279 SOUTH AFRICA: METAL RECYCLING MARKET, BY SCRAP TYPE, 2022–2029 (MILLION TON)
             11.5.4 REST OF MIDDLE EAST & AFRICA
                        TABLE 280 REST OF MIDDLE EAST & AFRICA: METAL RECYCLING MARKET, BY TYPE, 2019–2021 (USD MILLION)
                        TABLE 281 REST OF MIDDLE EAST & AFRICA: METAL RECYCLING MARKET, BY TYPE, 2022–2029 (USD MILLION)
                        TABLE 282 REST OF MIDDLE EAST & AFRICA: METAL RECYCLING MARKET, BY TYPE, 2019–2021 (MILLION TON)
                        TABLE 283 REST OF MIDDLE EAST & AFRICA: METAL RECYCLING MARKET, BY TYPE, 2022–2029 (MILLION TON)
                        TABLE 284 REST OF MIDDLE EAST & AFRICA: METAL RECYCLING MARKET, BY SCRAP TYPE, 2019–2021 (USD MILLION)
                        TABLE 285 REST OF MIDDLE EAST & AFRICA: METAL RECYCLING MARKET, BY SCRAP TYPE, 2022–2029 (USD MILLION)
                        TABLE 286 REST OF MIDDLE EAST & AFRICA: METAL RECYCLING MARKET, BY SCRAP TYPE, 2019–2021 (MILLION TON)
                        TABLE 287 REST OF MIDDLE EAST & AFRICA: METAL RECYCLING MARKET, BY SCRAP TYPE, 2022–2029 (MILLION TON)
     11.6 SOUTH AMERICA 
             11.6.1 IMPACT OF RECESSION
                        TABLE 288 SOUTH AMERICA: METAL RECYCLING MARKET, BY COUNTRY, 2019–2021 (USD MILLION)
                        TABLE 289 SOUTH AMERICA: METAL RECYCLING MARKET, BY COUNTRY, 2022–2029 (USD MILLION)
                        TABLE 290 SOUTH AMERICA: METAL RECYCLING MARKET, BY COUNTRY, 2019–2021 (MILLION TON)
                        TABLE 291 SOUTH AMERICA: METAL RECYCLING MARKET, BY COUNTRY, 2022–2029 (MILLION TON)
                        TABLE 292 SOUTH AMERICA: METAL RECYCLING MARKET, BY TYPE, 2019–2021 (USD MILLION)
                        TABLE 293 SOUTH AMERICA: METAL RECYCLING MARKET, BY TYPE, 2022–2029 (USD MILLION)
                        TABLE 294 SOUTH AMERICA: METAL RECYCLING MARKET, BY TYPE, 2019–2021 (MILLION TON)
                        TABLE 295 SOUTH AMERICA: METAL RECYCLING MARKET, BY TYPE, 2022–2029 (MILLION TON)
                        TABLE 296 SOUTH AMERICA: METAL RECYCLING MARKET, BY SCRAP TYPE, 2019–2021 (USD MILLION)
                        TABLE 297 SOUTH AMERICA: METAL RECYCLING MARKET, BY SCRAP TYPE, 2022–2029 (USD MILLION)
                        TABLE 298 SOUTH AMERICA: METAL RECYCLING MARKET, BY SCRAP TYPE, 2019–2021 (MILLION TON)
                        TABLE 299 SOUTH AMERICA: METAL RECYCLING MARKET, BY SCRAP TYPE, 2022–2029 (MILLION TON)
                        TABLE 300 SOUTH AMERICA: METAL RECYCLING MARKET, BY END-USE INDUSTRY, 2019–2021 (USD MILLION)
                        TABLE 301 SOUTH AMERICA: METAL RECYCLING MARKET, BY END-USE INDUSTRY, 2022–2029 (USD MILLION)
                        TABLE 302 SOUTH AMERICA: METAL RECYCLING MARKET, BY END-USE INDUSTRY, 2019–2021 (MILLION TON)
                        TABLE 303 SOUTH AMERICA: METAL RECYCLING MARKET, BY END-USE INDUSTRY, 2022–2029 (MILLION TON)
             11.6.2 BRAZIL
                        11.6.2.1 Growing consumer electronics industry to augment market growth
                                      TABLE 304 BRAZIL: METAL RECYCLING MARKET, BY TYPE, 2019–2021 (USD MILLION)
                                      TABLE 305 BRAZIL: METAL RECYCLING MARKET, BY TYPE, 2022–2029 (USD MILLION)
                                      TABLE 306 BRAZIL: METAL RECYCLING MARKET, BY TYPE, 2019–2021 (MILLION TON)
                                      TABLE 307 BRAZIL: METAL RECYCLING MARKET, BY TYPE, 2022–2029 (MILLION TON)
                                      TABLE 308 BRAZIL: METAL RECYCLING MARKET, BY SCRAP TYPE, 2019–2021 (USD MILLION)
                                      TABLE 309 BRAZIL: METAL RECYCLING MARKET, BY SCRAP TYPE, 2022–2029 (USD MILLION)
                                      TABLE 310 BRAZIL: METAL RECYCLING MARKET, BY SCRAP TYPE, 2019–2021 (MILLION TON)
                                      TABLE 311 BRAZIL: METAL RECYCLING MARKET, BY SCRAP TYPE, 2022–2029 (MILLION TON)
             11.6.3 ARGENTINA
                        11.6.3.1 Government support and automotive industry growth to propel demand
                                      TABLE 312 ARGENTINA: METAL RECYCLING MARKET, BY TYPE, 2019–2021 (USD MILLION)
                                      TABLE 313 ARGENTINA: METAL RECYCLING MARKET, BY TYPE, 2022–2029 (USD MILLION)
                                      TABLE 314 ARGENTINA: METAL RECYCLING MARKET, BY TYPE, 2019–2021 (MILLION TON)
                                      TABLE 315 ARGENTINA: METAL RECYCLING MARKET, BY TYPE, 2022–2029 (MILLION TON)
                                      TABLE 316 ARGENTINA: METAL RECYCLING MARKET, BY SCRAP TYPE, 2019–2021 (USD MILLION)
                                      TABLE 317 ARGENTINA: METAL RECYCLING MARKET, BY SCRAP TYPE, 2022–2029 (USD MILLION)
                                      TABLE 318 ARGENTINA: METAL RECYCLING MARKET, BY SCRAP TYPE, 2019–2021 (MILLION TON)
                                      TABLE 319 ARGENTINA: METAL RECYCLING MARKET, BY SCRAP TYPE, 2022–2029 (MILLION TON)
             12.8.3 PERVASIVE PLAYERS
             12.8.4 PARTICIPANTS
                        FIGURE 44 METAL RECYCLING MARKET: COMPANY EVALUATION MATRIX, 2023
             12.8.5 COMPANY FOOTPRINT
                        FIGURE 45 COMPANY OVERALL FOOTPRINT (10 COMPANIES)
                        TABLE 330 COMPANY SCRAP TYPE FOOTPRINT (10 COMPANIES)
                        TABLE 331 COMPANY TYPE FOOTPRINT (10 COMPANIES)
                        TABLE 332 COMPANY END-USE INDUSTRY (10 COMPANIES)
                        TABLE 333 COMPANY REGION FOOTPRINT (10 COMPANIES)
     12.9 COMPANY EVALUATION MATRIX, STARTUPS/SMES 
 
12 COMPETITIVE LANDSCAPE (Page No. - 215)
     12.1 OVERVIEW 
     12.2 KEY PLAYER STRATEGIES/RIGHT TO WIN 
             TABLE 328 OVERVIEW OF STRATEGIES ADOPTED BY KEY PLAYERS IN METAL RECYCLING MARKET
     12.3 REVENUE ANALYSIS 
             FIGURE 39 REVENUE ANALYSIS OF KEY PLAYERS (2019−2023)
     12.4 MARKET SHARE ANALYSIS 
             FIGURE 40 ARCELORMITTAL LED METAL RECYCLING MARKET IN 2023
             TABLE 329 METAL RECYCLING MARKE: DEGREE OF COMPETITION
     12.5 MARKET RANKING ANALYSIS 
             FIGURE 41 RANKING OF TOP 5 PLAYERS IN METAL RECYCLING MARKET
     12.6 COMPANY VALUATION AND FINANCIAL METRICS 
             FIGURE 42 COMPANY VALUATION (USD BILLION)
             FIGURE 43 FINANCIAL MATRIX: EV/EBITDA RATIO
     12.7 PRODUCT/BRAND COMPARISON 
     12.8 COMPANY EVALUATION MATRIX, KEY PLAYERS 
             12.8.1 STARS
             12.8.2 EMERGING LEADERS
             12.8.3 PERVASIVE PLAYERS
             12.8.4 PARTICIPANTS
                        FIGURE 44 METAL RECYCLING MARKET: COMPANY EVALUATION MATRIX, 2023
             12.8.5 COMPANY FOOTPRINT
                        FIGURE 45 COMPANY OVERALL FOOTPRINT (10 COMPANIES)
                        TABLE 330 COMPANY SCRAP TYPE FOOTPRINT (10 COMPANIES)
                        TABLE 331 COMPANY TYPE FOOTPRINT (10 COMPANIES)
                        TABLE 332 COMPANY END-USE INDUSTRY (10 COMPANIES)
                        TABLE 333 COMPANY REGION FOOTPRINT (10 COMPANIES)
     12.9 COMPANY EVALUATION MATRIX, STARTUPS/SMES 
             12.9.1 PROGRESSIVE COMPANIES
             12.9.2 RESPONSIVE COMPANIES
             12.9.3 DYNAMIC COMPANIES
             12.9.4 STARTING BLOCKS
                        FIGURE 46 METAL RECYCLING MARKET: STARTUP/SME EVALUATION MATRIX, 2023
     12.10 COMPETITIVE BENCHMARKING 
             TABLE 334 METAL RECYCLING MARKET: DETAILED LIST OF KEY STARTUPS/SMES
             TABLE 335 METAL RECYCLING MARKET: COMPETITIVE BENCHMARKING OF KEY STARTUPS/SMES (15 COMPANIES)
     12.11 COMPETITIVE SCENARIO 
             12.11.1 DEALS
                        TABLE 336 METAL RECYCLING MARKET: DEALS, JANUARY 2018–MAY 2024
             12.11.2 EXPANSIONS
                        TABLE 337 METAL RECYCLING MARKET: EXPANSIONS, JANUARY 2018–MAY 2024
             12.11.3 OTHER DEVELOPMENTS
                        TABLE 338 METAL RECYCLING MARKET: OTHER DEVELOPMENTS, JANUARY 2018–MAY 2024
 
13 COMPANY PROFILES (Page No. - 235)
(Business overview, Products/Solutions/Services offered, Recent Developments, MnM view, Right to win, Strategic choices, Weaknesses and competitive threats) *
     13.1 KEY PLAYERS 
             13.1.1 ARCELORMITTAL
                        TABLE 339 ARCELORMITTAL: COMPANY OVERVIEW
                        FIGURE 47 ARCELORMITTAL: COMPANY SNAPSHOT (2023)
                        TABLE 340 ARCELORMITTAL: PRODUCTS/SOLUTIONS/SERVICES OFFERED
                        TABLE 341 ARCELORMITTAL: DEALS, JANUARY 2018−MAY 2024
                        TABLE 342 ARCELORMITTAL: OTHER DEVELOPMENTS, JANUARY 2018−MAY 2024
             13.1.2 NUCOR
                        TABLE 343 NUCOR: COMPANY OVERVIEW
                        FIGURE 48 NUCOR: COMPANY SNAPSHOT (2023)
                        TABLE 344 NUCOR: PRODUCTS/SOLUTIONS/SERVICES OFFERED
                        TABLE 345 NUCOR: DEALS, JANUARY 2018−MAY 2024
                        TABLE 346 NUCOR: EXPANSIONS, JANUARY 2018−MAY 2024
             13.1.3 CMC
                        TABLE 347 CMC: COMPANY OVERVIEW
                        FIGURE 49 CMC: COMPANY SNAPSHOT (2023)
                        TABLE 348 CMC: PRODUCTS/SOLUTIONS/SERVICES OFFERED
                        TABLE 349 CMC: DEALS, JANUARY 2018−MAY 2024
                        TABLE 350 CMC: EXPANSIONS, JANUARY 2018−MAY 2024
                        TABLE 351 CMC: OTHER DEVELOPMENTS, JANUARY 2018−MAY 2024
             13.1.4 SIMS LIMITED
                        TABLE 352 SIMS LIMITED: COMPANY OVERVIEW
                        FIGURE 50 SIMS LIMITED: COMPANY SNAPSHOT (2022)
                        TABLE 353 SIMS LIMITED: PRODUCTS/SOLUTIONS/SERVICES OFFERED
                        TABLE 354 SIMS LIMITED: DEALS, JANUARY 2018−MAY 2024
             13.1.5 AURUBIS AG
                        TABLE 355 AURUBIS AG: COMPANY OVERVIEW
                        FIGURE 51 AURUBIS AG: COMPANY SNAPSHOT (2023)
                        TABLE 356 AURUBIS AG: PRODUCTS/SOLUTIONS/SERVICES OFFERED
                        TABLE 357 AURUBIS AG: DEALS, JANUARY 2018−MAY 2024
                        TABLE 358 AURUBIS AG: EXPANSIONS, JANUARY 2018−MAY 2024
                        TABLE 359 AURUBIS AG: OTHER DEVELOPMENTS, JANUARY 2018−MAY 2024
             13.1.6 DOWA HOLDINGS CO., LTD.
                        TABLE 360 DOWA HOLDINGS CO., LTD.: COMPANY OVERVIEW
                        FIGURE 52 DOWA HOLDINGS CO., LTD.: COMPANY SNAPSHOT (2023)
                        TABLE 361 DOWA HOLDINGS CO., LTD.: PRODUCTS/SOLUTIONS/SERVICES OFFERED
             13.1.7 TATA STEEL
                        TABLE 362 TATA STEEL: COMPANY OVERVIEW
                        FIGURE 53 TATA STEEL: COMPANY SNAPSHOT (2023)
                        TABLE 363 TATA STEEL: PRODUCTS/SOLUTIONS/SERVICES OFFERED
             13.1.8 RADIUS RECYCLING, INC.
                        TABLE 364 RADIUS RECYCLING, INC.: COMPANY OVERVIEW
                        TABLE 365 RADIUS RECYCLING, INC.: PRODUCTS/SOLUTIONS/SERVICES OFFERED
             13.1.9 EUROPEAN METAL RECYCLING LTD.
                        TABLE 366 EUROPEAN METAL RECYCLING LTD.: COMPANY OVERVIEW
                        TABLE 367 EUROPEAN METAL RECYCLING LTD.: PRODUCTS/SOLUTIONS/SERVICES OFFERED
             13.1.10 UPSTATE SHREDDING – WEITSMAN RECYCLING
                        TABLE 368 UPSTATE SHREDDING – WEITSMAN RECYCLING: COMPANY OVERVIEW
                        TABLE 369 UPSTATE SHREDDING – WEITSMAN RECYCLING: PRODUCTS/SOLUTIONS/ SERVICES OFFERED
*Details on Business overview, Products/Solutions/Services offered, Recent Developments, MnM view, Key strengths, Strategic choices, Weaknesses and competitive threats might not be captured in case of unlisted companies.
     13.2 OTHER PLAYERS 
             13.2.1 TOTALL METAL RECYCLING, INC.
             13.2.2 AMERICAN IRON & METAL
             13.2.3 TOM MARTIN & COMPANY LTD.
             13.2.4 KUUSAKOSKI RECYCLING
             13.2.5 REMONDIS SE & CO. KG
             13.2.6 CHIHO ENVIRONMENTAL GROUP LIMITED
             13.2.7 METAL EXCHANGE CORPORATION
             13.2.8 FERROUS PROCESSING & TRADING
             13.2.9 SA RECYCLING LLC
             13.2.10 TMS INTERNATIONAL
             13.2.11 HUGO NEU CORPORATION
             13.2.12 COHEN
             13.2.13 OMNISOURCE, LLC
             13.2.14 METALICO, INC.
             13.2.15 ALTER TRADING
 
14 ADJACENT & RELATED MARKET (Page No. - 281)
     14.1 INTRODUCTION 
     14.2 LIMITATIONS 
             14.2.1 SOLAR PANEL RECYCLING MARKET
                        14.2.1.1 Market definition
                        14.2.1.2 Solar panel recycling market, by process
                                      TABLE 370 SOLAR PANEL RECYCLING MARKET, BY PROCESS, 2020–2023 (USD MILLION)
                                      TABLE 371 SOLAR PANEL RECYCLING MARKET, BY PROCESS, 2024–2029 (USD MILLION)
                        14.2.1.3 Solar panel recycling market, by material
                                      TABLE 372 SOLAR PANEL RECYCLING MARKET, BY MATERIAL, 2020–2023 (USD MILLION)
                                      TABLE 373 SOLAR PANEL RECYCLING MARKET, BY MATERIAL, 2024–2029 (USD MILLION)
                        14.2.1.4 Solar panel recycling market, by shelf life
                                      TABLE 374 SOLAR PANEL RECYCLING MARKET, BY SHELF LIFE, 2020–2023 (USD MILLION)
                                      TABLE 375 SOLAR PANEL RECYCLING MARKET, BY SHELF LIFE, 2024–2029 (USD MILLION)
                        14.2.1.5 Solar panel recycling market, by type
                                      TABLE 376 SOLAR PANEL RECYCLING MARKET, BY TYPE, 2020–2023 (USD MILLION)
                                      TABLE 377 SOLAR PANEL RECYCLING MARKET, BY TYPE, 2024–2029 (USD MILLION)
                                      TABLE 378 SOLAR PANEL RECYCLING MARKET, BY TYPE, 2020–2023 (MILLION PANELS)
                                      TABLE 379 SOLAR PANEL RECYCLING MARKET, BY TYPE, 2024–2029 (MILLION PANELS)
                        14.2.1.6 Solar panel recycling market, by region
                                      TABLE 380 SOLAR PANEL RECYCLING MARKET, BY REGION, 2020–2023 (USD MILLION)
                                      TABLE 381 SOLAR PANEL RECYCLING MARKET, BY REGION, 2024–2029 (USD MILLION)
                                      TABLE 382 SOLAR PANEL RECYCLING MARKET, BY REGION, 2020–2023 (MILLION PANELS)
                                      TABLE 383 SOLAR PANEL RECYCLING MARKET, BY REGION, 2024–2029 (MILLION PANELS)
             14.2.2 RARE EARTH METALS RECYCLING MARKET
                        14.2.2.1 Market definition
                        14.2.2.2 Rare earth metals recycling market, by application
                                      TABLE 384 RARE EARTH METALS RECYCLING MARKET SIZE, BY APPLICATION, 2019–2026 (USD MILLION)
                                      TABLE 385 RARE EARTH METALS RECYCLING MARKET SIZE, BY APPLICATION, 2019–2026 (METRIC TON)
                        14.2.2.3 Rare earth metals recycling market, by source
                                      TABLE 386 RARE EARTH METALS RECYCLING MARKET SIZE, BY SOURCE, 2019–2026 (USD MILLION)
                                      TABLE 387 RARE EARTH METALS RECYCLING MARKET SIZE, BY SOURCE, 2019–2026 (METRIC TON)
                        14.2.2.4 Rare earth metals recycling market, by technology
                                      TABLE 388 RARE EARTH METALS RECYCLING MARKET SIZE, BY TECHNOLOGY, 2019–2026 (USD MILLION)
                                      TABLE 389 RARE EARTH METALS RECYCLING MARKET SIZE, BY TECHNOLOGY, 2019–2026 (METRIC TON)
                        14.2.2.5 Rare earth metals recycling market, by region
                                      TABLE 390 GLOBAL RARE EARTH METALS RECYCLING MARKET SIZE, BY REGION, 2019–2026 (USD MILLION)
                                      TABLE 391 GLOBAL RARE EARTH METALS RECYCLING MARKET SIZE, BY REGION, 2019–2026 (METRIC TON)
 
15 APPENDIX (Page No. - 292)
     15.1 DISCUSSION GUIDE 
     15.2 KNOWLEDGESTORE: MARKETSANDMARKETS’ SUBSCRIPTION PORTAL 
     15.3 CUSTOMIZATION OPTIONS 
     15.4 RELATED REPORTS 
     15.5 AUTHOR DETAILS 

The study involved four major activities for estimating the current size of the global Metal recycling market. Exhaustive secondary research was carried out to collect information on the market, the peer product market, and the parent product group market. The next step was to validate these findings, assumptions, and sizes with the industry experts across the value chain of Metal recycling through primary research. Both the top-down and bottom-up approaches were employed to estimate the overall size of the Metal recycling market. After that, market breakdown and data triangulation procedures were used to determine the size of different segments and sub-segments of the market.

Secondary Research

In the secondary research process, various secondary sources such as Hoovers, Factiva, Bloomberg BusinessWeek, and Dun & Bradstreet were referred to, to identify and collect information for this study on the Metal recycling market. These secondary sources included annual reports, press releases & investor presentations of companies; white papers; certified publications; articles by recognized authors; regulatory bodies, trade directories, and databases.

Primary Research

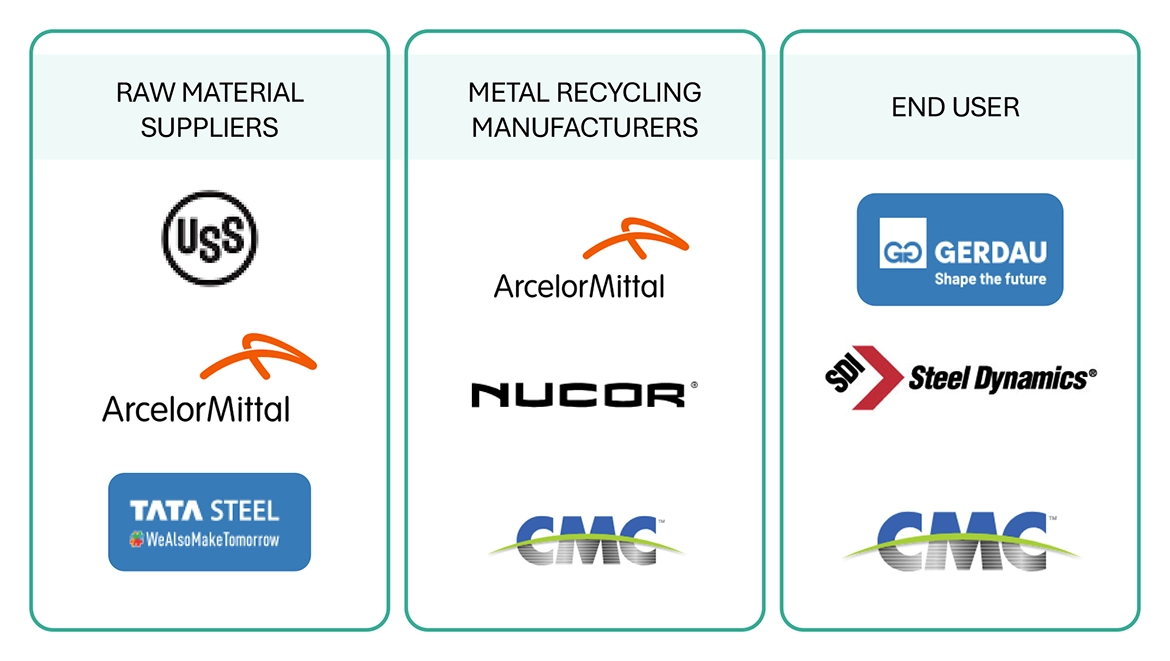
The Metal recycling market comprises several stakeholders in the supply chain, which include raw material suppliers, processors, end-product manufacturers, buyers, and regulatory organizations. Various primary sources from the supply and demand sides of the markets have been interviewed to obtain qualitative and quantitative information. The primary participants from the demand side include key opinion leaders, executives, vice presidents, and CEOs of companies in the Metal recycling market. Primary sources from the supply side include associations and institutions involved in the Metal recycling industry, key opinion leaders, and processing players.

Following is the breakdown of primary respondents

Metal Recycling Market Size, and Share

Notes: Other designations include product, sales, and marketing managers.

Tiers of the companies are classified based on their annual revenues as of 2022: Tier 1 = >USD 5 Billion, Tier 2 = USD 1 Billion to USD 5 Billion, and Tier 3= <USD 1 Billion.

To know about the assumptions considered for the study, download the pdf brochure

Market Size Estimation

Both the top-down and bottom-up approaches were used to estimate and validate the size of the global metal recycling market. These approaches were also used extensively to estimate the size of various segments of the market. The research methodology used to estimate the market size included the following details:

  • The key players in the industry were identified through extensive secondary research.
  • The supply chain of the industry and market size, in terms of value and volume, were determined through primary and secondary research.
  • All percentage share splits and breakdowns were determined using secondary sources and verified through primary sources.
  • All possible parameters that affect the markets covered in this research study were accounted for, viewed in extensive detail, verified through primary research, and analyzed to obtain the final quantitative and qualitative data.
  • The research includes the study of reports, reviews, and newsletters of key industry players, along with extensive interviews with key officials, such as directors and marketing executives.

Metal Recycling Market Size, and Share

To know about the assumptions considered for the study, Request for Free Sample Report

Metal Recycling Market Size, and Share

Data Triangulation

After arriving at the overall market size from the estimation process explained above, the total market was split into several segments and sub-segments. The data triangulation and market breakdown procedures were employed, wherever applicable, to complete the overall market engineering process and arrive at the exact statistics for all the segments and sub-segments of the metal recycling market. The data was triangulated by studying various factors and trends from both the demand- and supply-side.

In addition, the market size was validated by using both the top-down and bottom-up approaches. Then, it was verified through primary interviews. Hence, for every data segment, there are three sources—top-down approach, bottom-up approach, and expert interviews. The data were assumed to be correct when the values arrived at from the three sources matched.

Market Definition

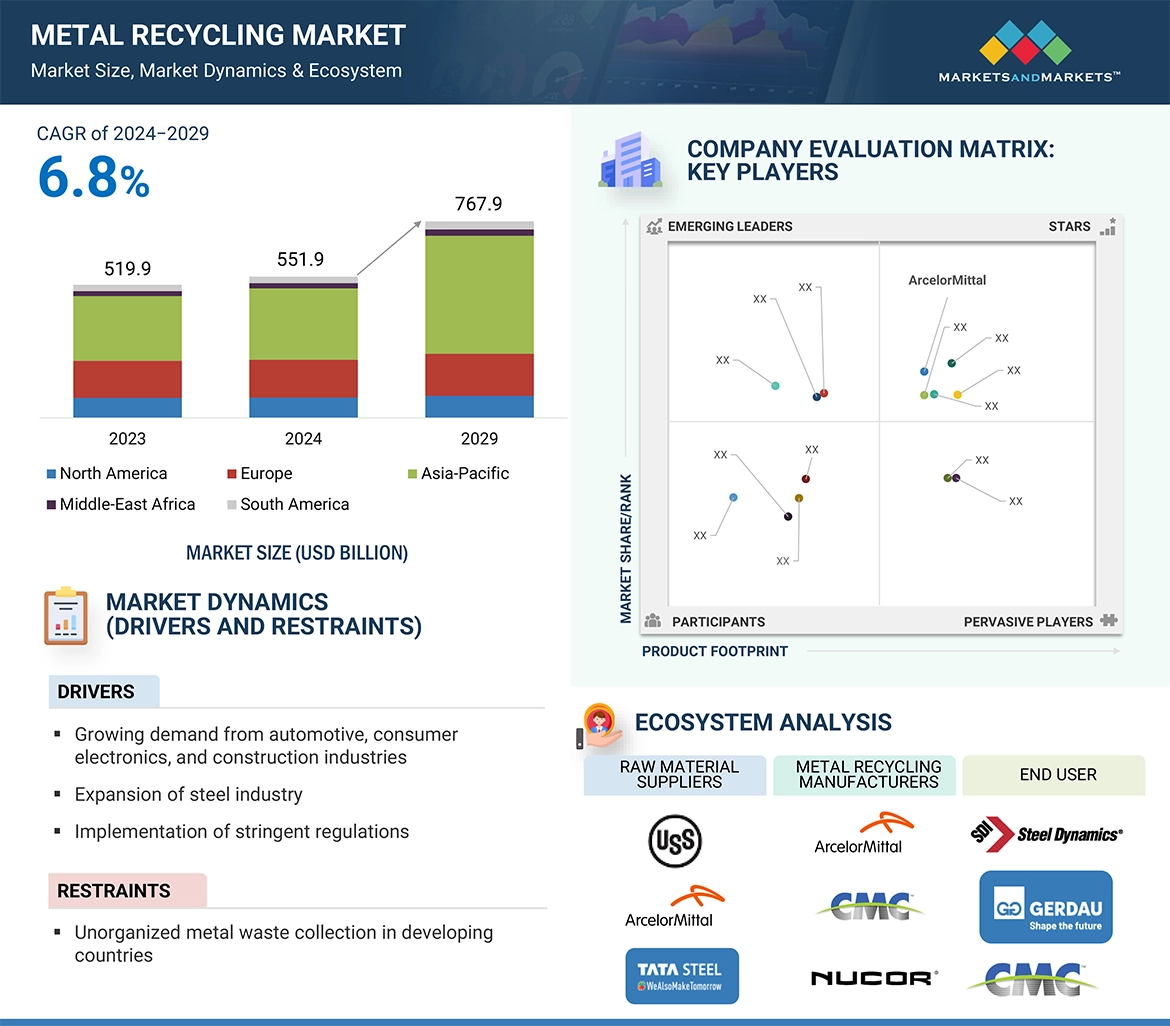
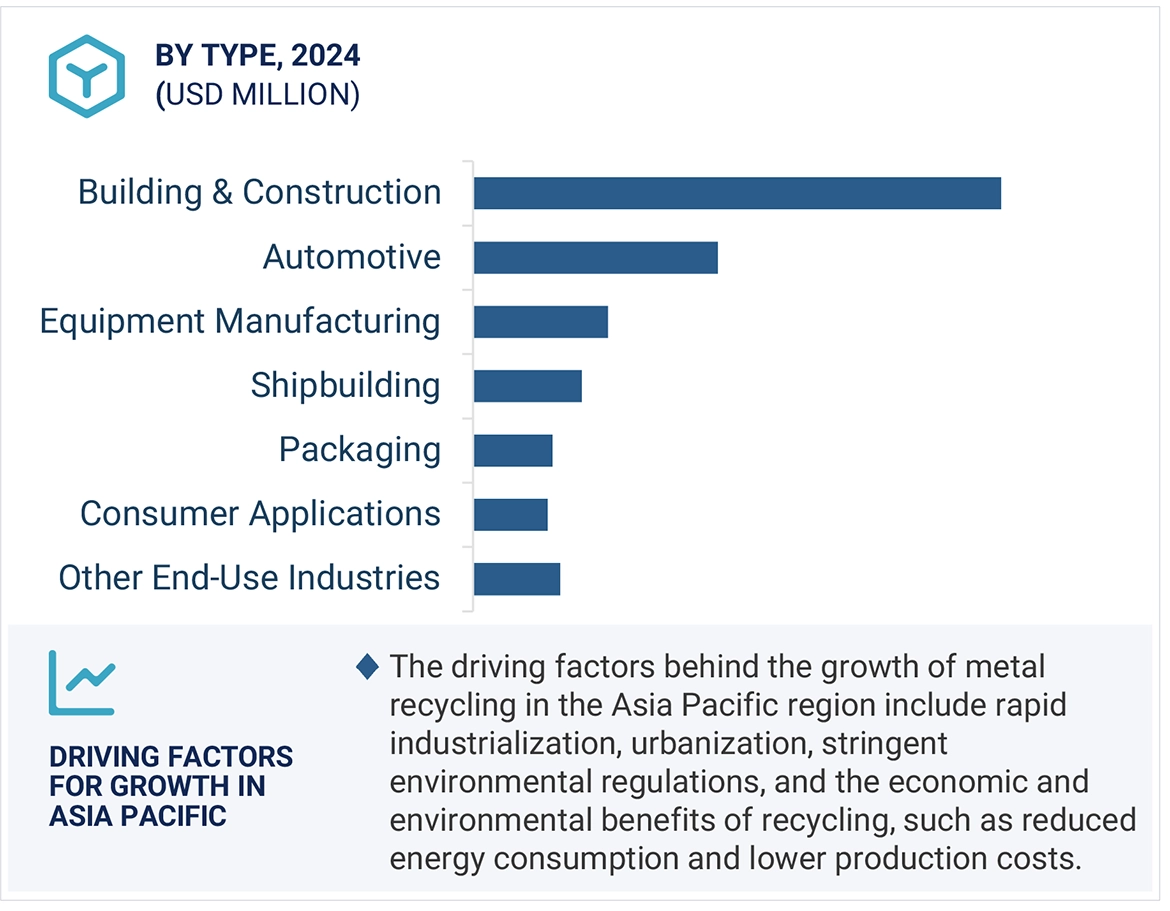
Metal recycling involves recovering ferrous and non-ferrous scrap metal from unused products, structures, and manufacturing processes, then converting it into new metal materials. The process encompasses several crucial stages: collecting scrap metal from sources such as old vehicles, appliances, construction debris, and electronic devices; sorting and separating different metal types; processing the metals through shredding, melting, and purifying to remove contaminants; and finally, forming the purified metal into new products or raw materials for manufacturing. Recycled metal can be used to create new products, which can themselves be recycled at the end of their lifecycle. This approach conserves natural resources by reducing the need for raw material extraction and saves energy, as recycling metals typically requires less energy than producing new metals from ore. Additionally, metal recycling helps reduce greenhouse gas emissions and environmental pollution, promoting more sustainable and eco-friendly industrial practices. Recycled metals are widely used in various end-use sectors, including building and construction, automotive, shipbuilding, packaging, equipment manufacturing, consumer appliances, aerospace and defense, and industrial and commercial furniture and utensils.

Key Stakeholders

  • Metal producing & recycling companies
  • Environmental service providers
  • Government and regulatory bodies
  • Market research and consulting firms
  • Commercial R&D institutions
  • Associations and industry bodies
  • Conservation professionals
  • Municipalities and local & regional authorities
  • Other end users (materials recovery facilities, processors, sorters, metal recycling plants, and manufacturers).

Report Objectives

  • To define, analyze, and project the size of the metal recycling market in terms of value based on type, scrap type, equipment used, end-use industry, and region.
  • To project the size of the market and its segments with respect to the five main regions, namely, North America, Europe, Asia Pacific, Middle East & Africa, and South America
  • To provide detailed information about the key factors, such as drivers, restraints, opportunities, and challenges, influencing the growth of the market
  • To analyze the opportunities in the market for stakeholders and provide a detailed competitive landscape of the market leaders.
  • To analyze the competitive developments, such as new product launches, expansions, and acquisitions, in the metal recycling market
  • To strategically profile the key players operating in the market and comprehensively analyze their market shares and core competencies.

Available Customizations

Along with the given market data, MarketsandMarkets offers customizations as per the specific needs of the companies. The following customization options are available for the report:

Product Analysis:
  • Product Matrix which gives a detailed comparison of the product portfolio of each company
Regional Analysis:
  • Further breakdown of the Rest of Asia Pacific market
  • Further breakdown of Rest of Europe market
Company Information:
  • Detailed analysis and profiling of additional market players (up to 5)
Custom Market Research Services

We will customize the research for you, in case the report listed above does not meet with your exact requirements. Our custom research will comprehensively cover the business information you require to help you arrive at strategic and profitable business decisions.

Request Customization
Report Code
MM 3943
Published ON
Jun, 2024
Choose License Type
BUY NOW
  • SHARE
X
Request Customization
Speak to Analyst
Speak to Analyst
OR FACE-TO-FACE MEETING
PERSONALIZE THIS RESEARCH
  • Triangulate with your Own Data
  • Get Data as per your Format and Definition
  • Gain a Deeper Dive on a Specific Application, Geography, Customer or Competitor
  • Any level of Personalization
REQUEST A FREE CUSTOMIZATION
LET US HELP YOU!
  • What are the Known and Unknown Adjacencies Impacting the Metal Recycling Market
  • What will your New Revenue Sources be?
  • Who will be your Top Customer; what will make them switch?
  • Defend your Market Share or Win Competitors
  • Get a Scorecard for Target Partners
CUSTOMIZED WORKSHOP REQUEST
  • Call Us
  • +1-888-600-6441 (Corporate office hours)
  • +1-888-600-6441 (US/Can toll free)
  • +44-800-368-9399 (UK office hours)
CONNECT WITH US
ABOUT TRUST ONLINE
©2024 MarketsandMarkets Research Private Ltd. All rights reserved
DMCA.com Protection Status Website Feedback