Methionine Market by Type (L-Methionine, MHA, Dl-Methionine), Application (Animal Feed, Food & Dietary Supplements, Pharmaceuticals), and Region (North America, Europe, Asia-Pacific, Middle East & Africa, South America) - Global Forecast to 2022


Methionine Market Size And Forecast
The methionine market is projected to reach USD 4.45 Billion by 2022, at a CAGR of 5.7%. The base year considered for the study is 2016, while the forecast period is between 2017 and 2022. The methionine market is driven by the rise in the consumption of animal-based products, increasing health issues, and implementation of innovative animal husbandry practices to improve meat quality.
Methionine Market Report Objectives
- To analyze and forecast the size of the methionine market in terms of volume and value
- To provide detailed information regarding the key factors (drivers, restraints, opportunities, and challenges) influencing the growth of the market
- To define, describe, and forecast the market on the basis of type and application
- To forecast the market size in terms of value and volume of segments with respect to five key regions, namely, North America, Europe, Asia Pacific (APAC), the Middle East & Africa, and South America
- To strategically analyze micromarkets1 with respect to individual growth trends, prospects, and their contribution to the market
- To analyze the opportunities in the market for stakeholders and draw a competitive landscape for market leaders
- To analyze competitive developments such as expansions, agreements, acquisitions, joint ventures, and new product launches in the market
- To strategically profile key players and comprehensively analyze their market shares and core competencies
Both, top-down and bottom-up approaches have been used to estimate and validate the size of the global methionine market and to estimate the size of various other dependent sub-markets. Extensive secondary sources, directories, and databases such as Hoover’s, Bloomberg, Chemical Weekly, Factiva, Composite Panel Association (CPA), World Bank, Securities and Exchange Commission (SEC), and other government and private websites were referred to identify and collect information useful for this technical, market-oriented, and commercial study of the methionine market.
To know about the assumptions considered for the study, download the pdf brochure
See how this study impacted revenues for other players in Methionine Market
Client’s Problem statement
Our client, a top American agricultural processor and food ingredient provider, was keen to understand the market for methionine for applications such as animal feed, food & dietary supplements, and pharmaceuticals across major geographic regions. The client was also interested in a comprehensive analysis of competitors, as well as the cost and price of methionine. The top management needed to decide on which application segment to focus on, which geography to prioritize, which technologies to focus on, and what industry practices to follow to achieve a competitive advantage. 
MnM Approach
MnM identified all the leading methionine manufacturers for animal nutrition globally and provided a competitive benchmarking of these companies in terms of strength of product portfolio, geographic presence, operational performance, and excellence in strategy execution. MnM also assisted the client in identifying the price range and production cost of methionine offered by different competitors. In addition, we helped the client understand the expansion plans, partnerships, merger & acquisition deals, and new product development plans of competitors. Interviews with senior management and CXO level executives from competitors were conducted to understand what best practices they follow in terms of production or sales/distribution of methionine to target customers. This helped the client to benchmark industry best practices and realign its operations and marketing strategy for methionine.
Revenue Impact (RI)
Our findings helped the client to strengthen its position in a USD 4.5 billion market, with projected revenue of USD 40-60 million in 5 years. The client was able to grow its methionine business across target regions such as Asia Pacific, Europe, and North America.
See how this study impacted revenues for other players in Methionine Market
Key Players in Methionine Market
Some of the major market players in the global methionine market include Evonik (Germany), Adisseo (France), Novus International (US), CJ CHEILJEDANG (South Korea), Sumitomo Chemical (Japan), AJINOMOTO (Japan), Phibro (US), Prinova Group (US), Sunrise Nutrachem (China), and Chongqing Unisplendour Chemical (China).
Key Target Audience in Methionine Market
- Manufacturers of Methionine
- Animal Feed Manufacturers
- Food & Supplements Manufacturers
- Traders, Distributors, and Suppliers of Methionine
- Regional Manufacturers Associations and General Amino Acid Associations
- Governments, Regional Agencies, and Research Organizations
- Investment Research Firms
“This study answers several questions for stakeholders, primarily, which market segments they need to focus on during the next two to five years to prioritize their efforts and investments.”
Methionine Market Report Scope
This research report categorizes the global methionine market based on type, application, and region.
On the Basis of Type:
- L- Methionine
- MHA
- DL-Methionine
On the Basis of Application:
- Animal Feed
- Food & Supplements
- Pharmaceuticals
On the Basis of Region:
- Asia Pacific
- Europe
- North America
- Middle East & Africa
- South America
The market is further analyzed for key countries in each of these regions.
Methionine Market Report Available Customizations
With the given market data, MarketsandMarkets offers customizations according to the company’s specific needs. The following customization options are available for the report:
Methionine Market Application Sector Analysis
- Product matrix that provides a detailed analysis of various types of methionine in each application
Methionine Market Regional Analysis
- Further breakdown of a region with respect to a particular country
Methionine Market Company Information
- Detailed analysis and profiles of additional market players (up to 5)
Frequently Asked Questions (FAQ):
How big is the Methionine Market industry?
The methionine market is projected to grow from USD 3.36 Billion in 2017 to USD 4.45 Billion by 2022, at a CAGR of 5.7% from 2017 to 2022.
Who leading market players in Methionine industry?
Major players in the global methionine market are Evonik (Germany), Adisseo (France), Novus International (US), CJ CHEILJEDANG (South Korea), Sumitomo Chemical (Japan), AJINOMOTO (Japan), Phibro (US), Prinova Group (US), Sunrise Nutrachem (China), and Chongqing Unisplendour Chemical (China).
To speak to our analyst for a discussion on the above findings, click Speak to Analyst
 Exclusive indicates content/data unique to MarketsandMarkets and not available with any competitors.
Table of Contents
1 Introduction (Page No. - 14)
1.1 Objectives of the Study
1.2 Market Definition
1.3 Market Scope
1.3.1 Years Considered for the Study
1.4 Currency
1.5 Unit Considered
1.6 Limitations
1.7 Stakeholders
2 Research Methodology (Page No. - 18)
2.1 Research Data
2.1.1 Secondary Data
2.1.1.1 Key Data From Secondary Sources
2.1.2 Primary Data
2.1.2.1 Key Data From Primary Sources
2.1.2.2 Key Industry Insights
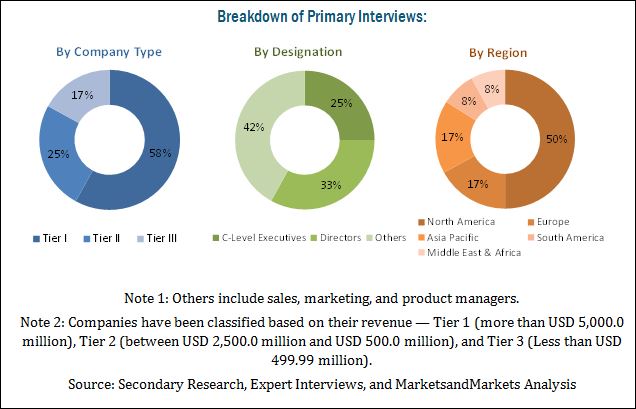
2.1.2.3 Breakdown of Primaries
2.2 Market Size Estimation
2.2.1.1 Bottom-Up Approach
2.2.1.2 Top-Down Approach
2.3 Data Triangulation
2.4 Assumptions
3 Executive Summary (Page No. - 26)
4 Premium Insights (Page No. - 30)
4.1 Attractive Opportunities in Methionine Market
4.2 Market, By Application
4.3 Methionine Market, By Type
4.4 APAC: Methionine Market, By Application and Country
5 Market Overview (Page No. - 32)
5.1 Introduction
5.2 Market Dynamics
5.2.1 Drivers
5.2.1.1 Growth in the Consumption of Animal-Based Products
5.2.1.2 Increasing Health Issues
5.2.1.3 Implementation of Innovative Animal Husbandry Practices to Improve Meat Quality
5.2.2 Restraints
5.2.2.1 Stringent Regulatory Framework
5.2.3 Opportunities
5.2.3.1 Growing Demand for Methionine in the Emerging Economies
5.2.3.2 Increasing Demand for Methionine in Pharmaceutical Applications
5.2.4 Challenges
5.2.4.1 Lack of Knowledge About Methionine
5.2.4.2 Limited Supply of Raw Material
5.3 Porter’s Five Force Analysis
5.3.1 Bargaining Power of Suppliers
5.3.2 Bargaining Power of Buyers
5.3.3 Threat of New Entrants
5.3.4 Threat of Substitutes
5.3.5 Intensity of Competitive Rivalry
5.4 Macroeconomic Overview and Key Trends
5.4.1 Trends and Forecast of Gdp
5.4.2 Trends in Global Animal Feed Production
5.4.3 Trends in Global Meat Consumption
6 Methionine Market, By Type (Page No. - 42)
6.1 Introduction
6.2 DL-Methionine
6.3 Methionine Hydroxy Analogue (Mha)
6.4 L-Methionine
7 Methionine Market, By Application (Page No. - 45)
7.1 Introduction
7.2 Animal Feed
7.2.1 Poultry
7.2.1.1 Broilers
7.2.1.2 Breeders
7.2.1.3 Layers
7.2.2 Swine
7.2.2.1 Starter
7.2.2.2 Grower
7.2.2.3 Sow
7.2.3 Ruminants
7.2.3.1 Calf
7.2.3.2 Dairy Cattle
7.2.3.3 Beef Cattle
7.2.3.4 Others
7.2.4 Aquaculture
7.2.4.1 Fish
7.2.4.2 Mollusks
7.2.4.3 Crustaceans
7.2.5 Others
7.3 Food & Dietary Supplements
7.3.1 Nutraceutical & Dietary Supplements
7.3.2 Infant Formula
7.3.3 Food Fortification
7.3.4 Others
7.4 Pharmaceuticals
8 Methionine Market, By Region (Page No. - 53)
8.1 Introduction
8.2 North America
8.2.1 US
8.2.2 Canada
8.2.3 Mexico
8.3 APAC
8.3.1 China
8.3.2 India
8.3.3 Japan
8.3.4 Thailand
8.3.5 Indonesia
8.3.6 Rest of APAC
8.4 Europe
8.4.1 Spain
8.4.2 Russia
8.4.3 Germany
8.4.4 France
8.4.5 UK
8.4.6 Italy
8.4.7 Rest of Europe
8.5 Middle East & Africa
8.5.1 Turkey
8.5.2 South Africa
8.5.3 Iran
8.5.4 Rest of Middle East & Africa
8.6 South America
8.6.1 Brazil
8.6.2 Argentina
8.6.3 Rest of South America
9 Competitive Landscape (Page No. - 86)
9.1 Overview
9.2 Market Share of Key Players
9.3 Competitive Scenario
9.3.1 Expansions
9.3.2 Joint Ventures
9.3.3 Agreements
9.3.4 Acquisitions
9.3.5 New Product Launches
10 Company Profiles (Page No. - 91)
(Overview, Financial*, Products & Services, Strategy, and Developments)
10.1 Evonik
10.2 Adisseo
10.3 Novus International
10.4 CJ CHEILJEDANG
10.5 Sumitomo Chemicals
10.6 AJINOMOTO
10.7 Phibro
10.8 Prinova Group LLC
10.9 Sunrise Nutrachem Group
10.10 Chongqing Unisplendour Chemical
10.11 Other Market Players
10.11.1 Amino GmbH
10.11.2 Beijing Fortunestar S&T Development
10.11.3 Bewital Agri
10.11.4 H.J. Baker & Bro
10.11.5 Iris Biotech
10.11.6 Jirong Pharmaceutical
10.11.7 Kemin
10.11.8 KG Group
10.11.9 Kingchem
10.11.10 Megamix
10.11.11 Pacific Rainbow International
10.11.12 Shaanxi Sciphar Natural Products
10.11.13 Suanfarma
10.11.14 Tokyo Chemical Industry
10.11.15 Volzhsky Orgsynthese Jsc
*Details Might Not Be Captured in Case of Unlisted Companies
11 Appendix (Page No. - 114)
11.1 Insights From Industry Experts
11.2 Discussion Guide
11.3 Knowledge Store: Marketsandmarkets’ Subscription Portal
11.4 Introducing RT: Real-Time Market Intelligence
11.5 Related Reports
11.6 Author Details
List of Tables (73)
Table 1 Trends and Forecast of Gdp, USD Billion (2016–2022)
Table 2 Methionine Market Size, By Type, 2015–2022 (Kiloton)
Table 3 Market Size, By Type, 2015–2022 (USD Million)
Table 4 Methionine Market, By Application, 2015–2022 (Kiloton)
Table 5 Market, By Application, 2015–2022 (USD Million)
Table 6 Methionine Market Size, By Region, 2015–2022 (Kiloton)
Table 7 Market Size, By Region, 2015–2022 (USD Million)
Table 8 North America: Methionine Market Size, By Country, 2015–2022 (Kiloton)
Table 9 North America: Market Size, By Country, 2015–2022 (USD Million)
Table 10 North America: Market Size, By Application, 2015–2022 (Kiloton)
Table 11 North America: Market Size, By Application, 2015–2022 (USD Million)
Table 12 US: Methionine Market Size, By Application, 2015–2022 (Kiloton)
Table 13 US: Market Size, By Application, 2015–2022 (USD Million)
Table 14 Canada: Methionine Market Size, By Application, 2015–2022 (Kiloton)
Table 15 Canada: Market Size, By Application, 2015–2022 (USD Million)
Table 16 Mexico: Methionine Market Size, By Application, 2015–2022 (Kiloton)
Table 17 Mexico: Market Size, By Application, 2015–2022 (USD Million)
Table 18 APAC: Methionine Market Size, By Country, 2015–2022 (Kiloton)
Table 19 APAC: Market Size, By Country, 2015–2022 (USD Million)
Table 20 APAC: Market Size, By Application, 2015–2022 (Kiloton)
Table 21 APAC: Market Size, By Application, 2015–2022 (USD Million)
Table 22 China: Methionine Market Size, By Application, 2015–2022 (Kiloton)
Table 23 China: Market, By Application, 2015–2022 (USD Million)
Table 24 India: Methionine Market Size, By Application, 2015–2022 (Kiloton)
Table 25 India: Market Size, By Application, 2015–2022 (USD Million)
Table 26 Japan: Market Size, By Application, 2015–2022 (Kiloton)
Table 27 Japan: Market Size, By Application, 2015–2022 (USD Million)
Table 28 Thailand: Methionine Market Size, By Application, 2015–2022 (Kiloton)
Table 29 Thailand: Market Size, By Application, 2015–2022 (USD Million)
Table 30 Indonesia: Market Size, By Application, 2015–2022 (Kiloton)
Table 31 Indonesia: Market Size, By Application, 2015–2022 (USD Million)
Table 32 Rest of APAC: Methionine Market Size, By Application, 2015–2022 (Kiloton)
Table 33 Rest of APAC: Market Size, By Application, 2015–2022 (USD Million)
Table 34 Europe: Methionine Market Size, By Country, 2015–2022 (Kiloton)
Table 35 Europe: Market Size, By Country, 2015–2022 (USD Million)
Table 36 Europe: Market Size, By Application, 2015–2022 (Kiloton)
Table 37 Europe: Market Size, By Application, 2015–2022 (USD Million)
Table 38 Spain: Methionine Market Size, By Application, 2015–2022 (Kiloton)
Table 39 Spain: Market Size, By Application, 2015–2022 (USD Million)
Table 40 Russia: Methionine Market Size, By Application, 2015–2022 (Kiloton)
Table 41 Russia: Market Size, By Application, 2015–2022 (USD Million)
Table 42 Germany: Methionine Market Size, By Application, 2015–2022 (Kiloton)
Table 43 Germany: Market Size, By Application, 2015–2022 (USD Million)
Table 44 France: Methionine Market Size, By Application, 2015–2022 (Kiloton)
Table 45 France: Market Size, By Application, 2015–2022 (USD Million)
Table 46 UK: Market Size, By Application, 2015–2022 (Kiloton)
Table 47 UK: Market Size, By Application, 2015–2022 (USD Million)
Table 48 Italy: Methionine Market Size, By Application, 2015–2022 (Kiloton)
Table 49 Italy: Market Size, By Application, 2015–2022 (USD Million)
Table 50 Rest of Europe: Market Size, By Application, 2015–2022 (Kiloton)
Table 51 Rest of Europe: Market Size, By Application, 2015–2022 (USD Million)
Table 52 Middle East & Africa: Methionine Market Size, By Country, 2015–2022 (Kiloton)
Table 53 Middle East & Africa: Market Size, By Country, 2015–2022 (USD Million)
Table 54 Middle East & Africa: Market Size, By Application, 2015–2022 (Kiloton)
Table 55 Middle East & Africa: Market Size, By Application, 2015–2022 (USD Million)
Table 56 Turkey: Market Size, By Application, 2015–2022 (Kiloton)
Table 57 Turkey: Market Size, By Application, 2015–2022 (USD Million)
Table 58 South Africa: Market Size, By Application, 2015–2022 (Kiloton)
Table 59 South Africa: Market Size, By Application, 2015–2022 (USD Million)
Table 60 Iran: Market Size, By Application, 2015–2022 (Kiloton)
Table 61 Iran: Market, By Application, 2015–2022 (USD Million)
Table 62 Rest of Middle East & Africa: Market Size, By Application, 2015–2022 (Kiloton)
Table 63 Rest of Middle East & Africa: Market Size, By Application, 2015–2022 (USD Million)
Table 64 South America: Methionine Market Size, By Country, 2015–2022 (Kiloton)
Table 65 South America: Market Size, By Country, 2015–2022 (USD Million)
Table 66 South America: Market Size, By Application, 2015–2022 (Kiloton)
Table 67 South America: Market Size, By Application, 2015–2022(USD Million)
Table 68 Brazil: Market Size, By Application, 2015–2022 (Kiloton)
Table 69 Brazil: Market Size, By Application, 2015–2022 (USD Million)
Table 70 Argentina: Methionine Market Size, By Application, 2015–2022 (Kiloton)
Table 71 Argentina: Market Size, By Application, 2015–2022 (USD Million)
Table 72 Rest of South America: Methionine Market Size, By Application, 2015–2022 (Kiloton)
Table 73 Rest of South America: Market Size, By Application, 2015–2022 (USD Million)
List of Figures (29 Figures)
Figure 1 Methionine Market: Research Design
Figure 2 Market Size Estimation: Bottom-Up Approach
Figure 3 Market Size Estimation: Top-Down Approach
Figure 4 Data Triangulation: Methionine Market
Figure 5 DL-Methionine to Dominate the Market Between 2017 and 2022
Figure 6 Food & Dietary Supplements Application to Be the Fatest Growing Methionine Market Between 2017 and 2022
Figure 7 Europe to Be the Largest Methionine Market in 2016
Figure 8 Growth in Consumption of Animal-Based Products Drives Methionine Market
Figure 9 Animal Feed Segment to Account for the Largest Market Share Between 2017 and 2022
Figure 10 L-Methionine Projected to Be the Fastest Growing Market Between 2017 and 2022
Figure 11 Animal Feed and China Accounted for Largest Market Share in 2016
Figure 12 Factors Governing the Methionine Market
Figure 13 Animal-Based Products Consumption, By Commodity (1967–2030)
Figure 14 Porters Five Force Analysis
Figure 15 Total Animal Feed Production (2012—2016)
Figure 16 Total Meat Consumption (2012—2016)
Figure 17 DL-Methionine to Be the Largest Type During the Forecast Period
Figure 18 Animal Feed Application to Dominate Methionine Market, 2017 vs 2022
Figure 19 India is Emerging as the New Hotspot in Global Market, 2017-2022
Figure 20 Methionine Market in APAC Snapshot
Figure 21 China to Dominate Methionine Market in APAC, 2017-2022
Figure 22 Expansion is the Key Growth Strategy Adopted By the Leading Market Players
Figure 23 Market Share of Key Players in 2016
Figure 24 Evonik: Company Snapshot
Figure 25 Adisseo: Company Snapshot
Figure 26 CJ CHEILJEDANG: Company Snapshot
Figure 27 Sumitomo Chemicals: Company Snapshot
Figure 28 AJINOMOTO: Company Snapshot
Figure 29 Phibro: Company Snapshot
The methionine market is expected to grow from USD 3.36 Billion in 2017 to USD 4.45 Billion by 2022, at a CAGR of 5.7% between 2017 and 2022. The methionine market has witnessed growth in the past few years, which can be attributed to the increasing health issues of consumers, the rise in the consumption of animal-based products, and implementation of innovative animal husbandry practices to improve the meat quality, owing to the rising demand for protein-rich food globally. In addition, the growing demand for methionine in emerging economies and for pharmaceuticals applications is driving the methionine market.
The main types of methionine are L-Methionine, DL-Methionine, and Methionine Hydroxy Analog (MHA). Majorly, DL-methionine is used in various applications and thus, the DL-methionine type segment accounted for the largest market share in 2016, owing to its numerous benefits, including reduced nitrogen excretions, support performance during heat stress, and high antioxidant capacity.
Methionine is used in animal feed, food & dietary supplements, and pharmaceuticals. Among these, the animal feed application segment is projected to lead the methionine market during the forecast period, as livestock requires adequate nutrition and care for optimum growth and development. With growing concerns about food safety, feed safety, and animal health & nutrition, the focus has shifted to providing a proper diet and feed intake level to ensure better animal health, which is driving the animal feed application segment.
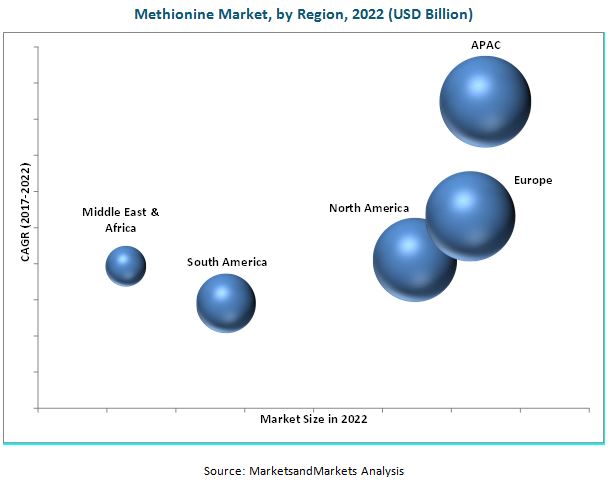
North America, Europe, Asia Pacific, the Middle East & Africa, and South America have been considered as key markets for methionine in the report. In 2016, APAC was the fastest growing market for methionine due to the high disposable income of consumers and demand for protein-rich food in countries such as China, India, Japan, and Thailand. Rapid industrialization and urbanization have resulted in an increase in the per capita income of the people of this region. Moreover, increase in the disposable income of consumers has led to a growth in demand for protein-rich food. These factors are driving the methionine market in APAC.
The methionine market is expected to witness significant growth in the coming years. However, factors such as negative perception about methionine among consumers may hinder the growth of this market.
Evonik Industries (Germany), Adisseo (France), Novus International (US), CJ CHEILJEDANG (South Korea), and Sumitomo (Japan) are the key companies in the methionine market. Targeting new markets will enable methionine manufacturers to overcome the effects of volatile economies, leading to diversified business portfolios and increase in revenues. Other major manufacturers of methionine are AJINOMOTO (Japan), Phibro (US), Prinova Group (US), Sunrise Nutrachem (China), and Chongqing Unisplendour Chemical (China).
To speak to our analyst for a discussion on the above findings, click Speak to Analyst


Growth opportunities and latent adjacency in Methionine Market