mHealth Solutions Market

mHealth Solutions Market by Apps (Women Health, Diabetes, Mental Health), Connected Devices (Glucose & Blood Pressure Monitor, Peak Flow Meter), Services (Remote Monitoring, Consultation), End User (Providers, Patients, Payers) & Region - Global Forecasts to 2028

Report Code: HIT 2104 Mar, 2023, by marketsandmarkets.com

Updated on : March 27, 2023

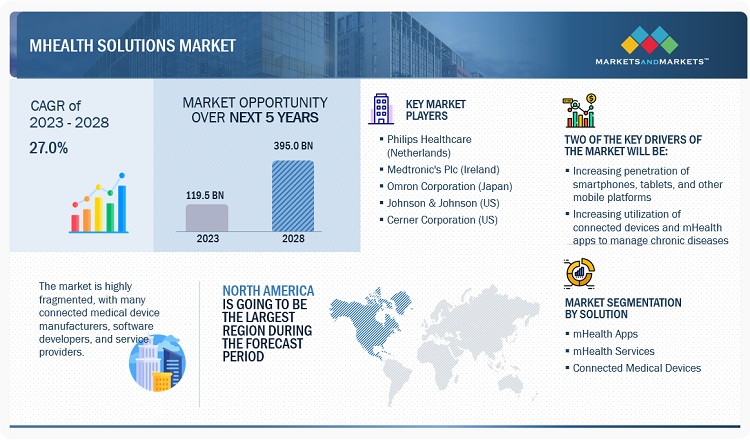
The global mHealth solutions market in terms of revenue was estimated to be worth $119.5 billion in 2023 and is poised to reach $395.0 billion by 2028, growing at a CAGR of 27.0% from 2023 to 2028.

The global market is expected to grow significantly in the coming years. Factors such as the increasing penetration of smartphones, tablets, and other mobile platforms; increasing utilization of connected devices and mHealth apps for the management of chronic diseases; cost containment in healthcare delivery; robust penetration of 3G and 4G networks; and rising focus on patient-centric healthcare delivery and increase in demand for home healthcare services are expected to drive market growth in the coming years.

On the other hand, lack of standards and regulations, the paucity of reimbursements, low guidance from physicians in selecting apps due to unawareness of technology, and resistance from traditional healthcare providers are expected to limit market growth to a certain extent.

Attractive Opportunities in mHealth Solutions Market
mHealth Solutions Market

To know about the assumptions considered for the study, Request for Free Sample Report

mHealth Solutions  Market Dynamics

Drivers: Growing penetration of 4G & 5G networks to ensure uninterrupted healthcare

The adoption of mHealth technology largely depends on technological advancements on the telecommunications front. In the past few years, the mHealth market has benefited from the growing penetration of high-speed connectivity, including 3G, 4G, and broadband services. In 2018, the number of broadband registered subscribers was 5.2 billion; it was expected to reach 6.5 billion subscribers in 2021.

The increasing utilization of mobile platforms in the healthcare industry to improve the accessibility of patient information and significant investments in the digital healthcare market are driving the adoption of 5G in the healthcare market. High-speed 5G networks can help quickly and reliably transport huge data files of medical imagery, improving both access to care and the quality of care. While augmented reality (AR), virtual reality (VR), and spatial computing are already being used in healthcare on a limited basis, 5G may eventually further enhance a doctor’s ability to deliver innovative, less invasive treatments. 5G has lower latency and higher capacity, which helps healthcare systems to offer remote monitoring for more patients. Furthermore, the high standard of virtual care and the presence & potential of 5G are expected to improve healthcare delivery significantly. On the other hand, 5G Enhanced Mobile Broadband (eMBB) technology?has helped ensure remote support and quality healthcare while reducing the chances of patient exposure to contagions (especially during the COVID-19 pandemic).

The high penetration of 4G/5G networks in the North American region supports video calling and high-speed data transfer to help deliver telemedicine services. 5G networks enable superior customer experience in terms of better picture quality, reduced image distortion for video calls, and quicker data transfer than those offered by 4G networks.

Wi-Fi has emerged as a dominant standard for wireless LANs worldwide. With a range of services running over Medical Mobility (MM) networks, it is possible to access real-time patient data through connected devices. As Bluetooth and Wi-Fi technologies become more pervasive, the healthcare industry will benefit from this technology evolution and enable greater penetration of connected medical devices in the coming years, thus paving the route for growth opportunities in mHealth.

Restraints: Resistance from traditional healthcare providers & limited guidance from physicians

The effective utilization of mobile apps and wireless technology can change the face of mHealth service delivery. However, patients typically find it difficult to look for healthcare apps due to the lack of guidance or support from their doctors. Many experienced or traditional healthcare providers are hesitant to adopt healthcare IT solutions or mHealth apps in their daily practices. Most of this reluctance is due to a lack of IT knowledge. Some healthcare professionals also feel that utilizing these apps is time-consuming, with limited or no clinical benefits. Furthermore, the lack of a standard metric to measure the benefits of these solutions has resulted in a general reluctance (among doctors and physicians) to utilize and prescribe these advanced technologies.

Thus, while physicians recognize the potential benefits of mobile healthcare apps, they remain wary of formally recommending apps to patients without evidence of their benefits, clear professional guidelines regarding their use in practice, and confidence in the security of personal health information that may be generated or transmitted by the app. Thus, patients do not use mHealth apps and devices to their full extent. This is expected to limit market growth to a certain extent.

The adoption of mobile medical apps by professionals can be potentially improved by increasing awareness among healthcare professionals and offering inputs or incentives to physicians for recommending mHealth technologies to their patients. Engaging physicians can also create awareness during phases of app development and clinical pilot testing of these apps. This would also help in ensuring the clinical relevance of the app and promoting its utility for achieving maximum clinical benefits.

Although the adoption of healthcare apps is gradually increasing, a lack of physician acceptance may result in lower-than-expected growth of the mHealth apps and solutions market in the coming years

Opportunities: Growing adoption of mHealth solutions in other mobile platforms

The prime aim of mHealth is to provide remote healthcare solutions leveraging advanced telecommunication technologies. Currently, this market is restricted to smartphone-linked solutions, although a few companies, such as Samsung, have introduced new platforms and smart TVs in the healthcare market. Other mHealth devices include next-generation watches, wearable medical devices, and portable medical devices capable of running medical software applications. Considering the fast adoption of mHealth, such new additions of hardware solutions in the market are expected to find greater acceptance among healthcare professionals and patients as long as they can offer remote monitoring or consultation services. However, the best possible way is to convert the daily used mobile gadgets into medical devices so that no additional cost is incurred in using the technology. The device manufacturer and software developer can seize these untapped market opportunities to introduce breakthrough technologies in the mHealth market.

Challenges: Lack of data security and concerns regarding data theft and healthcare fraud

Security concerns about proprietary data and applications are considered a major hindrance to the growth of the market. Since mobile healthcare is an emerging market, there are no standard frameworks to secure data stored and shared using healthcare apps. One of the major risks of using mHealth is the theft of Protected Health Information (PHI), such as health insurance numbers, by third parties who can commit healthcare fraud using confidential information. On the other hand, many organizations lack the resources to secure these technologies.

Since mobile phones play a critical role in the mHealth market, a simple loss or theft of a mobile device loaded with unencrypted patient data could cause a security breach with serious consequences. Such privacy breaches could lead to enforcement actions by the Department of Health and Human Services (HHS) under the Health Insurance Portability and Accountability Act (HIPAA) in the US. Although mobile healthcare offers various advantages, its security issues slow the adoption of mobile technology in the healthcare arena.

mHealth Solutions Market Ecosystem

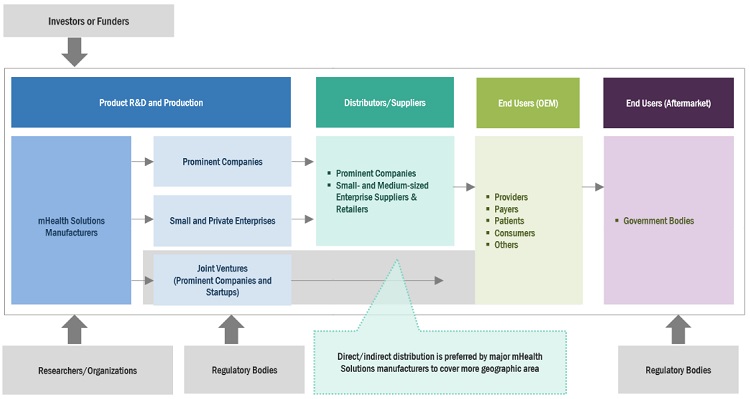
Prominent companies in this market include well-established, financially stable manufacturers of mHealth Solutions. These companies have been operating in the market for several years and possess a diversified product portfolio, state-of-the-art technologies, and strong global sales and marketing networks. Prominent companies in this market include Philips N.V. (Netherlands), Medtronic plc (Ireland), Johnson & Johnson (US), OMRON Healthcare Co., Ltd. (Japan), Cerner Corporation (US), Apple, Inc. (US), AliveCor, Inc. (US), AirStrip Technologies (US), athenahealth, Inc. (US), iHealth Lab Inc. (US), AT&T Inc. (US), AgaMatrix, Inc. (US), Cisco Systems, Inc. (US), Fitbit Inc. (US), OSP Labs (US), SoftServe (US), Garmin, Ltd. (US), Dexcom, Inc. (US), Tunstall Healthcare (UK), Teladoc Health, Inc. (US), ZTE Corporation (China), and My mHealth Limited (UK).
mHealth Solutions Market Ecosystem

mHealth Services to register the highest growth in the product & service segment of mHealth Solutions market in 2022.

On the basis of product & service, the healthcare provider solutions segment to register highest growth. The mHealth services segment is expected to grow at the highest CAGR during the forecast period. The rising global adoption of smartphones, availability of high-speed networks, and rising demand for remote patient monitoring and consultation are the key factors driving the growth of the mHealth services segment

Healthcare providers is the highest growing end user segment of the mHealth solutions market

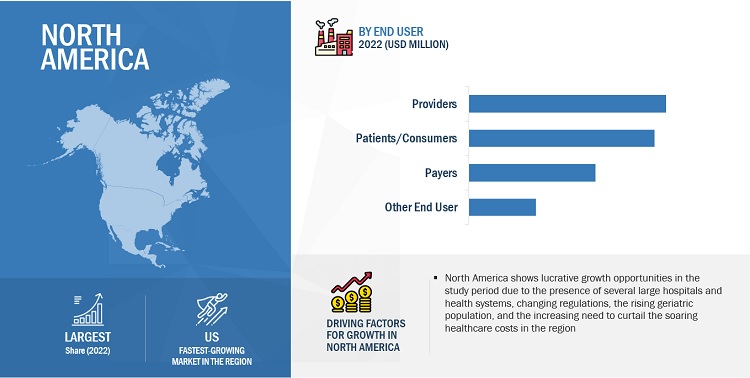
Based on end user, the healthcare providers segment is expected to grow at a significant CAGR during the forecast period.The easy availability of mobile phones has extended even to low and middle-income countries. Thus, most diseases and chronic conditions can be virtually screened globally. Chronic diseases demand frequent hospital visits, regular check-ups, and multiple lifestyle changes deemed necessary by a physician. mHealth can help efficiently influence the patient’s awareness of their condition, lifestyle interventions, clinical decisions, medication adherence, screening regimens, and rehabilitation support. Individuals suffering from chronic diseases have sought mHealth as a convenient and affordable approach to managing their disease. Owing to these factors, the market for providers in the mHealth solutions space is growing steadily.

North America accounted for the largest share of the mHealth Solutions market during the forecast period.

In 2022, North America accounted for the largest share of the market, followed by Europe, Asia Pacific, Latin America, and the Middle East & Africa. The large share of North America can be attributed to factors such as the increasing penetration of smartphones and mHealth solutions, growing use of connected devices and mHealth apps for managing chronic diseases, and increasing healthcare expenditure
mHealth Solutions Market by Region

To know about the assumptions considered for the study, download the pdf brochure

The products and services market is dominated by a few globally established players such as Koninklijke Philips N.V. (Netherlands), Medtronic plc (Ireland), Johnson & Johnson (US), OMRON Healthcare Co., Ltd. (Japan), Cerner Corporation (US), Apple, Inc. (US), AliveCor, Inc. (US), AirStrip Technologies (US), athenahealth, Inc. (US), iHealth Lab Inc. (US), AT&T Inc. (US), AgaMatrix, Inc. (US), Cisco Systems, Inc. (US), Fitbit Inc. (US), OSP Labs (US), SoftServe (US), Garmin, Ltd. (US), Dexcom, Inc. (US), Tunstall Healthcare (UK), Teladoc Health, Inc. (US), ZTE Corporation (China), and My mHealth Limited (UK).

mHealth Solutions Market Report Scope:

Report Metric

Details

Market size available for years

2021–2028

Base year considered

2022

Forecast period

2023–2028

Forecast units

Million/Billion (USD)

Segments covered

Product & Services, End user, and region.

Geographies covered

North America, Europe, Asia Pacific, Latin America, and Middle East and Africa

Companies covered

Koninklijke Philips N.V. (Netherlands), Medtronic plc (Ireland), Johnson & Johnson (US), Omron Healthcare Co., Ltd. (Japan), Cerner Corporation (US), Apple, Inc. (US), AliveCor, Inc. (US), AirStrip Technologies (US), athenahealth, Inc. (US), iHealth Lab Inc. (US), AT&T Inc. (US), AgaMatrix, Inc. (US), Cisco Systems, Inc. (US), Fitbit Inc. (US), Vodafone Group Plc (UK), Qualcomm Technologies, Inc. (US), OSP Labs (US), SoftServe (US), Garmin, Ltd. (US), Dexcom, Inc. (US), Tunstall Healthcare (UK), Teladoc Health, Inc. (US), ZTE Corporation (China), Omada Health (US), and My Mhealth Limited (UK).

The study categorizes the mHealth Solutions market based on product & services, end user at regional and global level.

By Product & Service

  •  Introduction
  • mHealth Apps
    • Healthcare Apps
      • Chronic care management apps
        • Mental health & behavioral disorder management apps
        • Diabetes management apps
        • Blood pressure & ECG monitoring apps
        • Cancer management apps
        • Other chronic care management apps
      • General health & fitness apps
        • Health tracking apps
        • Obesity & weight management apps
        • Fitness & nutrition apps
      • Medication management apps
      • Women’s health apps
        • Pregnancy apps
        • Breastfeeding apps
        • Fertility apps
        • Other women’s health apps
      • Personal health record apps
      • Other healthcare apps  
    • Medical Apps
      • Patient management & monitoring apps
      • Medical reference apps
      • Communication & consulting apps
      • Continuing medical education apps
  • Connected Medical devices
    • Vital Signs Monitoring Devices
      • Blood pressure monitors
      • Blood glucose meters
      • ECG/heart rate monitors
      • Pulse oximeters
    • Peak flow meters
    • Sleep apnea monitors
    • Multiparameter trackers
    • Fetal monitoring devices
    • Neurological monitoring devices
    • Other connected medical devices
  • mHealth Services
    • Remote monitoring services
    • Diagnosis & Consultation services
    • Treatment services
    • Healthcare system strengthening services
    • Fitness & wellness services
    • Prevention services

By End User

  • Introduction
  • Healthcare Providers
  • Healthcare Payers
  • Patients/Consumers
  • Other end users

By Region

  • North America
    • US
    • Canada
  • Europe
    • Germany
    • France
    • UK
    • Italy
    • Spain
    • RoE
  • Asia Pacific
    • Japan
    • China
    • India
    • RoAPAC
  • Latin America
    • Brazil
    • Mexico
    • RoLATAM
  • Middle East & Africa

Recent Developments

  • In February 2023 Vodafone (UK) partnered with  Charité Berlin, Leipzig University Hospital (Berlin).The collaboration with Charité Berlin (one of Europe’s largest university hospitals), Leipzig University Hospital, and 16 other leading research and medical experts across Germany enabled Vodafone to explore future medical applications using 6G.
  • In  January 2023 Koninklijke Philips (Netherlands) partnered with Masimo (US). The partnership aimed to augment patient monitoring capabilities in home telehealth applications with the Masimo W1 advanced health-tracking watch.
  • In January 2023, Garmin (US) launched Instinct Crossover in India, which delivers Garmin’s full suite of wellness features, including Sleep Score and Advanced Sleep Monitoring, and Health Monitoring activities.

Frequently Asked Questions (FAQ):

To speak to our analyst for a discussion on the above findings, click Speak to Analyst

TABLE OF CONTENTS
 
1 INTRODUCTION (Page No. - 40)
    1.1 STUDY OBJECTIVES 
    1.2 MARKET DEFINITION 
           1.2.1 INCLUSIONS AND EXCLUSIONS
    1.3 MARKET SCOPE 
          FIGURE 1 MHEALTH SOLUTIONS MARKET SEGMENTATION
    1.4 YEARS CONSIDERED 
    1.5 CURRENCY CONSIDERED 
          TABLE 1 EXCHANGE RATES UTILIZED FOR CONVERSION TO USD
    1.6 STAKEHOLDERS 
    1.7 SUMMARY OF CHANGES 
           1.7.1 RECESSION IMPACT
 
2 RESEARCH METHODOLOGY (Page No. - 44)
    2.1 RESEARCH APPROACH 
          FIGURE 2 RESEARCH DESIGN
           2.1.1 SECONDARY RESEARCH
                    2.1.1.1 Key data from secondary sources
           2.1.2 PRIMARY RESEARCH
                    FIGURE 3 PRIMARY SOURCES
                    2.1.2.1 Key data from primary sources
                    2.1.2.2 Breakdown of primaries
                                FIGURE 4 BREAKDOWN OF PRIMARY INTERVIEWS: BY COMPANY TYPE, DESIGNATION, AND REGION
                    2.1.2.3 Insights from primary experts
    2.2 MARKET SIZE ESTIMATION 
          FIGURE 5 BOTTOM-UP APPROACH
          FIGURE 6 TOP-DOWN APPROACH
          FIGURE 7 CAGR PROJECTIONS: SUPPLY-SIDE ANALYSIS
    2.3 MARKET BREAKDOWN DATA TRIANGULATION 
          FIGURE 8 DATA TRIANGULATION METHODOLOGY
    2.4 MARKET SHARE ESTIMATION 
    2.5 STUDY ASSUMPTIONS 
    2.6 RESEARCH LIMITATIONS 
           2.6.1 METHODOLOGY-RELATED LIMITATIONS
           2.6.2 SCOPE-RELATED LIMITATIONS
    2.7 RISK ASSESSMENT 
          TABLE 2 RISK ASSESSMENT: MHEALTH SOLUTIONS MARKET
    2.8 IMPACT OF RECESSION ON MHEALTH SOLUTIONS MARKET 
 
3 EXECUTIVE SUMMARY (Page No. - 57)
    FIGURE 9 MHEALTH SOLUTIONS MARKET, BY PRODUCT & SERVICE, 2023 VS. 2028 (USD BILLION)
    FIGURE 10 CONNECTED MEDICAL DEVICES MARKET, BY TYPE, 2023 VS. 2028 (USD BILLION)
    FIGURE 11 MHEALTH APPS MARKET, BY TYPE, 2023 VS. 2028 (USD BILLION)
    FIGURE 12 MHEALTH SERVICES MARKET, BY TYPE, 2023 VS. 2028 (USD BILLION)
    FIGURE 13 MHEALTH SOLUTIONS MARKET, BY END USER, 2023 VS. 2028 (USD BILLION)
    FIGURE 14 MHEALTH SOLUTIONS MARKET: REGIONAL SNAPSHOT
 
4 PREMIUM INSIGHTS (Page No. - 62)
    4.1 MHEALTH SOLUTIONS MARKET OVERVIEW 
          FIGURE 15 INCREASING PENETRATION OF SMARTPHONES, TABLETS, AND OTHER MOBILE PLATFORMS TO DRIVE MARKET GROWTH
    4.2 ASIA PACIFIC: MHEALTH SOLUTIONS MARKET, BY PRODUCT & SERVICE 
          FIGURE 16 MHEALTH APPS TO COMMAND LARGEST SHARE IN 2023
    4.3 GEOGRAPHIC SNAPSHOT OF MHEALTH SOLUTIONS MARKET 
          FIGURE 17 MARKET IN CHINA TO GROW AT HIGHEST CAGR
    4.4 REGIONAL MIX: MHEALTH SOLUTIONS MARKET 
          FIGURE 18 ASIA PACIFIC TO WITNESS HIGHEST GROWTH DURING FORECAST PERIOD
    4.5 MHEALTH SOLUTIONS MARKET: DEVELOPED VS. DEVELOPING MARKETS 
          FIGURE 19 DEVELOPING MARKETS TO REGISTER HIGHER GROWTH RATES
 
5 MARKET OVERVIEW (Page No. - 66)
    5.1 INTRODUCTION 
    5.2 MARKET DYNAMICS 
          TABLE 3 MARKET DYNAMICS: MHEALTH SOLUTIONS MARKET
           5.2.1 DRIVERS
                    5.2.1.1 Increasing penetration of smartphones, tablets, and other mobile platforms
                                FIGURE 20 SMARTPHONE USERS WORLDWIDE, 2016–2027
                    5.2.1.2 Increasing utilization of connected devices and mHealth apps to manage chronic diseases
                    5.2.1.3 Cost containment in healthcare delivery
                    5.2.1.4 Growing penetration of 4G & 5G networks to ensure uninterrupted healthcare
                                FIGURE 21 NUMBER OF MOBILE BROADBAND SUBSCRIPTIONS, 2011–2021
                    5.2.1.5 Rising focus on patient-centric healthcare delivery
                    5.2.1.6 Increasing demand for home healthcare services
           5.2.2 RESTRAINTS
                    5.2.2.1 Lack of standards & regulations and insufficient reimbursement
                    5.2.2.2 Resistance from traditional healthcare providers & limited guidance from physicians
           5.2.3 OPPORTUNITIES
                    5.2.3.1 Growing adoption of mHealth solutions in other mobile platforms
           5.2.4 CHALLENGES
                    5.2.4.1 Authenticity and reliability
                    5.2.4.2 Patent protection for mHealth devices and apps
                    5.2.4.3 Lack of data security and concerns regarding data theft and healthcare fraud
 
6 INDUSTRY INSIGHTS (Page No. - 74)
    6.1 INDUSTRY TRENDS 
           6.1.1 INCREASING UTILIZATION OF MHEALTH SOLUTIONS FOR PERSONALIZED PATIENT ENGAGEMENT
           6.1.2 RISE OF DIGITAL THERAPEUTICS
           6.1.3 REMOTE MONITORING AND GROWING FOCUS ON CONSUMER-CENTRIC MOBILITY SOLUTIONS
           6.1.4 APPLICATIONS OF CLOUD-BASED MHEALTH SOLUTIONS IN HEALTHCARE
           6.1.5 WEARABLE HEALTH SENSORS
                    TABLE 4 NOTABLE WEARABLE DEVICES OFFERED BY PLAYERS
           6.1.6 INCREASING DEMAND FOR URGENT CARE APPS
                    TABLE 5 NOTABLE URGENT CARE APPS OFFERED BY PLAYERS
           6.1.7 FUTURE TRENDS IN MHEALTH DEVICES
           6.1.8 ADOPTION ANALYSIS OF CONNECTED DEVICES
                    FIGURE 22 ADOPTION OF HIGH-GROWTH CONNECTED DEVICES DURING NEXT FIVE YEARS
    6.2 MHEALTH APPS: MARKET HIGHLIGHTS 
           6.2.1 DEMAND AND SUPPLY
           6.2.2 ADOPTION ANALYSIS
                    FIGURE 23 APPLICATION OF MHEALTH APPS DURING NEXT FIVE YEARS
                    FIGURE 24 ADOPTION OF HIGH-GROWTH THERAPEUTIC APPS DURING NEXT FIVE YEARS
           6.2.3 MHEALTH REVENUE TRENDS
                    TABLE 6 REVENUE SOURCES: MHEALTH SOLUTIONS MARKET
           6.2.4 FUTURE TRENDS
    6.3 MOBILE HEALTHCARE ECOSYSTEM: STAKEHOLDER ANALYSIS 
          FIGURE 25 MOBILE HEALTHCARE ECOSYSTEM
          FIGURE 26 MHEALTH REVENUE SHARE, BY STAKEHOLDER, 2022
           6.3.1 MHEALTH DEVICE MANUFACTURERS
           6.3.2 APPLICATION DEVELOPERS
           6.3.3 MHEALTH SERVICE PROVIDERS
           6.3.4 NETWORK PROVIDERS
 
7 MHEALTH SOLUTIONS MARKET, BY PRODUCT & SERVICE (Page No. - 85)
    7.1 INTRODUCTION 
          FIGURE 27 MHEALTH SOLUTIONS MARKET SEGMENTATION, BY PRODUCT & SERVICE
          TABLE 7 MHEALTH SOLUTIONS MARKET, BY PRODUCT & SERVICE, 2021–2028 (USD MILLION)
    7.2 MHEALTH APPS 
          TABLE 8 MHEALTH APPS MARKET, BY TYPE, 2021–2028 (USD MILLION)
          TABLE 9 MHEALTH APPS MARKET, BY COUNTRY, 2021–2028 (USD MILLION)
           7.2.1 HEALTHCARE APPS
                    TABLE 10 HEALTHCARE APPS MARKET, BY TYPE, 2021–2028 (USD MILLION)
                    TABLE 11 HEALTHCARE APPS MARKET, BY COUNTRY, 2021–2028 (USD MILLION)
                    7.2.1.1 Chronic care management apps
                                TABLE 12 CHRONIC CARE MANAGEMENT APPS MARKET, BY TYPE, 2021–2028 (USD MILLION)
                                TABLE 13 CHRONIC CARE MANAGEMENT APPS MARKET, BY COUNTRY, 2021–2028 (USD MILLION)
                               7.2.1.1.1 Mental health & behavioral disorder management apps
                                             7.2.1.1.1.1 Increased access to therapies through mobiles to drive growth
                                                               TABLE 14 MENTAL HEALTH & BEHAVIORAL DISORDER MANAGEMENT APPS OFFERED BY KEY MARKET PLAYERS
                                                               TABLE 15 MENTAL HEALTH & BEHAVIORAL DISORDER MANAGEMENT APPS MARKET, BY COUNTRY, 2021–2028 (USD MILLION)
                               7.2.1.1.2 Diabetes management apps
                                             7.2.1.1.2.1 Growing prevalence of diabetes to drive demand
                                                               TABLE 16 DIABETES MANAGEMENT APPS OFFERED BY KEY MARKET PLAYERS
                                                               TABLE 17 DIABETES MANAGEMENT APPS MARKET, BY COUNTRY, 2021–2028 (USD MILLION)
                               7.2.1.1.3 Blood pressure & ECG monitoring apps
                                             7.2.1.1.3.1 Rising incidence of CVDs to boost market
                                                               TABLE 18 BLOOD PRESSURE & ECG MONITORING APPS OFFERED BY KEY MARKET PLAYERS
                                                               TABLE 19 BLOOD PRESSURE & ECG MONITORING APPS MARKET, BY COUNTRY, 2021–2028 (USD MILLION)
                               7.2.1.1.4 Cancer management apps
                                             7.2.1.1.4.1 Need to educate patients on news and trends in oncology to support app usage
                                                               TABLE 20 CANCER MANAGEMENT APPS OFFERED BY KEY MARKET PLAYERS
                                                               TABLE 21 CANCER MANAGEMENT APPS MARKET, BY COUNTRY, 2021–2028 (USD MILLION)
                               7.2.1.1.5 Other chronic care management apps
                                              TABLE 22 OTHER CHRONIC CARE MANAGEMENT APPS OFFERED BY KEY MARKET PLAYERS
                                              TABLE 23 OTHER CHRONIC CARE MANAGEMENT APPS MARKET, BY COUNTRY, 2021–2028 (USD MILLION)
                    7.2.1.2 General health & fitness apps
                                TABLE 24 GENERAL HEALTH & FITNESS APPS MARKET, BY TYPE, 2021–2028 (USD MILLION)
                                TABLE 25 GENERAL HEALTH & FITNESS APPS MARKET, BY COUNTRY, 2021–2028 (USD MILLION)
                               7.2.1.2.1 Health tracking apps
                                             7.2.1.2.1.1 Growing preference for health self-management to drive market
                                                               TABLE 26 HEALTH TRACKING APPS MARKET, BY COUNTRY, 2021–2028 (USD MILLION)
                               7.2.1.2.2 Obesity & weight management apps
                                             7.2.1.2.2.1 Rising obese population to increase demand for apps
                                                               TABLE 27 OBESITY & WEIGHT MANAGEMENT APPS OFFERED BY KEY MARKET PLAYERS
                                                               TABLE 28 OBESITY & WEIGHT MANAGEMENT APPS MARKET, BY COUNTRY, 2021–2028 (USD MILLION)
                               7.2.1.2.3 Fitness & nutrition apps
                                             7.2.1.2.3.1 Rising demand for support in meeting food and fitness goals to boost adoption
                                                               TABLE 29 FITNESS & NUTRITION APPS OFFERED BY KEY MARKET PLAYERS
                                                               TABLE 30 FITNESS & NUTRITION APPS MARKET, BY COUNTRY, 2021–2028 (USD MILLION)
                    7.2.1.3 Medication management apps
                               7.2.1.3.1 Increasing awareness of self-care to drive market growth
                                              TABLE 31 MEDICAL MANAGEMENT APPS OFFERED BY KEY MARKET PLAYERS
                                              TABLE 32 MEDICATION MANAGEMENT APPS MARKET, BY COUNTRY, 2021–2028 (USD MILLION)
                    7.2.1.4 Women’s health apps
                                TABLE 33 WOMEN’S HEALTH APPS MARKET, BY TYPE, 2021–2028 (USD MILLION)
                                TABLE 34 WOMEN’S HEALTH APPS MARKET, BY COUNTRY, 2021–2028 (USD MILLION)
                               7.2.1.4.1 Pregnancy apps
                                             7.2.1.4.1.1 Increasing awareness & focus of women on health during pregnancy to bolster growth
                                                               TABLE 35 PREGNANCY APPS MARKET, BY COUNTRY, 2021–2028 (USD MILLION)
                               7.2.1.4.2 Breastfeeding apps
                                             7.2.1.4.2.1 Rising awareness about baby care to play a pivotal role in growth
                                                               TABLE 36 BREASTFEEDING APPS MARKET, BY COUNTRY, 2021–2028 (USD MILLION)
                               7.2.1.4.3 Fertility apps
                                             7.2.1.4.3.1 Increasing prevalence of reproductive organ disorders to boost market
                                                               TABLE 37 FERTILITY APPS MARKET, BY COUNTRY, 2021–2028 (USD MILLION)
                               7.2.1.4.4 Other women’s health apps
                                              TABLE 38 OTHER WOMEN’S HEALTH APPS MARKET, BY COUNTRY, 2021–2028 (USD MILLION)
                    7.2.1.5 Personal health record apps
                               7.2.1.5.1 Convenience of personal health apps in scheduling appointments and viewing test results to support adoption
                                              TABLE 39 PERSONAL HEALTH RECORD APPS MARKET, BY COUNTRY, 2021–2028 (USD MILLION)
                    7.2.1.6 Other healthcare apps
                                TABLE 40 OTHER HEALTHCARE APPS MARKET, BY COUNTRY, 2021–2028 (USD MILLION)
           7.2.2 MEDICAL APPS
                    TABLE 41 MEDICAL APPS MARKET, BY TYPE, 2021–2028 (USD MILLION)
                    TABLE 42 MEDICAL APPS MARKET, BY COUNTRY, 2021–2028 (USD MILLION)
                    7.2.2.1 Patient management & monitoring apps
                               7.2.2.1.1 Growing availability and enhanced quality of medical software apps to drive market
                                              TABLE 43 PATIENT MANAGEMENT & MONITORING APPS OFFERED BY KEY MARKET PLAYERS
                                              TABLE 44 PATIENT MANAGEMENT & MONITORING APPS MARKET, BY COUNTRY, 2021–2028 (USD MILLION)
                    7.2.2.2 Medical reference apps
                               7.2.2.2.1 Reliability issues and resistance from physicians to limit adoption
                                              TABLE 45 MEDICAL REFERENCE APPS OFFERED BY KEY MARKET PLAYERS
                                              TABLE 46 MEDICAL REFERENCE APPS MARKET, BY COUNTRY, 2021–2028 (USD MILLION)
                    7.2.2.3 Communication & consulting apps
                               7.2.2.3.1 Rising focus on patient-centric care delivery to boost usage
                                              TABLE 47 COMMUNICATION & CONSULTING APPS OFFERED BY KEY MARKET PLAYERS
                                              TABLE 48 COMMUNICATION & CONSULTING APPS MARKET, BY COUNTRY, 2021–2028 (USD MILLION)
                    7.2.2.4 Continuing medical education apps
                               7.2.2.4.1 Rapid adoption of touchscreen tablets to push deployment of CME apps
                                              TABLE 49 MEDICAL EDUCATION APPS OFFERED BY KEY MARKET PLAYERS
                                              TABLE 50 CONTINUING MEDICAL EDUCATION APPS MARKET, BY COUNTRY, 2021–2028 (USD MILLION)
    7.3 CONNECTED MEDICAL DEVICES 
          TABLE 51 CONNECTED MEDICAL DEVICES MARKET, BY TYPE, 2021–2028 (USD MILLION)
          TABLE 52 CONNECTED MEDICAL DEVICES MARKET, BY COUNTRY, 2021–2028 (USD MILLION)
           7.3.1 VITAL SIGNS MONITORING DEVICES
                    TABLE 53 VITAL SIGNS MONITORING DEVICES MARKET, BY TYPE, 2021–2028 (USD MILLION)
                    TABLE 54 VITAL SIGNS MONITORING DEVICES MARKET, BY COUNTRY, 2021–2028 (USD MILLION)
                    7.3.1.1 Blood pressure monitors
                               7.3.1.1.1 Rising prevalence of hypertension to boost demand
                                              TABLE 55 BLOOD PRESSURE MONITORS OFFERED BY KEY MARKET PLAYERS
                                              TABLE 56 BLOOD PRESSURE MONITORS MARKET, BY COUNTRY, 2021–2028 (USD MILLION)
                    7.3.1.2 Blood glucose meters
                               7.3.1.2.1 Increasing diabetic population to propel adoption of blood glucose monitoring devices
                                              TABLE 57 BLOOD GLUCOSE METERS OFFERED BY KEY MARKET PLAYERS
                                              TABLE 58 BLOOD GLUCOSE METERS MARKET, BY COUNTRY, 2021–2028 (USD MILLION)
                    7.3.1.3 ECG/heart rate monitors
                               7.3.1.3.1 Growing prevalence of coronary diseases to support market
                                              TABLE 59 ECG MONITORS OFFERED BY KEY MARKET PLAYERS
                                              TABLE 60 ECG/HEART RATE MONITORS MARKET, BY COUNTRY, 2021–2028 (USD MILLION)
                    7.3.1.4 Pulse oximeters
                               7.3.1.4.1 Rising adoption for self-monitoring to propel market
                                              TABLE 61 PULSE OXIMETERS OFFERED BY KEY MARKET PLAYERS
                                              TABLE 62 PULSE OXIMETERS MARKET, BY COUNTRY, 2021–2028 (USD MILLION)
           7.3.2 PEAK FLOW METERS
                    7.3.2.1 Increasing asthma prevalence to contribute to market growth
                                TABLE 63 PEAK FLOW METERS OFFERED BY KEY MARKET PLAYERS
                                TABLE 64 PEAK FLOW METERS MARKET, BY COUNTRY, 2021–2028 (USD MILLION)
           7.3.3 SLEEP APNEA MONITORS
                    7.3.3.1 Rising instances of chronic snoring to drive demand for sleep apnea monitors
                                TABLE 65 SLEEP APNEA MONITORS OFFERED BY KEY PLAYERS
                                TABLE 66 SLEEP APNEA MONITORS MARKET, BY COUNTRY, 2021–2028 (USD MILLION)
           7.3.4 MULTIPARAMETER TRACKERS
                    7.3.4.1 Rising prevalence of chronic diseases to boost market
                                TABLE 67 MULTIPARAMETER TRACKERS OFFERED BY KEY MARKET PLAYERS
                                TABLE 68 MULTIPARAMETER TRACKERS MARKET, BY COUNTRY, 2021–2028 (USD MILLION)
           7.3.5 FETAL MONITORING DEVICES
                    7.3.5.1 Rising preterm births from successful in vitro fertilization to bolster growth
                                TABLE 69 FETAL MONITORING DEVICES OFFERED BY KEY MARKET PLAYERS
                                TABLE 70 FETAL MONITORING DEVICES MARKET, BY COUNTRY, 2021–2028 (USD MILLION)
           7.3.6 NEUROLOGICAL MONITORING DEVICES
                    7.3.6.1 Increasing prevalence of neurological diseases to drive growth
                                TABLE 71 NEUROLOGICAL MONITORING DEVICES OFFERED BY KEY MARKET PLAYERS
                                TABLE 72 NEUROLOGICAL MONITORING DEVICES MARKET, BY COUNTRY, 2021–2028 (USD MILLION)
           7.3.7 OTHER CONNECTED MEDICAL DEVICES
                    TABLE 73 OTHER CONNECTED MEDICAL DEVICES OFFERED BY KEY MARKET PLAYERS
                    TABLE 74 OTHER CONNECTED MEDICAL DEVICES MARKET, BY COUNTRY, 2021–2028 (USD MILLION)
    7.4 MHEALTH SERVICES 
          TABLE 75 MHEALTH SERVICES MARKET, BY TYPE, 2021–2028 (USD MILLION)
          TABLE 76 MHEALTH SERVICES MARKET, BY COUNTRY, 2021–2028 (USD MILLION)
           7.4.1 REMOTE MONITORING SERVICES
                    7.4.1.1 Shift toward home healthcare to boost demand
                                TABLE 77 REMOTE MONITORING SERVICES OFFERED BY KEY MARKET PLAYERS
                                TABLE 78 REMOTE MONITORING SERVICES MARKET, BY COUNTRY, 2021–2028 (USD MILLION)
           7.4.2 DIAGNOSIS & CONSULTATION SERVICES
                    7.4.2.1 Need to enhance healthcare access to propel demand
                                TABLE 79 DIAGNOSIS & CONSULTATION SERVICES OFFERED BY KEY MARKET PLAYERS
                                TABLE 80 DIAGNOSIS & CONSULTATION SERVICES MARKET, BY COUNTRY, 2021–2028 (USD MILLION)
           7.4.3 TREATMENT SERVICES
                    7.4.3.1 Demand for remote treatment to boost market
                                TABLE 81 TREATMENT SERVICES OFFERED BY KEY MARKET PLAYERS
                                TABLE 82 TREATMENT SERVICES MARKET, BY COUNTRY, 2021–2028 (USD MILLION)
           7.4.4 HEALTHCARE SYSTEM STRENGTHENING SERVICES
                    7.4.4.1 Need to collate information and track outbreaks to support adoption
                                TABLE 83 HEALTHCARE SYSTEM STRENGTHENING SERVICES MARKET, BY COUNTRY, 2021–2028 (USD MILLION)
           7.4.5 FITNESS & WELLNESS SERVICES
                    7.4.5.1 Rising health awareness in developed countries to boost adoption
                                TABLE 84 FITNESS & WELLNESS SERVICES OFFERED BY KEY MARKET PLAYERS
                                TABLE 85 FITNESS & WELLNESS SERVICES MARKET, BY COUNTRY, 2021–2028 (USD MILLION)
           7.4.6 PREVENTION SERVICES
                    7.4.6.1 Rising disease prevalence to propel demand for prevention services
                                TABLE 86 PREVENTION SERVICES MARKET, BY COUNTRY, 2021–2028 (USD MILLION)
 
8 MHEALTH SOLUTIONS MARKET, BY END USER (Page No. - 153)
    8.1 INTRODUCTION 
          TABLE 87 MHEALTH SOLUTIONS MARKET, BY END USER, 2021–2028 (USD MILLION)
    8.2 PROVIDERS 
           8.2.1 PROVIDERS TO HOLD LARGEST MARKET SHARE
                    TABLE 88 MHEALTH SOLUTIONS MARKET FOR PROVIDERS, BY COUNTRY, 2021–2028 (USD MILLION)
    8.3 PATIENTS/CONSUMERS 
           8.3.1 RISING DISEASE PREVALENCE AND EMERGENCE OF ADVANCED WEARABLE MONITORS TO DRIVE DEMAND
                    TABLE 89 MHEALTH SOLUTIONS MARKET FOR PATIENTS/CONSUMERS, BY COUNTRY, 2021–2028 (USD MILLION)
    8.4 PAYERS 
           8.4.1 POTENTIAL TO REDUCE READMISSIONS AND OVERHEAD COSTS TO DRIVE ADOPTION
                    TABLE 90 MHEALTH SOLUTIONS MARKET FOR PAYERS, BY COUNTRY, 2021–2028 (USD MILLION)
    8.5 OTHER END USERS 
          TABLE 91 MHEALTH SOLUTIONS MARKET FOR OTHER END USERS, BY COUNTRY, 2021–2028 (USD MILLION)
 
9 MHEALTH SOLUTIONS MARKET, BY REGION (Page No. - 160)
    9.1 INTRODUCTION 
          TABLE 92 MHEALTH SOLUTIONS MARKET, BY REGION, 2021–2028 (USD MILLION)
    9.2 NORTH AMERICA 
          FIGURE 28 NORTH AMERICA: MHEALTH SOLUTIONS MARKET SNAPSHOT, 2022
           9.2.1 NORTH AMERICA: IMPACT OF ECONOMIC RECESSION
                    TABLE 93 NORTH AMERICA: MHEALTH SOLUTIONS MARKET, BY COUNTRY, 2021–2028 (USD MILLION)
                    TABLE 94 NORTH AMERICA: MHEALTH SOLUTIONS MARKET, BY PRODUCT & SERVICE, 2021–2028 (USD MILLION)
                    TABLE 95 NORTH AMERICA: MHEALTH APPS MARKET, BY TYPE, 2021–2028 (USD MILLION)
                    TABLE 96 NORTH AMERICA: HEALTHCARE APPS MARKET, BY TYPE, 2021–2028 (USD MILLION)
                    TABLE 97 NORTH AMERICA: CHRONIC CARE MANAGEMENT APPS MARKET, BY TYPE, 2021–2028 (USD MILLION)
                    TABLE 98 NORTH AMERICA: GENERAL HEALTH & FITNESS APPS MARKET, BY TYPE, 2021–2028 (USD MILLION)
                    TABLE 99 NORTH AMERICA: WOMEN’S HEALTH APPS MARKET, BY TYPE, 2021–2028 (USD MILLION)
                    TABLE 100 NORTH AMERICA: MEDICAL APPS MARKET, BY TYPE, 2021–2028 (USD MILLION)
                    TABLE 101 NORTH AMERICA: CONNECTED MEDICAL DEVICES MARKET, BY TYPE, 2021–2028 (USD MILLION)
                    TABLE 102 NORTH AMERICA: VITAL SIGNS MONITORING DEVICES MARKET, BY TYPE, 2021–2028 (USD MILLION)
                    TABLE 103 NORTH AMERICA: MHEALTH SERVICES MARKET, BY TYPE, 2021–2028 (USD MILLION)
                    TABLE 104 NORTH AMERICA: MHEALTH SOLUTIONS MARKET, BY END USER, 2021–2028 (USD MILLION)
           9.2.2 US
                    9.2.2.1 US to dominate North American market
                                TABLE 105 US: MHEALTH SOLUTIONS MARKET, BY PRODUCT & SERVICE, 2021–2028 (USD MILLION)
                                TABLE 106 US: MHEALTH APPS MARKET, BY TYPE, 2021–2028 (USD MILLION)
                                TABLE 107 US: HEALTHCARE APPS MARKET, BY TYPE, 2021–2028 (USD MILLION)
                                TABLE 108 US: CHRONIC CARE MANAGEMENT APPS MARKET, BY TYPE, 2021–2028 (USD MILLION)
                                TABLE 109 US: GENERAL HEALTH & FITNESS APPS MARKET, BY TYPE, 2021–2028 (USD MILLION)
                                TABLE 110 US: WOMEN’S HEALTH APPS MARKET, BY TYPE, 2021–2028 (USD MILLION)
                                TABLE 111 US: MEDICAL APPS MARKET, BY TYPE, 2021–2028 (USD MILLION)
                                TABLE 112 US: CONNECTED MEDICAL DEVICES MARKET, BY TYPE, 2021–2028 (USD MILLION)
                                TABLE 113 US: VITAL SIGNS MONITORING DEVICES MARKET, BY TYPE, 2021–2028 (USD MILLION)
                                TABLE 114 US: MHEALTH SERVICES MARKET, BY TYPE, 2021–2028 (USD MILLION)
                                TABLE 115 US: MHEALTH SOLUTIONS MARKET, BY END USER, 2021–2028 (USD MILLION)
           9.2.3 CANADA
                    9.2.3.1 Need to curtail escalating healthcare costs to drive market
                                TABLE 116 CANADA: MHEALTH SOLUTIONS MARKET, BY PRODUCT & SERVICE, 2021–2028 (USD MILLION)
                                TABLE 117 CANADA: MHEALTH APPS MARKET, BY TYPE, 2021–2028 (USD MILLION)
                                TABLE 118 CANADA: HEALTHCARE APPS MARKET, BY TYPE, 2021–2028 (USD MILLION)
                                TABLE 119 CANADA: CHRONIC CARE MANAGEMENT APPS MARKET, BY TYPE, 2021–2028 (USD MILLION)
                                TABLE 120 CANADA: GENERAL HEALTH & FITNESS APPS MARKET, BY TYPE, 2021–2028 (USD MILLION)
                                TABLE 121 CANADA: WOMEN’S HEALTH APPS MARKET, BY TYPE, 2021–2028 (USD MILLION)
                                TABLE 122 CANADA: MEDICAL APPS MARKET, BY TYPE, 2021–2028 (USD MILLION)
                                TABLE 123 CANADA: CONNECTED MEDICAL DEVICES MARKET, BY TYPE, 2021–2028 (USD MILLION)
                                TABLE 124 CANADA: VITAL SIGNS MONITORING DEVICES MARKET, BY TYPE, 2021–2028 (USD MILLION)
                                TABLE 125 CANADA: MHEALTH SERVICES MARKET, BY TYPE, 2021–2028 (USD MILLION)
                                TABLE 126 CANADA: MHEALTH SOLUTIONS MARKET, BY END USER, 2021–2028 (USD MILLION)
    9.3 EUROPE 
           9.3.1 EUROPE: IMPACT OF ECONOMIC RECESSION
                    TABLE 127 EUROPE: MHEALTH SOLUTIONS MARKET, BY COUNTRY, 2021–2028 (USD MILLION)
                    TABLE 128 EUROPE: MHEALTH SOLUTIONS MARKET, BY PRODUCT & SERVICE, 2021–2028 (USD MILLION)
                    TABLE 129 EUROPE: MHEALTH APPS MARKET, BY TYPE, 2021–2028 (USD MILLION)
                    TABLE 130 EUROPE: HEALTHCARE APPS MARKET, BY TYPE, 2021–2028 (USD MILLION)
                    TABLE 131 EUROPE: CHRONIC CARE MANAGEMENT APPS MARKET, BY TYPE, 2021–2028 (USD MILLION)
                    TABLE 132 EUROPE: GENERAL HEALTH & FITNESS APPS MARKET, BY TYPE, 2021–2028 (USD MILLION)
                    TABLE 133 EUROPE: WOMEN’S HEALTH APPS MARKET, BY TYPE, 2021–2028 (USD MILLION)
                    TABLE 134 EUROPE: MEDICAL APPS MARKET, BY TYPE, 2021–2028 (USD MILLION)
                    TABLE 135 EUROPE: CONNECTED MEDICAL DEVICES MARKET, BY TYPE, 2021–2028 (USD MILLION)
                    TABLE 136 EUROPE: VITAL SIGNS MONITORING DEVICES MARKET, BY TYPE, 2021–2028 (USD MILLION)
                    TABLE 137 EUROPE: MHEALTH SERVICES MARKET, BY TYPE, 2021–2028 (USD MILLION)
                    TABLE 138 EUROPE: MHEALTH SOLUTIONS MARKET, BY END USER, 2021–2028 (USD MILLION)
           9.3.2 GERMANY
                    9.3.2.1 Need for better and improved healthcare services to drive adoption of mHealth
                                TABLE 139 GERMANY: MHEALTH SOLUTIONS MARKET, BY PRODUCT & SERVICE, 2021–2028 (USD MILLION)
                                TABLE 140 GERMANY: MHEALTH APPS MARKET, BY TYPE, 2021–2028 (USD MILLION)
                                TABLE 141 GERMANY: HEALTHCARE APPS MARKET, BY TYPE, 2021–2028 (USD MILLION)
                                TABLE 142 GERMANY: CHRONIC CARE MANAGEMENT APPS MARKET, BY TYPE, 2021–2028 (USD MILLION)
                                TABLE 143 GERMANY: GENERAL HEALTH & FITNESS APPS MARKET, BY TYPE, 2021–2028 (USD MILLION)
                                TABLE 144 GERMANY: WOMEN’S HEALTH APPS MARKET, BY TYPE, 2021–2028 (USD MILLION)
                                TABLE 145 GERMANY: MEDICAL APPS MARKET, BY TYPE, 2021–2028 (USD MILLION)
                                TABLE 146 GERMANY: CONNECTED MEDICAL DEVICES MARKET, BY TYPE, 2021–2028 (USD MILLION)
                                TABLE 147 GERMANY: VITAL SIGNS MONITORING DEVICES MARKET, BY TYPE, 2021–2028 (USD MILLION)
                                TABLE 148 GERMANY: MHEALTH SERVICES MARKET, BY TYPE, 2021–2028 (USD MILLION)
                                TABLE 149 GERMANY: MHEALTH SOLUTIONS MARKET, BY END USER, 2021–2028 (USD MILLION)
           9.3.3 UK
                    9.3.3.1 High penetration of mobile apps and wearable devices to support growth
                                TABLE 150 UK: MHEALTH SOLUTIONS MARKET, BY PRODUCT & SERVICE, 2021–2028 (USD MILLION)
                                TABLE 151 UK: MHEALTH APPS MARKET, BY TYPE, 2021–2028 (USD MILLION)
                                TABLE 152 UK: HEALTHCARE APPS MARKET, BY TYPE, 2021–2028 (USD MILLION)
                                TABLE 153 UK: CHRONIC CARE MANAGEMENT APPS MARKET, BY TYPE, 2021–2028 (USD MILLION)
                                TABLE 154 UK: GENERAL HEALTH & FITNESS APPS MARKET, BY TYPE, 2021–2028 (USD MILLION)
                                TABLE 155 UK: WOMEN’S HEALTH APPS MARKET, BY TYPE, 2021–2028 (USD MILLION)
                                TABLE 156 UK: MEDICAL APPS MARKET, BY TYPE, 2021–2028 (USD MILLION)
                                TABLE 157 UK: CONNECTED MEDICAL DEVICES MARKET, BY TYPE, 2021–2028 (USD MILLION)
                                TABLE 158 UK: VITAL SIGNS MONITORING DEVICES MARKET, BY TYPE, 2021–2028 (USD MILLION)
                                TABLE 159 UK: MHEALTH SERVICES MARKET, BY TYPE, 2021–2028 (USD MILLION)
                                TABLE 160 UK: MHEALTH SOLUTIONS MARKET, BY END USER, 2021–2028 (USD MILLION)
           9.3.4 FRANCE
                    9.3.4.1 Use of telehealth solutions and services through big data to boost market
                                TABLE 161 FRANCE: MHEALTH SOLUTIONS MARKET, BY PRODUCT & SERVICE, 2021–2028 (USD MILLION)
                                TABLE 162 FRANCE: MHEALTH APPS MARKET, BY TYPE, 2021–2028 (USD MILLION)
                                TABLE 163 FRANCE: HEALTHCARE APPS MARKET, BY TYPE, 2021–2028 (USD MILLION)
                                TABLE 164 FRANCE: CHRONIC CARE MANAGEMENT APPS MARKET, BY TYPE, 2021–2028 (USD MILLION)
                                TABLE 165 FRANCE: GENERAL HEALTH & FITNESS APPS MARKET, BY TYPE, 2021–2028 (USD MILLION)
                                TABLE 166 FRANCE: WOMEN’S HEALTH APPS MARKET, BY TYPE, 2021–2028 (USD MILLION)
                                TABLE 167 FRANCE: MEDICAL APPS MARKET, BY TYPE, 2021–2028 (USD MILLION)
                                TABLE 168 FRANCE: CONNECTED MEDICAL DEVICES MARKET, BY TYPE, 2021–2028 (USD MILLION)
                                TABLE 169 FRANCE: VITAL SIGNS MONITORING DEVICES MARKET, BY TYPE, 2021–2028 (USD MILLION)
                                TABLE 170 FRANCE: MHEALTH SERVICES MARKET, BY TYPE, 2021–2028 (USD MILLION)
                                TABLE 171 FRANCE: MHEALTH SOLUTIONS MARKET, BY END USER, 2021–2028 (USD MILLION)
           9.3.5 ITALY
                    9.3.5.1 Increasing government initiatives to implement eHealth to propel market
                                TABLE 172 ITALY: MHEALTH SOLUTIONS MARKET, BY PRODUCT & SERVICE, 2021–2028 (USD MILLION)
                                TABLE 173 ITALY: MHEALTH APPS MARKET, BY TYPE, 2021–2028 (USD MILLION)
                                TABLE 174 ITALY: HEALTHCARE APPS MARKET, BY TYPE, 2021–2028 (USD MILLION)
                                TABLE 175 ITALY: CHRONIC CARE MANAGEMENT APPS MARKET, BY TYPE, 2021–2028 (USD MILLION)
                                TABLE 176 ITALY: GENERAL HEALTH & FITNESS APPS MARKET, BY TYPE, 2021–2028 (USD MILLION)
                                TABLE 177 ITALY: WOMEN’S HEALTH APPS MARKET, BY TYPE, 2021–2028 (USD MILLION)
                                TABLE 178 ITALY: MEDICAL APPS MARKET, BY TYPE, 2021–2028 (USD MILLION)
                                TABLE 179 ITALY: CONNECTED MEDICAL DEVICES MARKET, BY TYPE, 2021–2028 (USD MILLION)
                                TABLE 180 ITALY: VITAL SIGNS MONITORING DEVICES MARKET, BY TYPE, 2021–2028 (USD MILLION)
                                TABLE 181 ITALY: MHEALTH SERVICES MARKET, BY TYPE, 2021–2028 (USD MILLION)
                                TABLE 182 ITALY: MHEALTH SOLUTIONS MARKET, BY END USER, 2021–2028 (USD MILLION)
           9.3.6 SPAIN
                    9.3.6.1 High phone penetration rate to support mHealth adoption
                                TABLE 183 SPAIN: MHEALTH SOLUTIONS MARKET, BY PRODUCT & SERVICE, 2021–2028 (USD MILLION)
                                TABLE 184 SPAIN: MHEALTH APPS MARKET, BY TYPE, 2021–2028 (USD MILLION)
                                TABLE 185 SPAIN: HEALTHCARE APPS MARKET, BY TYPE, 2021–2028 (USD MILLION)
                                TABLE 186 SPAIN: CHRONIC CARE MANAGEMENT APPS MARKET, BY TYPE, 2021–2028 (USD MILLION)
                                TABLE 187 SPAIN: GENERAL HEALTH & FITNESS APPS MARKET, BY TYPE, 2021–2028 (USD MILLION)
                                TABLE 188 SPAIN: WOMEN’S HEALTH APPS MARKET, BY TYPE, 2021–2028 (USD MILLION)
                                TABLE 189 SPAIN: MEDICAL APPS MARKET, BY TYPE, 2021–2028 (USD MILLION)
                                TABLE 190 SPAIN: CONNECTED MEDICAL DEVICES MARKET, BY TYPE, 2021–2028 (USD MILLION)
                                TABLE 191 SPAIN: VITAL SIGNS MONITORING DEVICES MARKET, BY TYPE, 2021–2028 (USD MILLION)
                                TABLE 192 SPAIN: MHEALTH SERVICES MARKET, BY TYPE, 2021–2028 (USD MILLION)
                                TABLE 193 SPAIN: MHEALTH SOLUTIONS MARKET, BY END USER, 2021–2028 (USD MILLION)
           9.3.7 REST OF EUROPE
                    TABLE 194 REST OF EUROPE: MHEALTH SOLUTIONS MARKET, BY PRODUCT & SERVICE, 2021–2028 (USD MILLION)
                    TABLE 195 REST OF EUROPE: MHEALTH APPS MARKET, BY TYPE, 2021–2028 (USD MILLION)
                    TABLE 196 REST OF EUROPE: HEALTHCARE APPS MARKET, BY TYPE, 2021–2028 (USD MILLION)
                    TABLE 197 REST OF EUROPE: CHRONIC CARE MANAGEMENT APPS MARKET, BY TYPE, 2021–2028 (USD MILLION)
                    TABLE 198 REST OF EUROPE: GENERAL HEALTH & FITNESS APPS MARKET, BY TYPE, 2021–2028 (USD MILLION)
                    TABLE 199 REST OF EUROPE: WOMEN’S HEALTH APPS MARKET, BY TYPE, 2021–2028 (USD MILLION)
                    TABLE 200 REST OF EUROPE: MEDICAL APPS MARKET, BY TYPE, 2021–2028 (USD MILLION)
                    TABLE 201 REST OF EUROPE: CONNECTED MEDICAL DEVICES MARKET, BY TYPE, 2021–2028 (USD MILLION)
                    TABLE 202 REST OF EUROPE: VITAL SIGNS MONITORING DEVICES MARKET, BY TYPE, 2021–2028 (USD MILLION)
                    TABLE 203 REST OF EUROPE: MHEALTH SERVICES MARKET, BY TYPE, 2021–2028 (USD MILLION)
                    TABLE 204 REST OF EUROPE: MHEALTH SOLUTIONS MARKET, BY END USER, 2021–2028 (USD MILLION)
    9.4 ASIA PACIFIC 
          FIGURE 29 ASIA PACIFIC: MHEALTH SOLUTIONS SNAPSHOT
           9.4.1 ASIA PACIFIC: IMPACT OF ECONOMIC RECESSION
                    TABLE 205 ASIA PACIFIC: MHEALTH SOLUTIONS MARKET, BY COUNTRY, 2021–2028 (USD MILLION)
                    TABLE 206 ASIA PACIFIC: MHEALTH SOLUTIONS MARKET, BY PRODUCT & SERVICE, 2021–2028 (USD MILLION)
                    TABLE 207 ASIA PACIFIC: MHEALTH APPS MARKET, BY TYPE, 2021–2028 (USD MILLION)
                    TABLE 208 ASIA PACIFIC: HEALTHCARE APPS MARKET, BY TYPE, 2021–2028 (USD MILLION)
                    TABLE 209 ASIA PACIFIC: CHRONIC CARE MANAGEMENT APPS MARKET, BY TYPE, 2021–2028 (USD MILLION)
                    TABLE 210 ASIA PACIFIC: GENERAL HEALTH & FITNESS APPS MARKET, BY TYPE, 2021–2028 (USD MILLION)
                    TABLE 211 ASIA PACIFIC: WOMEN’S HEALTH APPS MARKET, BY TYPE, 2021–2028 (USD MILLION)
                    TABLE 212 ASIA PACIFIC: MEDICAL APPS MARKET, BY TYPE, 2021–2028 (USD MILLION)
                    TABLE 213 ASIA PACIFIC: CONNECTED MEDICAL DEVICES MARKET, BY TYPE, 2021–2028 (USD MILLION)
                    TABLE 214 ASIA PACIFIC: VITAL SIGNS MONITORING DEVICES MARKET, BY TYPE, 2021–2028 (USD MILLION)
                    TABLE 215 ASIA PACIFIC: MHEALTH SERVICES MARKET, BY TYPE, 2021–2028 (USD MILLION)
                    TABLE 216 ASIA PACIFIC: MHEALTH SOLUTIONS MARKET, BY END USER, 2021–2028 (USD MILLION)
           9.4.2 CHINA
                    9.4.2.1 China to dominate Asia Pacific mHealth solutions market
                                TABLE 217 CHINA: MHEALTH SOLUTIONS MARKET, BY PRODUCT & SERVICE, 2021–2028 (USD MILLION)
                                TABLE 218 CHINA: MHEALTH APPS MARKET, BY TYPE, 2021–2028 (USD MILLION)
                                TABLE 219 CHINA: HEALTHCARE APPS MARKET, BY TYPE, 2021–2028 (USD MILLION)
                                TABLE 220 CHINA: CHRONIC CARE MANAGEMENT APPS MARKET, BY TYPE, 2021–2028 (USD MILLION)
                                TABLE 221 CHINA: GENERAL HEALTH & FITNESS APPS MARKET, BY TYPE, 2021–2028 (USD MILLION)
                                TABLE 222 CHINA: WOMEN’S HEALTH APPS MARKET, BY TYPE, 2021–2028 (USD MILLION)
                                TABLE 223 CHINA: MEDICAL APPS MARKET, BY TYPE, 2021–2028 (USD MILLION)
                                TABLE 224 CHINA: CONNECTED MEDICAL DEVICES MARKET, BY TYPE, 2021–2028 (USD MILLION)
                                TABLE 225 CHINA: VITAL SIGNS MONITORING DEVICES MARKET, BY TYPE, 2021–2028 (USD MILLION)
                                TABLE 226 CHINA: MHEALTH SERVICES MARKET, BY TYPE, 2021–2028 (USD MILLION)
                                TABLE 227 CHINA: MHEALTH SOLUTIONS MARKET, BY END USER, 2021–2028 (USD MILLION)
           9.4.3 JAPAN
                    9.4.3.1 Rising geriatric population and health expenditure to support market growth
                                TABLE 228 JAPAN: MHEALTH SOLUTIONS MARKET, BY PRODUCT & SERVICE, 2021–2028 (USD MILLION)
                                TABLE 229 JAPAN: MHEALTH APPS MARKET, BY TYPE, 2021–2028 (USD MILLION)
                                TABLE 230 JAPAN: HEALTHCARE APPS MARKET, BY TYPE, 2021–2028 (USD MILLION)
                                TABLE 231 JAPAN: CHRONIC CARE MANAGEMENT APPS MARKET, BY TYPE, 2021–2028 (USD MILLION)
                                TABLE 232 JAPAN: GENERAL HEALTH & FITNESS APPS MARKET, BY TYPE, 2021–2028 (USD MILLION)
                                TABLE 233 JAPAN: WOMEN’S HEALTH APPS MARKET, BY TYPE, 2021–2028 (USD MILLION)
                                TABLE 234 JAPAN: MEDICAL APPS MARKET, BY TYPE, 2021–2028 (USD MILLION)
                                TABLE 235 JAPAN: CONNECTED MEDICAL DEVICES MARKET, BY TYPE, 2021–2028 (USD MILLION)
                                TABLE 236 JAPAN: VITAL SIGNS MONITORING DEVICES MARKET, BY TYPE, 2021–2028 (USD MILLION)
                                TABLE 237 JAPAN: MHEALTH SERVICES MARKET, BY TYPE, 2021–2028 (USD MILLION)
                                TABLE 238 JAPAN: MHEALTH SOLUTIONS MARKET, BY END USER, 2021–2028 (USD MILLION)
           9.4.4 INDIA
                    9.4.4.1 Rising need to reduce healthcare costs to boost mHealth adoption
                                TABLE 239 INDIA: MHEALTH SOLUTIONS MARKET, BY PRODUCT & SERVICE, 2021–2028 (USD MILLION)
                                TABLE 240 INDIA: MHEALTH APPS MARKET, BY TYPE, 2021–2028 (USD MILLION)
                                TABLE 241 INDIA: HEALTHCARE APPS MARKET, BY TYPE, 2021–2028 (USD MILLION)
                                TABLE 242 INDIA: CHRONIC CARE MANAGEMENT APPS MARKET, BY TYPE, 2021–2028 (USD MILLION)
                                TABLE 243 INDIA: GENERAL HEALTH & FITNESS APPS MARKET, BY TYPE, 2021–2028 (USD MILLION)
                                TABLE 244 INDIA: WOMEN’S HEALTH APPS MARKET, BY TYPE, 2021–2028 (USD MILLION)
                                TABLE 245 INDIA: MEDICAL APPS MARKET, BY TYPE, 2021–2028 (USD MILLION)
                                TABLE 246 INDIA: CONNECTED MEDICAL DEVICES MARKET, BY TYPE, 2021–2028 (USD MILLION)
                                TABLE 247 INDIA: VITAL SIGNS MONITORING DEVICES MARKET, BY TYPE, 2021–2028 (USD MILLION)
                                TABLE 248 INDIA: MHEALTH SERVICES MARKET, BY TYPE, 2021–2028 (USD MILLION)
                                TABLE 249 INDIA: MHEALTH SOLUTIONS MARKET, BY END USER, 2021–2028 (USD MILLION)
           9.4.5 REST OF ASIA PACIFIC
                    TABLE 250 REST OF ASIA PACIFIC: MHEALTH SOLUTIONS MARKET, BY PRODUCT & SERVICE, 2021–2028 (USD MILLION)
                    TABLE 251 REST OF ASIA PACIFIC: MHEALTH APPS MARKET, BY TYPE, 2021–2028 (USD MILLION)
                    TABLE 252 REST OF ASIA PACIFIC: HEALTHCARE APPS MARKET, BY TYPE, 2021–2028 (USD MILLION)
                    TABLE 253 REST OF ASIA PACIFIC: CHRONIC CARE MANAGEMENT APPS MARKET, BY TYPE, 2021–2028 (USD MILLION)
                    TABLE 254 REST OF ASIA PACIFIC: GENERAL HEALTH & FITNESS APPS MARKET, BY TYPE, 2021–2028 (USD MILLION)
                    TABLE 255 REST OF ASIA PACIFIC: WOMEN’S HEALTH APPS MARKET, BY TYPE, 2021–2028 (USD MILLION)
                    TABLE 256 REST OF ASIA PACIFIC: MEDICAL APPS MARKET, BY TYPE, 2021–2028 (USD MILLION)
                    TABLE 257 REST OF ASIA PACIFIC: CONNECTED MEDICAL DEVICES MARKET, BY TYPE, 2021–2028 (USD MILLION)
                    TABLE 258 REST OF ASIA PACIFIC: VITAL SIGNS MONITORING DEVICES MARKET, BY TYPE, 2021–2028 (USD MILLION)
                    TABLE 259 REST OF ASIA PACIFIC: MHEALTH SERVICES MARKET, BY TYPE, 2021–2028 (USD MILLION)
                    TABLE 260 REST OF ASIA PACIFIC: MHEALTH SOLUTIONS MARKET, BY END USER, 2021–2028 (USD MILLION)
    9.5 LATIN AMERICA 
           9.5.1 LATIN AMERICA: IMPACT OF ECONOMIC RECESSION
                    TABLE 261 LATIN AMERICA: MHEALTH SOLUTIONS MARKET, BY COUNTRY, 2021–2028 (USD MILLION)
                    TABLE 262 LATIN AMERICA: MHEALTH SOLUTIONS MARKET, BY PRODUCT & SERVICE, 2021–2028 (USD MILLION)
                    TABLE 263 LATIN AMERICA: MHEALTH APPS MARKET, BY TYPE, 2021–2028 (USD MILLION)
                    TABLE 264 LATIN AMERICA: HEALTHCARE APPS MARKET, BY TYPE, 2021–2028 (USD MILLION)
                    TABLE 265 LATIN AMERICA: CHRONIC CARE MANAGEMENT APPS MARKET, BY TYPE, 2021–2028 (USD MILLION)
                    TABLE 266 LATIN AMERICA: GENERAL HEALTH & FITNESS APPS MARKET, BY TYPE, 2021–2028 (USD MILLION)
                    TABLE 267 LATIN AMERICA: WOMEN’S HEALTH APPS MARKET, BY TYPE, 2021–2028 (USD MILLION)
                    TABLE 268 LATIN AMERICA: MEDICAL APPS MARKET, BY TYPE, 2021–2028 (USD MILLION)
                    TABLE 269 LATIN AMERICA: CONNECTED MEDICAL DEVICES MARKET, BY TYPE, 2021–2028 (USD MILLION)
                    TABLE 270 LATIN AMERICA: VITAL SIGNS MONITORING DEVICES MARKET, BY TYPE, 2021–2028 (USD MILLION)
                    TABLE 271 LATIN AMERICA: MHEALTH SERVICES MARKET, BY TYPE, 2021–2028 (USD MILLION)
                    TABLE 272 LATIN AMERICA: MHEALTH SOLUTIONS MARKET, BY END USER, 2021–2028 (USD MILLION)
           9.5.2 BRAZIL
                    9.5.2.1 Brazil to dominate mHealth solutions market in Latin America
                                TABLE 273 BRAZIL: MHEALTH SOLUTIONS MARKET, BY PRODUCT & SERVICE, 2021–2028 (USD MILLION)
                                TABLE 274 BRAZIL: MHEALTH APPS MARKET, BY TYPE, 2021–2028 (USD MILLION)
                                TABLE 275 BRAZIL: HEALTHCARE APPS MARKET, BY TYPE, 2021–2028 (USD MILLION)
                                TABLE 276 BRAZIL: CHRONIC CARE MANAGEMENT APPS MARKET, BY TYPE, 2021–2028 (USD MILLION)
                                TABLE 277 BRAZIL: GENERAL HEALTH & FITNESS APPS MARKET, BY TYPE, 2021–2028 (USD MILLION)
                                TABLE 278 BRAZIL: WOMEN’S HEALTH APPS MARKET, BY TYPE, 2021–2028 (USD MILLION)
                                TABLE 279 BRAZIL: MEDICAL APPS MARKET, BY TYPE, 2021–2028 (USD MILLION)
                                TABLE 280 BRAZIL: CONNECTED MEDICAL DEVICES MARKET, BY TYPE, 2021–2028 (USD MILLION)
                                TABLE 281 BRAZIL: VITAL SIGNS MONITORING DEVICES MARKET, BY TYPE, 2021–2028 (USD MILLION)
                                TABLE 282 BRAZIL: MHEALTH SERVICES MARKET, BY TYPE, 2021–2028 (USD MILLION)
                                TABLE 283 BRAZIL: MHEALTH SOLUTIONS MARKET, BY END USER, 2021–2028 (USD MILLION)
           9.5.3 MEXICO
                    9.5.3.1 Rising need to curtail healthcare expenditure to drive mHealth adoption
                                TABLE 284 MEXICO: MHEALTH SOLUTIONS MARKET, BY PRODUCT & SERVICE, 2021–2028 (USD MILLION)
                                TABLE 285 MEXICO: MHEALTH APPS MARKET, BY TYPE, 2021–2028 (USD MILLION)
                                TABLE 286 MEXICO: HEALTHCARE APPS MARKET, BY TYPE, 2021–2028 (USD MILLION)
                                TABLE 287 MEXICO: CHRONIC CARE MANAGEMENT APPS MARKET, BY TYPE, 2021–2028 (USD MILLION)
                                TABLE 288 MEXICO: GENERAL HEALTH & FITNESS APPS MARKET, BY TYPE, 2021–2028 (USD MILLION)
                                TABLE 289 MEXICO: WOMEN’S HEALTH APPS MARKET, BY TYPE, 2021–2028 (USD MILLION)
                                TABLE 290 MEXICO: MEDICAL APPS MARKET, BY TYPE, 2021–2028 (USD MILLION)
                                TABLE 291 MEXICO: CONNECTED MEDICAL DEVICES MARKET, BY TYPE, 2021–2028 (USD MILLION)
                                TABLE 292 MEXICO: VITAL SIGNS MONITORING DEVICES MARKET, BY TYPE, 2021–2028 (USD MILLION)
                                TABLE 293 MEXICO: MHEALTH SERVICES MARKET, BY TYPE, 2021–2028 (USD MILLION)
                                TABLE 294 MEXICO: MHEALTH SOLUTIONS MARKET, BY END USER, 2021–2028 (USD MILLION)
           9.5.4 REST OF LATIN AMERICA
                    TABLE 295 REST OF LATIN AMERICA: MHEALTH SOLUTIONS MARKET, BY PRODUCT & SERVICE, 2021–2028 (USD MILLION)
                    TABLE 296 REST OF LATIN AMERICA: MHEALTH APPS MARKET, BY TYPE, 2021–2028 (USD MILLION)
                    TABLE 297 REST OF LATIN AMERICA: HEALTHCARE APPS MARKET, BY TYPE, 2021–2028 (USD MILLION)
                    TABLE 298 REST OF LATIN AMERICA: CHRONIC CARE MANAGEMENT APPS MARKET, BY TYPE, 2021–2028 (USD MILLION)
                    TABLE 299 REST OF LATIN AMERICA: GENERAL HEALTH & FITNESS APPS MARKET, BY TYPE, 2021–2028 (USD MILLION)
                    TABLE 300 REST OF LATIN AMERICA: WOMEN’S HEALTH APPS MARKET, BY TYPE, 2021–2028 (USD MILLION)
                    TABLE 301 REST OF LATIN AMERICA: MEDICAL APPS MARKET, BY TYPE, 2021–2028 (USD MILLION)
                    TABLE 302 REST OF LATIN AMERICA: CONNECTED MEDICAL DEVICES MARKET, BY TYPE, 2021–2028 (USD MILLION)
                    TABLE 303 REST OF LATIN AMERICA: VITAL SIGNS MONITORING DEVICES MARKET, BY TYPE, 2021–2028 (USD MILLION)
                    TABLE 304 REST OF LATIN AMERICA: MHEALTH SERVICES MARKET, BY TYPE, 2021–2028 (USD MILLION)
                    TABLE 305 REST OF LATIN AMERICA: MHEALTH SOLUTIONS MARKET, BY END USER, 2021–2028 (USD MILLION)
    9.6 MIDDLE EAST & AFRICA 
           9.6.1 RISING INTEREST IN BUILDING REGIONAL HEALTHCARE MOBILITY FRAMEWORKS TO FAVOR MHEALTH SEGMENT
           9.6.2 MIDDLE EAST & AFRICA: IMPACT OF ECONOMIC RECESSION
                    TABLE 306 MIDDLE EAST & AFRICA: MHEALTH SOLUTIONS MARKET, BY PRODUCT & SERVICE, 2021–2028 (USD MILLION)
                    TABLE 307 MIDDLE EAST & AFRICA: MHEALTH APPS MARKET, BY TYPE, 2021–2028 (USD MILLION)
                    TABLE 308 MIDDLE EAST & AFRICA: HEALTHCARE APPS MARKET, BY TYPE, 2021–2028 (USD MILLION)
                    TABLE 309 MIDDLE EAST & AFRICA: CHRONIC CARE MANAGEMENT APPS MARKET, BY TYPE, 2021–2028 (USD MILLION)
                    TABLE 310 MIDDLE EAST & AFRICA: GENERAL HEALTH & FITNESS APPS MARKET, BY TYPE, 2021–2028 (USD MILLION)
                    TABLE 311 MIDDLE EAST & AFRICA: WOMEN’S HEALTH APPS MARKET, BY TYPE, 2021–2028 (USD MILLION)
                    TABLE 312 MIDDLE EAST & AFRICA: MEDICAL APPS MARKET, BY TYPE, 2021–2028 (USD MILLION)
                    TABLE 313 MIDDLE EAST & AFRICA: CONNECTED MEDICAL DEVICES MARKET, BY TYPE, 2021–2028 (USD MILLION)
                    TABLE 314 MIDDLE EAST & AFRICA: VITAL SIGNS MONITORING DEVICES MARKET, BY TYPE, 2021–2028 (USD MILLION)
                    TABLE 315 MIDDLE EAST & AFRICA: MHEALTH SERVICES MARKET, BY TYPE, 2021–2028 (USD MILLION)
                    TABLE 316 MIDDLE EAST & AFRICA: MHEALTH SOLUTIONS MARKET, BY END USER, 2021–2028 (USD MILLION)
 
10 COMPETITIVE LANDSCAPE (Page No. - 281)
     10.1 OVERVIEW 
             FIGURE 30 KEY DEVELOPMENTS OF MARKET PLAYERS BETWEEN JANUARY 2020 AND MARCH 2023
     10.2 MARKET RANKING ANALYSIS 
             FIGURE 31 MHEALTH APPLICATIONS AND DEVICES MARKET RANKING ANALYSIS, BY PLAYER, 2022
     10.3 REVENUE SHARE ANALYSIS OF TOP MARKET PLAYERS 
             FIGURE 32 MHEALTH SOLUTIONS MARKET: REVENUE ANALYSIS OF KEY PLAYERS
     10.4 MHEALTH SOLUTIONS MARKET: R&D EXPENDITURE 
             FIGURE 33 R&D EXPENDITURE OF KEY PLAYERS (2020 VS. 2021)
     10.5 COMPANY EVALUATION QUADRANT (2022) 
             10.5.1 STARS
             10.5.2 EMERGING LEADERS
             10.5.3 PERVASIVE PLAYERS
             10.5.4 PARTICIPANTS
                        FIGURE 34 MHEALTH SOLUTIONS MARKET: COMPANY EVALUATION QUADRANT (2022)
     10.6 COMPANY EVALUATION QUADRANT FOR START-UPS/SMES (2022) 
             10.6.1 PROGRESSIVE COMPANIES
             10.6.2 DYNAMIC COMPANIES
             10.6.3 RESPONSIVE COMPANIES
             10.6.4 STARTING BLOCKS
                        FIGURE 35 MHEALTH SOLUTIONS MARKET: COMPANY EVALUATION QUADRANT FOR START-UPS/SMES (2022)
     10.7 COMPETITIVE SCENARIO 
             10.7.1 PRODUCT & SERVICE LAUNCHES & APPROVALS
                        TABLE 317 PRODUCT & SERVICE LAUNCHES & APPROVALS, JANUARY 2020–MARCH 2023
             10.7.2 DEALS
                        TABLE 318 DEALS, JANUARY 2020–MARCH 2023
 
11 COMPANY PROFILES (Page No. - 290)
(Business overview, Products & services offered, Recent Developments, MNM view)*
     11.1 KEY PLAYERS 
             11.1.1 KONINKLIJKE PHILIPS N.V.
                        TABLE 319 KONINKLIJKE PHILIPS N.V.: BUSINESS OVERVIEW
                        FIGURE 36 KONINKLIJKE PHILIPS N.V.: COMPANY SNAPSHOT (2022)
             11.1.2 MEDTRONIC PLC
                        TABLE 320 MEDTRONIC PLC: BUSINESS OVERVIEW
                        FIGURE 37 MEDTRONIC PLC: COMPANY SNAPSHOT (2021)
             11.1.3 OMRON HEALTHCARE CO., LTD.
                        TABLE 321 OMRON HEALTHCARE CO., LTD.: BUSINESS OVERVIEW
                        FIGURE 38 OMRON CORPORATION.: COMPANY SNAPSHOT (2021)
             11.1.4 JOHNSON & JOHNSON
                        TABLE 322 JOHNSON & JOHNSON: BUSINESS OVERVIEW
                        FIGURE 39 JOHNSON & JOHNSON: COMPANY SNAPSHOT (2021)
             11.1.5 CERNER CORPORATION
                        TABLE 323 CERNER CORPORATION: BUSINESS OVERVIEW
                        FIGURE 40 CERNER CORPORATION: COMPANY SNAPSHOT (2021)
             11.1.6 APPLE, INC.
                        TABLE 324 APPLE, INC.: BUSINESS OVERVIEW
                        FIGURE 41 APPLE, INC.: COMPANY SNAPSHOT (2022)
             11.1.7 ALIVECOR, INC.
                        TABLE 325 ALIVECOR, INC.: BUSINESS OVERVIEW
             11.1.8 AIRSTRIP TECHNOLOGIES
                        TABLE 326 AIRSTRIP TECHNOLOGIES: BUSINESS OVERVIEW
             11.1.9 ATHENAHEALTH, INC.
                        TABLE 327 ATHENAHEALTH, INC.: BUSINESS OVERVIEW
             11.1.10 IHEALTH LABS, INC.
                        TABLE 328 IHEALTH LABS, INC.: BUSINESS OVERVIEW
             11.1.11 AT&T, INC.
                        TABLE 329 AT&T, INC.: BUSINESS OVERVIEW
                        FIGURE 42 AT&T, INC.: COMPANY SNAPSHOT (2021)
             11.1.12 AGAMATRIX, INC.
                        TABLE 330 AGAMATRIX, INC.: BUSINESS OVERVIEW
             11.1.13 CISCO SYSTEMS, INC.
                        TABLE 331 CISCO SYSTEMS, INC.: BUSINESS OVERVIEW
                        FIGURE 43 CISCO SYSTEMS, INC.: COMPANY SNAPSHOT (2022)
             11.1.14 FITBIT, INC.
                        TABLE 332 FITBIT, INC.: BUSINESS OVERVIEW
             11.1.15 VODAFONE GROUP PLC
                        TABLE 333 VODAFONE GROUP PLC: BUSINESS OVERVIEW
                        FIGURE 44 VODAFONE GROUP PLC: COMPANY SNAPSHOT (2022)
             11.1.16 QUALCOMM TECHNOLOGIES, INC.
                        TABLE 334 QUALCOMM TECHNOLOGIES, INC.: BUSINESS OVERVIEW
                        FIGURE 45 QUALCOMM TECHNOLOGIES, INC.: COMPANY SNAPSHOT (2022)
             11.1.17 GARMIN LTD.
                        TABLE 335 GARMIN LTD.: BUSINESS OVERVIEW
                        FIGURE 46 GARMIN LTD.: COMPANY SNAPSHOT (2022)
             11.1.18 TUNSTALL HEALTHCARE
                        TABLE 336 TUNSTALL HEALTHCARE: BUSINESS OVERVIEW
     11.2 ADDITIONAL COMPANIES 
             11.2.1 SOFTSERVE
             11.2.2 OSP LABS
             11.2.3 OMADA HEALTH
             11.2.4 DEXCOM, INC.
             11.2.5 TELADOC HEALTH, INC.
             11.2.6 ZTE CORPORATION
             11.2.7 MY MHEALTH LIMITED
 
*Details on Business overview, Products & services offered, Recent Developments, MNM view might not be captured in case of unlisted companies.
 
12 APPENDIX (Page No. - 351)
     12.1 DISCUSSION GUIDE 
     12.2 KNOWLEDGESTORE: MARKETSANDMARKETS’ SUBSCRIPTION PORTAL 
     12.3 CUSTOMIZATION OPTIONS 
     12.4 RELATED REPORTS 
     12.5 AUTHOR DETAILS 

This research study involved the extensive use of both primary and secondary sources. Various factors affecting the industry were studied to identify segmentation types; industry trends; key players; the competitive landscape of the market; and key market dynamics, such as drivers, restraints, opportunities, challenges, and key player strategies.

Secondary Research

This research study involved widespread secondary sources; directories; databases, such as D&B, Bloomberg Business, and Factiva; white papers; annual reports; and companies’ house documents. Secondary research was used to identify and collect information for this extensive, technical, market-oriented, and commercial study of the mHealth solutions market. It was also used to obtain important information about the top players, market classification, and segmentation according to industry trends to the bottom-most level, geographic markets, technology perspectives, and key developments related to the market. A database of the key industry leaders was also prepared using secondary research.

Primary Research

In the primary research process, various supply and demand sources were interviewed to obtain qualitative and quantitative information for this report. Primary sources from the supply side include industry experts such as CEOs, vice presidents, marketing and sales directors, technology & innovation directors, engineers, and related key executives from various companies and organizations operating in the mHealth solutions market. Primary sources from the demand side included personnel from hospitals (small, medium-sized, and large hospitals), ambulatory centers, diagnostic centers, TPAs, and stakeholders in corporate & government bodies.

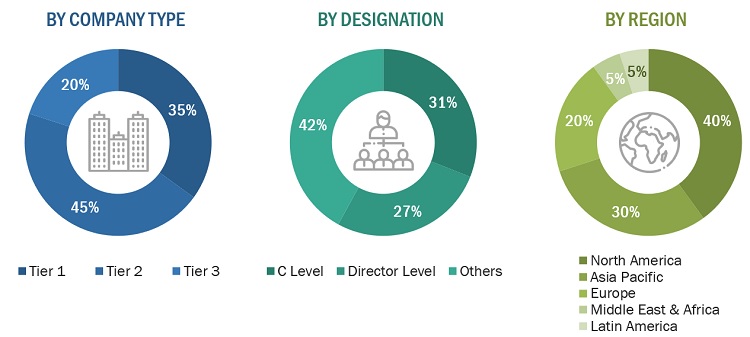
A breakdown of the primary respondents is provided below:
mHealth Solutions Market Size, and Share

*Others include sales managers, marketing managers, and product managers.

Note: Tiers are defined based on a company’s total revenue, as of 2020: Tier 1 = >USD 1 billion, Tier 2 = USD 500 million to USD 1 billion, and Tier 3 = <USD 500 million.

To know about the assumptions considered for the study, download the pdf brochure

Market Size Estimation

The total size of the mHealth Solutions market was arrived at after data triangulation from different approaches. After each approach, the weighted average of approaches was taken based on the level of assumptions used.
mHealth Solutions Market Size, and Share

To know about the assumptions considered for the study, Request for Free Sample Report

Data Triangulation

The individual shares of each mHealth product & service, and end-user segment were determined by assigning weights based on their utilization/adoption rate. Regional splits of the overall mHealth market and its subsegments are based on the adoption or utilization rates of the given products and services in the respective regions or countries

Global MHealth Solutions Market Size: Top-Down Approach

mHealth Solutions Market Size, and Share

Market Definition

Mobile health (mHealth) refers to the use of mobile devices for collecting and distributing health-related data, remote delivery of care, and near real-time monitoring of patients. Connected medical devices and mHealth apps and solutions help clinicians document more accurate and complete records, improve productivity, access information, and communicate findings & treatments.

Key Stakeholders

  • Healthcare application developers
  • Medical device vendors
  • Mobile network providers
  • Connectivity providers
  • Mobile platform developers
  • Insurance providers (payers)
  • Healthcare institutions (hospitals, medical schools, and outpatient clinics)
  • Research and consulting firms
  • Research institutes
  • Contract research organizations (CROs)
  • Contract manufacturing organizations (CMOs)
  • Venture capitalists

Objectives of the Study

  • To define, describe, segment, and forecast the mHealth solutions market by product & service, end user, and region
  • To provide detailed information about the factors influencing the market growth (such as drivers, restraints, opportunities, and challenges)
  • To analyze micromarkets1 with respect to individual growth trends, prospects, and contributions to the overall mHealth solutions market
  • To analyze market opportunities for stakeholders and provide details of the competitive landscape for key players
  • To forecast the size of the mHealth solutions market in five main regions (along with their respective key countries): North America, Europe, Asia Pacific, Latin America, and the Middle East & Africa
  • To profile the key players in the mHealth solutions market and comprehensively analyze their core competencies2 and market shares.
  • To track and analyze competitive developments such as acquisitions, product launches, expansions, collaborations, agreements, partnerships, investments, joint ventures, sales contracts, and R&D activities of the leading players in the mHealth solutions market
  • To benchmark players within the mHealth solutions market using the Competitive Leadership Mapping framework, which analyzes market players on various parameters within the broad categories of business strategy, market share, and product offering

Available Customizations

With the given market data, MarketsandMarkets offers customizations as per your company’s specific needs. The following customization options are available for the report:

Company Information

  • Detailed analysis and profiling of additional market players (up to 5)

Geographic Analysis

  • Further breakdown of the RoAPAC mHealth solutions market into South Korea, Australia, New Zealand, and others
  • Further breakdown of the RoE mHealth solutions market into Belgium, Russia, the Netherlands, Switzerland, and others
  • Further breakdown of the RoLA mHealth solutions market into Argentina, Colombia, Chile, and others
Custom Market Research Services

We will customize the research for you, in case the report listed above does not meet with your exact requirements. Our custom research will comprehensively cover the business information you require to help you arrive at strategic and profitable business decisions.

Request Customization

Instant Answers with GPT - Ask Now!

Ask real questions. Get complete answers !
Report Code
HIT 2104
Published ON
Mar, 2023
Choose License Type
BUY NOW
  • SHARE
X
Request Customization
Speak to Analyst
Speak to Analyst
OR FACE-TO-FACE MEETING
PERSONALIZE THIS RESEARCH
  • Triangulate with your Own Data
  • Get Data as per your Format and Definition
  • Gain a Deeper Dive on a Specific Application, Geography, Customer or Competitor
  • Any level of Personalization
REQUEST A FREE CUSTOMIZATION
LET US HELP YOU!
  • What are the Known and Unknown Adjacencies Impacting the mHealth Solutions Market
  • What will your New Revenue Sources be?
  • Who will be your Top Customer; what will make them switch?
  • Defend your Market Share or Win Competitors
  • Get a Scorecard for Target Partners
CUSTOMIZED WORKSHOP REQUEST
  • Call Us
  • +1-888-600-6441 (Corporate office hours)
  • +1-888-600-6441 (US/Can toll free)
  • +44-800-368-9399 (UK office hours)
CONNECT WITH US
ABOUT TRUST ONLINE
©2024 MarketsandMarkets Research Private Ltd. All rights reserved
DMCA.com Protection Status
Website Feedback