The research report includes four major activities, estimating the size of the microgrid controller market. Secondary research has been done to gather important information about the market and peer markets. To validate the findings, assumptions, and sizing with the primary research with industry experts across the supply chain is the next step. Both bottom-up and top-down approaches have been used to estimate the market size. After this, the market breakdown and data triangulation have been adopted to estimate the market sizes of segments and sub-segments
Secondary Research
During the secondary research phase, a variety of secondary sources were consulted to gather pertinent information for this study. These sources encompassed corporate filings (including annual reports, press releases, investor presentations, and financial statements), as well as data from trade, business, and professional associations. Additionally, white papers, location-based marketing journals, accredited publications, articles authored by recognized experts, directories, and databases were utilized.
The secondary research aimed to acquire crucial insights into the industry's supply chain, market monetary flow, and the comprehensive landscape of key players. It also facilitated the segmentation of the market according to prevailing industry trends, reaching down to granular levels, along with analysis of geographic markets and significant developments from both market and technology perspectives. The secondary data was meticulously collected and analyzed to ascertain the overall market size, which was subsequently corroborated through primary research.
Primary Research
During the process of primary research, a range of primary sources from both the supply and demand sides were engaged to gather qualitative and quantitative insights for this report. On the supply side, primary sources included industry experts such as chief executive officers (CEOs), vice presidents, marketing directors, technology and innovation directors, subject-matter experts (SMEs), consultants, and other key executives from prominent companies and organizations operating within the Microgrid controller market.
Following a comprehensive market engineering process, which involved calculations for market statistics, breakdowns, size estimations, forecasting, and data triangulation, extensive primary research was conducted to collect, verify, and validate critical numerical data. This primary research aimed to identify segmentation types, industry trends, key players, competitive landscapes, and key market dynamics such as drivers, restraints, opportunities, and challenges, as well as to understand the key strategies adopted by market players.
Building upon insights acquired from secondary research on the Microgrid controller market, extensive primary research was conducted. Multiple primary interviews were conducted with experts from both the demand and supply sides across four key regions: North America, Europe, Asia Pacific, and ROW (Middle East, South America, and Africa). Approximately 25% of the primary interviews were conducted with representatives from the demand side, while 75% were with those from the supply side. Primary data collection was carried out through questionnaires, emails, and telephonic interviews.

To know about the assumptions considered for the study, download the pdf brochure
Market Size Estimation
In the market engineering process, both the top-down and bottom-up approaches have been used, along with several data triangulation methods, to perform market estimation and forecasting for the overall market segments and subsegments listed in this report. Extensive qualitative and quantitative analyses have been performed on the market engineering process to list key information/insights.
Key market players have been identified through secondary research, and their market shares have been determined through primary and secondary research. This involves studying their annual and financial reports and interviews with industry experts (such as CEOs, VPs, directors, and marketing executives) for key insights—both quantitative and qualitative.
All percentage shares, splits, and breakdowns have been determined using secondary sources and verified through primary sources. All possible parameters that may affect the markets covered in this research study have been accounted for, viewed in extensive detail, verified through primary research, and analyzed to obtain the final quantitative and qualitative data. This data has been consolidated and supplemented with detailed input and analysis from MarketsandMarkets and presented in the report.
Market Size Estimation Methodology-Bottom-up Approach
A bottom-up approach was employed to arrive at the overall size of the microgrid controller market from the calculations based on the revenue of key players and their share in the market. Key players in the market were studied. The market size estimations were carried out considering the market size of their microgrid controller offerings.

Market Size Estimation Methodology-Top Down Approach
In the top-down methodology, the aggregate market size served as the basis for determining the sizes of individual markets, as outlined in the market segmentation, utilizing percentage allocations derived from primary and secondary research.
To compute the sizes of specific market segments, the most pertinent immediate parent market size was employed in applying the top-down approach. Furthermore, the bottom-up approach was applied to validate the market sizes of various segments using data acquired from secondary research sources.
Estimates of each company's market share were utilized to corroborate the revenue distributions previously utilized in the bottom-up approach. Through a data triangulation process and validation via primary research sources, this study conclusively determined and affirmed both, the overall parent market size and the size of each individual market segment.

Data Triangulation
After arriving at the overall market size from the market size estimation process explained above, the total market was split into several segments and subsegments. Data triangulation was employed to complete the market engineering process and arrive at the exact statistics for all segments and subsegments. The data has been triangulated by studying various factors and trends from both the demand and supply sides. Along with this, the market has been validated using both, the top-down and bottom-up approaches.
Market Definition
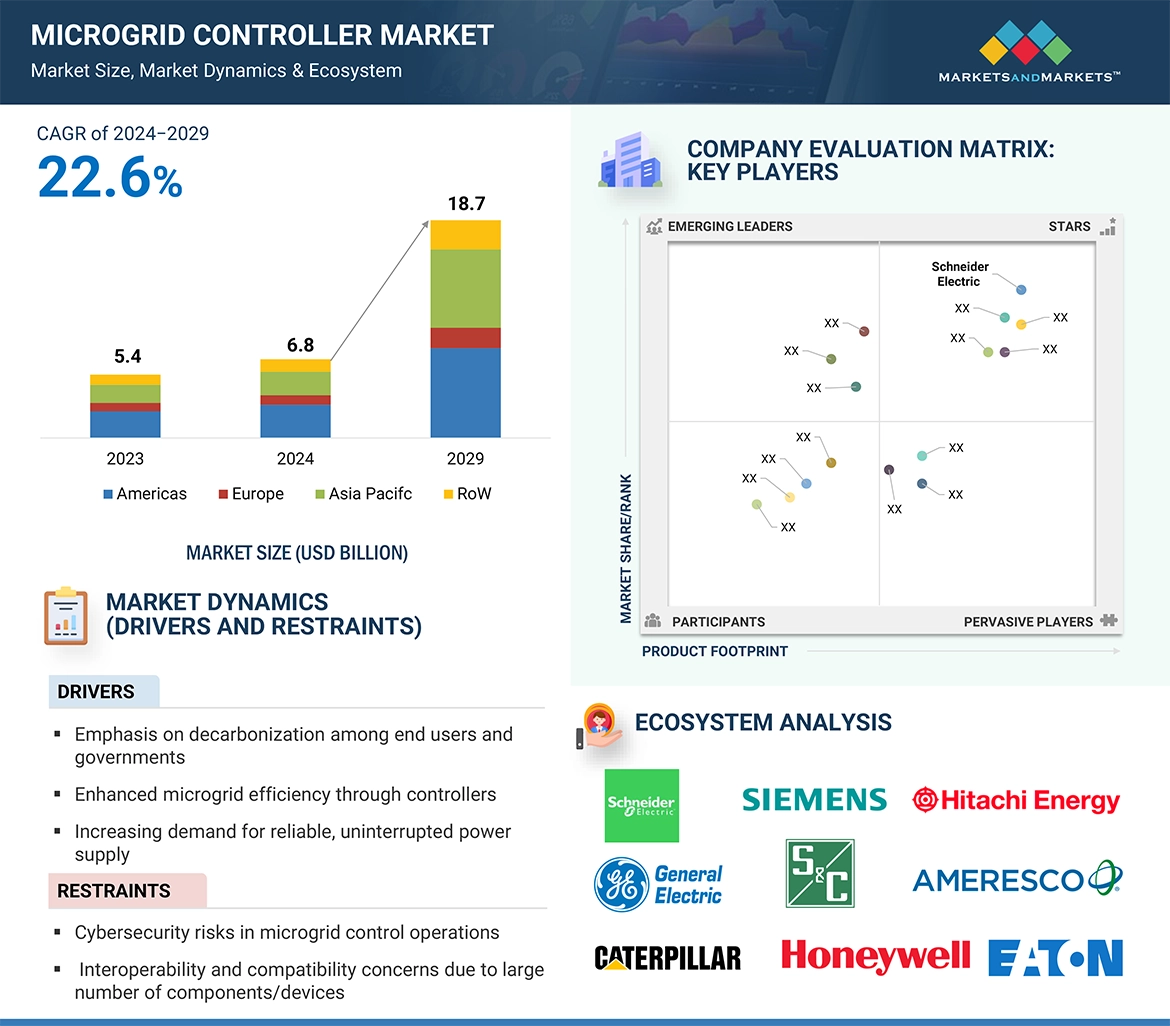
A microgrid controller serves as a sophisticated system designed to seamlessly incorporate various distributed energy resources (DERs), energy storage solutions, and renewable energy sources into the operation of a local microgrid. The primary objective is to enhance the efficiency of the microgrid while minimizing overall operational costs, including energy production expenses.
This controller facilitates the management and coordination of DERs and loads within a specific electrical system, ensuring that the frequency and voltage levels remain within acceptable parameters. By optimizing the utilization of fossil fuel-based DERs alongside renewable energy sources, microgrid controllers play a crucial role in enhancing the reliability and sustainability of energy supply within localized grids.
In essence, microgrid controllers act as the brains behind the operation of microgrids, orchestrating the seamless integration of diverse energy resources to meet demand while maintaining grid stability and cost-effectiveness.
Key Stakeholders
-
Manufacturers of microgrid controllers
-
Original equipment manufacturers
-
Research organizations
-
Microgrid system integrators and developers
-
Transmission system operators
-
Energy storage vendors
-
Value-added resellers
-
Microgrid solution vendors
-
Smart grid software vendors
-
Solar PV (photovoltaic) companies
-
Government agencies
-
Utilities
-
Investors
-
Commercial and industrial buildings
-
Technology standards organizations, forums, alliances, and associations
-
Venture capitalists and private equity firms
The main objectives of this study are as follows:
-
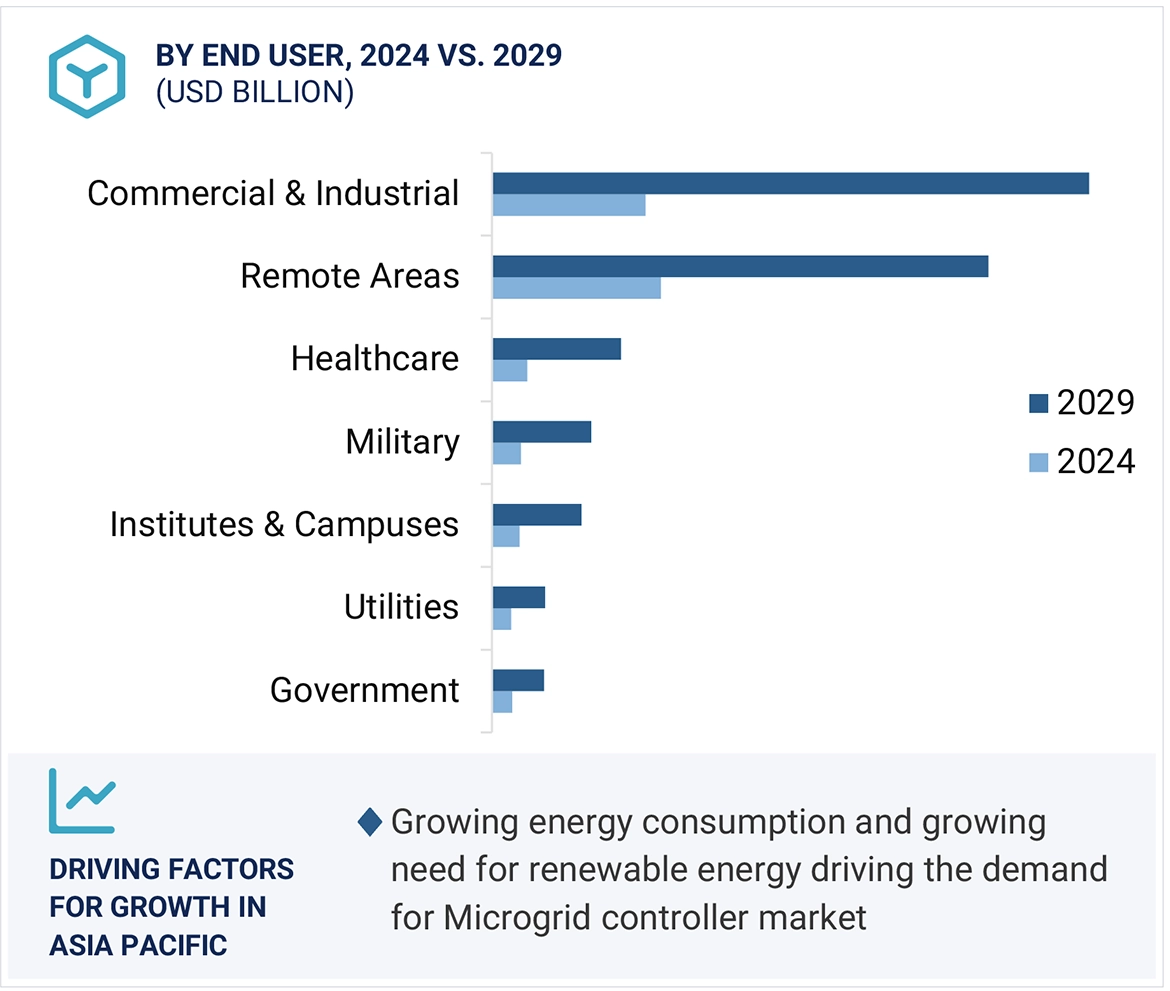
To define, describe, segment, and forecast the size of the microgrid controller market, by connectivity, offering, and end user, in terms of value
-
To forecast the market size for various segments with respect to four main regions—the Americas, Europe, Asia Pacific, and the Rest of the World (RoW)—in terms of value and volume
-
To provide detailed information regarding the drivers, restraints, opportunities, and challenges influencing the growth of the microgrid controller market
-
To study the allied industry supply chain segments and perform a supply chain analysis of the market landscape
-
To strategically analyze macro and micromarkets1 with respect to growth trends, prospects, and their contributions to the overall market
-
To strategically profile key players in the market and comprehensively analyze their market share/ranking and core competencies2
-
To analyze industry trends and patents and innovations in the market
-
To analyze competitive developments by players in the microgrid controller market, such as contracts, product launches/developments, expansions, and research & development (R&D) activities
Available Customizations:
With the given market data, MarketsandMarkets offers customizations according to the specific requirements of companies. The following customization options are available for the report:
-
Country-wise Information for Asia Pacific
-
Detailed analysis and profiling of additional market players (up to five)


Thomas�
Apr, 2026
Can we get customization options if we need deeper insights into a specific segment like rural electrification or island microgrid controller?.
Adam
Apr, 2026
Does it include market share analysis, strategies, and SWOT insights?.