Microprinting Market by Substrate Type (Plastic, Paper, Metal), Print Type (Single-Sided, Double-Sided), Type (Monochrome, Color), Application (Banking & Finance, Government, Packaging, Healthcare, Education, Corporate), Geography - Global Forecast to 2025-2036


The global microprinting market was valued at USD 0.72 billion in 2025 and is estimated to reach USD 1.34 billion by 2036, at a CAGR of 5.8% between 2025 and 2036.
The global microprinting market is driven by the rising need for enhanced document security, brand protection, and anti-counterfeiting solutions across industries such as banking, government, packaging, and electronics. Increasing adoption of secure printing technologies in currency printing, ID cards, product labels, and legal documents is significantly contributing to market expansion. Governments and financial institutions are investing in advanced microprinting solutions to safeguard against forgery and duplication, reinforcing global security standards.

Microprinting is a high-precision printing technique used to produce extremely small text or patterns that are difficult to reproduce or detect with the naked eye, primarily serving as a security and authentication feature. It involves the use of fine-resolution printing technologies capable of generating characters typically smaller than 0.25 millimeters, making it ideal for preventing counterfeiting and forgery. Microprinting is widely applied in banknotes, passports, identification cards, product packaging, checks, and brand labels, where it provides a covert layer of protection against unauthorized duplication.
Market by Application
Packaging
The packaging segment is expected to witness the highest growth in the microprinting market due to the rising need for brand protection, product authentication, and anti-counterfeiting measures across industries such as pharmaceuticals, cosmetics, food & beverages, and electronics. Growing instances of counterfeit goods and stricter regulatory compliance requirements are driving manufacturers to integrate microtext and covert markings into labels and packaging. Additionally, advancements in digital and hybrid printing technologies enable cost-effective, high-resolution microprinting for mass production packaging applications.
Banking & Finance
The Banking & Finance sector holds the largest market size in the microprinting market due to its extensive use in currency printing, checks, financial documents, and security certificates to prevent forgery and counterfeiting. Central banks and financial institutions rely heavily on microprinting for authentication and fraud prevention, as it offers a cost-effective and tamper-resistant security layer. The increasing circulation of secure banknotes and digital integration in document verification further strengthen its dominance during the forecast period.
Government
Government applications in the microprinting market are witnessing significant growth as the technology is extensively utilized in official identification documents, passports, visas, birth certificates, and other government-issued records to prevent forgery and counterfeiting. Microprinting provides a secure, cost-effective, and easily verifiable authentication layer that is difficult to replicate without specialized equipment. Governments worldwide are increasingly integrating microtext, latent images, and covert codes into high-security printing to strengthen identity verification systems and national security measures.
Corporate
Corporate applications in the microprinting market are expanding rapidly as organizations increasingly adopt secure printing technologies to protect sensitive documents, prevent brand counterfeiting, and enhance product traceability. Microprinting is widely used on employee ID cards, confidential business documents, packaging labels, and brand authentication tags to safeguard intellectual property and ensure data integrity. Its ability to produce microtext, hidden patterns, and verification marks that are nearly impossible to replicate helps corporations mitigate risks of forgery and unauthorized duplication.
Healthcare
Healthcare applications in the microprinting market are witnessing robust growth as the technology is increasingly employed to enhance pharmaceutical security, medical device traceability, and patient safety. Microprinting is utilized on medicine packaging, prescription labels, and diagnostic equipment to prevent counterfeiting and ensure authenticity across the healthcare supply chain. By enabling the printing of microtext, serial identifiers, and covert security marks, microprinting helps manufacturers and regulators track products, verify origin, and comply with stringent labeling standards and guidelines.
Education
Education applications in the microprinting market are growing steadily as academic institutions adopt the technology to enhance document security and prevent certificate forgery. Microprinting is increasingly used on diplomas, transcripts, student ID cards, and examination papers to ensure authenticity and safeguard against counterfeiting or unauthorized duplication. By embedding microtext, covert marks, and serial verification codes, educational boards and universities can easily authenticate official records while maintaining confidentiality.
Market by Type
Monochrome
Monochrome microprinting is expected to hold a substantial share in the microprinting market due to its simplicity, cost-effectiveness, and wide applicability in secure document and packaging printing. It utilizes single-color high-contrast printing to produce fine microtext and patterns that are difficult to replicate, making it ideal for currency, government documents, legal papers, and brand protection labels. This type offers superior legibility, precision, and durability on a variety of substrates, including polymer notes, security paper, and plastic cards.
Color
The color type holds the largest market size in the microprinting market during the forecast period due to its superior visual differentiation, enhanced security features, and wide applicability across currency printing, brand protection, and product packaging. Color microprinting enables the integration of multi-hue microtext, patterns, and covert imagery, making counterfeiting extremely difficult. Its ability to combine aesthetic appeal with advanced authentication supports growing adoption in banking, government, and corporate sectors, where high-resolution, multicolor security printing is increasingly preferred for document and product verification.
Market by Geography
Geographically, the microprinting market is witnessing strong adoption across North America, Europe, Asia Pacific, and the Middle East & Africa. Asia Pacific holds the largest market size, driven by widespread use in banking, government, and corporate security printing, along with early adoption of advanced printing technologies and strict anti-counterfeiting regulations. Europe shows steady growth, supported by robust security standards, government-issued document protection policies, and strong R&D presence in printing and authentication technologies. The Asia Pacific region is projected to witness the fastest growth during the forecast period, fueled by rapid industrialization, increasing currency circulation, and expansion of packaging and manufacturing sectors in countries such as China, Japan, and India. Meanwhile, the Middle East & Africa are emerging markets, where rising investments in financial security systems, government identity programs, and brand protection measures are accelerating adoption.
Market Dynamics
Driver: Rising need for document security and anti-counterfeiting measures
The microprinting market is primarily driven by the growing need for enhanced document security, brand protection, and anti-counterfeiting solutions across various sectors, including banking, government, education, and packaging. With the increasing incidents of document forgery and product duplication, microprinting offers an effective, low-cost, and durable security feature that is extremely difficult to replicate without specialized equipment.
Restraint: High setup and maintenance costs of microprinting systems
The microprinting market faces a significant restraint due to the high initial investment and operational costs associated with advanced microprinting equipment and precision printing technologies. Producing high-resolution microtext requires specialized machinery, premium inks, and high-quality substrates, which increase setup and maintenance expenses. Additionally, frequent calibration, skilled operator requirements, and periodic quality checks add to operational costs.
Opportunity: Growing integration of digital verification and smart authentication technologies
The increasing integration of digital verification, IoT-based authentication, and AI-driven image recognition is creating major growth opportunities in the microprinting market. As industries and governments move toward smart security ecosystems, combining microprinting with QR codes, blockchain, and optical scanners enables multi-layered authentication and real-time traceability of products and documents.
Challenge: Maintaining precision and readability at microscopic scales
The microprinting market faces a major challenge in achieving high precision, clarity, and durability of printed microtext at extremely small scales. As character sizes often fall below 0.25 millimeters, even minor variations in ink quality, substrate texture, or printer calibration can lead to blurred or unreadable text. Maintaining consistent legibility requires specialized high-resolution equipment, controlled printing environments, and skilled operators, which increase production complexity and costs.
Future Outlook
Between 2025 and 2036, the microprinting market is expected to witness robust growth as the demand for advanced security, authentication, and traceability solutions continues to rise across government, banking, corporate, and industrial sectors. Increasing threats of counterfeiting, document forgery, and product duplication are driving greater integration of microprinting in currency, identification documents, pharmaceuticals, and packaging. Advancements in digital microprinting, hybrid ink technologies, and AI-enabled verification systems will further enhance precision, efficiency, and scalability. The combination of microprinting with IoT-based authentication and blockchain traceability will transform traditional security printing into intelligent, data-driven solutions.
Key Market Players
Top microprinting companies include Xerox Corporation (US), Videojet Technologies (US), Brady Corporation (US), HP Development Company, L.P. (US), Zebra Technologies Corp. (US).
Key Questions addressed in this report:
- What are the global trends in demand for the market?
- What are the upcoming technologies/product areas that will have a significant impact on the market in the future?
- What will be the revenue pockets for the market players in the next 6 years?
- What are the prime strategies followed by key players in the market?
 Exclusive indicates content/data unique to MarketsandMarkets and not available with any competitors.
Table of Contents
1 Introduction (Page No. - 20)
1.1 Study Objectives
1.2 Definition
1.3 Scope
1.3.1 Markets Covered
1.3.2 Years Considered
1.4 Currency
1.5 Market Stakeholders
2 Research Methodology (Page No. - 24)
2.1 Research Data
2.1.1 Secondary Data
2.1.1.1 Secondary Sources
2.1.2 Primary Data
2.1.2.1 Primary Sources
2.1.2.2 Key Industry Insights
2.1.2.3 Breakdown of Primaries
2.2 Market Size Estimation
2.2.1 Bottom-Up Approach
2.2.2 Top-Down Approach
2.3 Market Breakdown and Data Triangulation
2.4 Research Assumptions
3 Executive Summary (Page No. - 33)
4 Premium Insights (Page No. - 37)
4.1 Attractive Opportunities in Microprinting Market
4.2 Microprinting Market, By Country
4.3 Microprinting Market, By Application
4.4 Microprinting Market in APAC, By Application and Country
5 Market Overview (Page No. - 41)
5.1 Introduction
5.2 Market Dynamics
5.2.1 Drivers
5.2.1.1 Standards and Regulations in Banking Sector
5.2.1.2 Technological Advancement in Microprinting
5.2.2 Restraints
5.2.2.1 Increasing Digitization Limiting Microprinting Market Growth
5.2.3 Opportunities
5.2.3.1 Growing Concern About Brand Protection and Product Safety
5.2.3.2 Increasing Use of Microprinting Technology in Healthcare
5.2.4 Challenges
5.2.4.1 Heat Setting Issues in Microprinting-Based Printers
6 Microprinting Market, By Substrate Type (Page No. - 44)
6.1 Introduction
6.2 Plastic
6.2.1 Plastic to Dominate Microprinting Market, in Terms of Growth Rate, Owing to High Adoption of Microprinting in Plastic-Based Id Cards
6.3 Paper
6.3.1 Increasing Adoption of Microprinting to Boost Paper Market Due to Anti-Counterfeit Benefits and High Security
6.4 Metal
6.4.1 Increasing Need for Reliable Substrate Base From Automotive and Aerospace Applications Offer Growth Opportunity for Metal Market
7 Microprinting Market, By Print Type (Page No. - 49)
7.1 Introduction
7.2 Single-Sided
7.2.1 Increasing Need for Secure Technology From Government and Packaging Applications Provide Growth Opportunity for Single-Sided Microprinting Market
7.3 Double-Sided
7.3.1 Initiative Taken By Banking and Finances Agencies to Adopt Microprinting Technology in Banknotes Spur Growth of Double-Sided Microprinting Market
8 Microprinting Market, By Type (Page No. - 63)
8.1 Introduction
8.2 Monochrome
8.2.1 Increasing Adoption of Monochrome-Based Microprinting Printer to Boost Monochrome Microprinting Market Due to Excellent Print Quality and Low Price Benefits
8.3 Color
8.3.1 Color-Based Microprinting Printer to Dominate Microprinting Market, in Terms of Size, Owing to Growing Adoption of Microprinting in Banknote and Postage Stamps
9 Microprinting Market, By Application (Page No. - 68)
9.1 Introduction
9.2 Banking & Finance
9.2.1 Microprinting Market for Banking & Finance Applications Will Be Driven By Increasing Demand for Anti-Counterfeit Tools and Printers for Counterfeit Deterrence
9.3 Government
9.3.1 Microprinting Market Growth for Government Applications Propelled By Increasing Adoption of Microprinting to Detect Fake Currency and Check Slips
9.4 Packaging
9.4.1 Requirement for High Quality Printing in Packaging Application to Trace Products and Avoid Duplicity Creates an Opportunity for Mciroprinting Market
9.5 Healthcare
9.5.1 Microprinting Market Growth for Healthcare Applications Driven By High Adoption of Microprinting to Authenticate Several Medical Products and Prescriptions
9.6 Education
9.6.1 Features of Microprinting Technology Such as Anti-Counterfeiting Along With High Security Offer Growth Opportunities
9.7 Corporate
9.7.1 Requirement for High-Level Secure Technology, With Low Cost Investment, to Avoid Counterfeiting of Confidential Documents Creates Growth Opportunity for Microprinting Market
9.8 Others
9.8.1 Market Growth Propelled By Need for Reliable and Secure Printing in Hospitality and Retail Applications to Avoid Card Duplicity
10 Geographic Analysis (Page No. - 81)
10.1 Introduction
10.2 North America
10.2.1 Presence of Leading Players in North America Provides Opportunity in Microprinting Market
10.2.2 US
10.2.2.1 US is Leading Country in North American Microprinting Market
10.2.3 Canada
10.2.3.1 Packaging Application is Among Important Markets for Microprinting in Canada
10.2.4 Mexico
10.2.4.1 Banking & Finance Contributes Significantly for Market in Mexico
10.3 Europe
10.3.1 UK
10.3.1.1 Government and Banking & Finance are Important Applications of Market in UK
10.3.2 Germany
10.3.2.1 Germany is A Leading Country in European Market
10.3.3 France
10.3.3.1 Increasing Need for Anti-Counterfeit Tools in Various Applications Drives Microrprinting Market in France
10.3.4 Italy
10.3.4.1 Increasing Demand for Microprinting Technology for Government Documents Drives Market Growth
10.3.5 Rest of Europe
10.4 APAC
10.4.1 Increasing Incidences of Fraudulent Activities Drive the Need for Microprinting Solutions
10.4.2 China
10.4.2.1 Expansion of Banking Sector Propels Growth of Market
10.4.3 Japan
10.4.3.1 Government Regulations to Utilize Anti-Counterfeiting Measures Drives Demand for Microprinting Solutions
10.4.4 India
10.4.4.1 Government and Banking & Finance are Important Applications of Market
10.4.5 Rest of APAC
10.5 RoW
10.5.1 South America
10.5.1.1 Packaging Application to Provide Opportunities for Market
10.5.2 Middle East & Africa
10.5.2.1 Increasing Presence of Global Players in MEA Provides Opportunity for Market
11 Competitive Landscape (Page No. - 97)
11.1 Introduction
11.2 Market Ranking Analysis, 2018
11.3 Competitive Leadership Mapping
11.3.1 Visionary Leaders
11.3.2 Dynamic Differentiators
11.3.3 Innovators
11.3.4 Emerging Players
11.4 Competitive Scenario
11.4.1 Product Launches and Developments
11.4.2 Partnerships and Agreements
11.4.3 Acquisitions, Expansions, and Investments
12 Company Profile (Page No. - 103)
12.1 Key Players
12.1.1 Xerox Corporation
12.1.1.1 Business Overview
12.1.1.2 Products Offered
12.1.1.3 Recent Developments
12.1.1.4 SWOT Analysis
12.1.1.5 MnM View
12.1.2 Videojet Technologies, Inc.
12.1.2.1 Business Overview
12.1.2.2 Products Offered
12.1.2.3 Recent Developments
12.1.2.4 SWOT Analysis
12.1.2.5 MnM View
12.1.3 Matica Technologies Ag
12.1.3.1 Business Overview
12.1.3.2 Products Offered
12.1.3.3 Recent Developments
12.1.3.4 SWOT Analysis
12.1.3.5 MnM View
12.1.4 Brady Corporation
12.1.4.1 Business Overview
12.1.4.2 Products Offered
12.1.4.3 SWOT Analysis
12.1.4.4 MnM View
12.1.5 Zebra Technologies Corporation
12.1.5.1 Business Overview
12.1.5.2 Products Offered
12.1.5.3 SWOT Analysis
12.1.5.4 MnM View
12.1.6 HP Inc.
12.1.6.1 Business Overview
12.1.6.2 Product Offered
12.1.6.3 Recent Developments
12.1.6.4 MnM View
12.1.7 Ricoh Company Ltd.
12.1.7.1 Business Overview
12.1.7.2 Products Offered
12.1.7.3 Recent Developments
12.1.7.4 MnM View
12.1.8 Canon Finetech Nisca Inc.
12.1.8.1 Business Overview
12.1.8.2 Products Offered
12.1.8.3 MnM View
12.1.9 Source Technologies
12.1.9.1 Business Overview
12.1.9.2 Products Offered
12.1.9.3 Recent Developments
12.1.9.4 MnM View
12.1.10 SAFEChecks
12.1.10.1 Business Overview
12.1.10.2 Products Offered
12.1.10.3 MnM View
12.2 Other Key Players
12.2.1 Xeikon
12.2.2 Domino Printing Sciences PLC
12.2.3 Control Print Ltd.
12.2.4 Data Carte Concepts
12.2.5 Evolis
12.2.6 Micro Format, Inc.
12.2.7 Spectrum Positive
12.2.8 Printegra, an Ennis Company
12.2.9 Trustcopy
12.2.10 William Frick & Company
13 Appendix (Page No. - 130)
13.1 Discussion Guide
13.2 Knowledge Store: Marketsandmarkets’ Subscription Portal
13.3 Introducing RT: Real-Time Market Intelligence
13.4 Available Customizations
13.5 Related Reports
13.6 Author Details
List of Tables (66 Tables)
Table 1 Microprinting Market, By Substrate, 2015–2024 (USD Million)
Table 2 Market for Plastic Substrate, By Print Type, 2015–2024 (USD Million)
Table 3 Market for Paper Substrate Type, By Print Type, 2015–2024 (USD Million)
Table 4 Market, By Print Type, 2015–2024 (USD Million)
Table 5 Single-Sided Market, By Substrate, 2015–2024 (USD Million)
Table 6 Single-Sided Market, By Application, 2015–2024 (USD Million)
Table 7 Single-Sided Market for Government Applications, By Region, 2015–2024 (USD Million)
Table 8 Single-Sided Microprinting for Banking & Finance Applications, By Region, 2015–2024 (USD Million)
Table 9 Single-Sided Microprinting for Corporate Applications, By Region, 2015–2024 (USD Million)
Table 10 Single-Sided Market for Healthcare Applications, By Region, 2015–2024 (USD Million)
Table 11 Single-Sided Market for Packaging Applications, By Region, 2015–2024 (USD Million)
Table 12 Single-Sided Market for Education Applications, By Region, 2015–2024 (USD Million)
Table 13 Single-Sided Market for Other Applications, By Region, 2015–2024 (USD Million)
Table 14 Single-Sided Market, By Region, 2015–2024 (USD Million)
Table 15 Double-Sided Market, By Substrate, 2015–2024 (USD Million)
Table 16 Double-Sided Market, By Application, 2015–2024 (USD Million)
Table 17 Double Sided Market for Government Applications, By Region, 2015–2024 (USD Million)
Table 18 Double-Sided Microprinting for Banking & Finance Applications, By Region, 2015–2024 (USD Million)
Table 19 Double-Sided Microprinting for Corporate Applications, By Region, 2015–2024 (USD Million)
Table 20 Double-Sided Market for Healthcare Applications, By Region, 2015–2024 (USD Million)
Table 21 Double-Sided Market for Packaging Applications, By Region, 2015–2024 (USD Million)
Table 22 Double-Sided Market for Education Applications, By Region, 2015–2024 (USD Thousand)
Table 23 Double-Sided Market for Other Applications, By Region, 2015–2024 (USD Thousand)
Table 24 Double-Sided Market, By Region, 2015–2024 (USD Million)
Table 25 Market, By Type, 2015–2024 (USD Million)
Table 26 Market for Monochrome Type, By Application, 2015–2024 (USD Million)
Table 27 Market for Color Type, By Application, 2015–2024 (USD Million)
Table 28 Market, By Application, 2015–2024 (USD Million)
Table 29 Market for Banking & Finance Applications, By Print Type, 2015–2024 (USD Million)
Table 30 Market for Banking & Finance Applications, By Type, 2015–2024 (USD Million)
Table 31 Market for Banking & Finance Applications, By Region, 2015–2024 (USD Million)
Table 32 Market for Government Applications, By Print Type, 2015–2024 (USD Million)
Table 33 Market for Government Applications, By Type, 2015–2024 (USD Million)
Table 34 Market for Government Applications, By Region, 2015–2024 (USD Million)
Table 35 Market for Packaging Applications, By Print Type, 2015–2024 (USD Million)
Table 36 Market for Packaging Applications, By Type, 2015–2024 (USD Million)
Table 37 Market for Packaging Applications, By Region, 2015–2024 (USD Million)
Table 38 Market for Healthcare Applications, By Print Type, 2015–2024 (USD Million)
Table 39 Market for Healthcare Applications, By Type, 2015–2024 (USD Million)
Table 40 Market for Healthcare Applications, By Region, 2015–2024 (USD Million)
Table 41 Market for Education Applications, By Print Type, 2015–2024 (USD Million)
Table 42 Market for Education Applications, By Type, 2015–2024 (USD Million)
Table 43 Market for Education Applications, By Region, 2015–2024 (USD Million)
Table 44 Market for Corporate Applications, By Print Type, 2015–2024 (USD Million)
Table 45 Market for Corporate Applications, By Type, 2015–2024 (USD Million)
Table 46 Market for Corporate Applications, By Region, 2015–2024 (USD Million)
Table 47 Market for Other Applications, By Print Type, 2015–2024 (USD Million)
Table 48 Market for Other Applications, By Type, 2015–2024 (USD Million)
Table 49 Market for Other Applications, By Region, 2015–2024 (USD Million)
Table 50 Market, By Region, 2015–2024 (USD Million)
Table 51 Market in North America, By Print Type, 2015–2024 (USD Million)
Table 52 Market in North America, By Application, 2015–2024 (USD Million)
Table 53 Market in North America, By Country, 2015–2024 (USD Million)
Table 54 Market in Europe, By Print Type, 2015–2024 (USD Million)
Table 55 Market in Europe, By Application, 2015–2024 (USD Million)
Table 56 Market in Europe, By Country, 2015–2024 (USD Million)
Table 57 Market in APAC, By Print Type, 2015–2024 (USD Million)
Table 58 Market in APAC, By Application, 2015–2024 (USD Million)
Table 59 Market in APAC, By Country, 2015–2024 (USD Million)
Table 60 Market in Middle East & Africa, By Print Type, 2015–2024 (USD Million)
Table 61 Market in Middle East & Africa, By Application, 2015–2024 (USD Million)
Table 62 Market in Middle East & Africa, By Region, 2015–2024 (USD Million)
Table 63 Ranking of Top 5 Players in Market
Table 64 Product Launches and Developments, 2016–2018
Table 65 Partnerships and Agreements, 2017–2018
Table 66 Acquisitions, Expansions, and Investments, 2017–2018
List of Figures (39 Figures)
Figure 1 Microprinting Market: Research Design
Figure 2 Research Flow of Market Size Estimation
Figure 3 Market Size Estimation Methodology: Bottom-Up Approach
Figure 4 Market Size Estimation Methodology: Top-Down Approach
Figure 5 Data Triangulation
Figure 6 Color Type to Dominate Market
Figure 7 Packaging Application to Witness Highest CAGR in Market During Forecast Period
Figure 8 Single-Sided Print Type Held Larger Share of Market in 2018
Figure 9 APAC to Hold Largest Share of Market
Figure 10 Growing Adoption of Microprinting in Banking & Finance Application to Drive Market During Forecast Period
Figure 11 Market to Grow at Highest CAGR in China During Forecast Period
Figure 12 Banking & Finance Application to Hold Largest Share of Market By 2024
Figure 13 Banking & Finance Application and China to Hold Largest Share of Market By 2024
Figure 14 Standards and Regulations in Banking Sector
Figure 15 Microprinting Market, By Type
Figure 16 Plastic to Grow at Highest CAGR During Forecast Period
Figure 17 Microprinting Market, By Print Type
Figure 18 Single-Sided Microprinting to Grow at Higher CAGR From 2019 to 2024
Figure 19 Single-Sided Microprinting for Paper Substrate to Grow at Highest CAGR During Forecast Period
Figure 20 Microprinting Market, By Type
Figure 21 Color Type to Grow at Higher CAGR From 2019 to 2024
Figure 22 Microprinting Market, By Application
Figure 23 Market for Packaging to Grow at Highest CAGR During Forecast Period
Figure 24 Market in APAC to Grow at Highest CAGR During Forecast Period
Figure 25 North America: Snapshot of Microprinting Market
Figure 26 Europe: Snapshot of Market
Figure 27 APAC: Snapshot of Market
Figure 28 Companies Adopted Product Launches and Developments as Key Growth Strategies From 2017 to 2018
Figure 29 Market (Global) Competitive Leadership Mapping (2018)
Figure 30 Xerox Corporation: Company Snapshot
Figure 31 Videojet Technologies, Inc.: Company Snapshot
Figure 32 Matica Technologies AG: Company Snapshot
Figure 33 Brady Corporation: Company Snapshot
Figure 34 Zebra Technologies Corporation: Company Snapshot
Figure 35 HP Inc.: Company Snapshot
Figure 36 Ricoh Company Ltd.: Company Snapshot
Figure 37 Canon Finetech Nisca Inc.: Company Snapshot
Figure 38 Source Technologies: Company Snapshot
Figure 39 SAFEChecks: Company Snapshot
The study involved 4 major activities to estimate the market size for microprinting. Exhaustive secondary research has been done to collect information on the market, the peer market, and the parent market. Validating these findings, assumptions, and sizing with industry experts across value chain through primary research has been the next phase. Both top-down and bottom-up approaches have been employed to estimate the complete market. After that, market breakdown and data triangulation methods have been used to estimate the market for segments and subsegments.
Secondary Research
In the secondary research process, various secondary sources such as Hoovers, Bloomberg BusinessWeek, and Factiva have been referred to identify and collect information for this study. These secondary sources included annual reports, press releases and investor presentations of companies, white papers, certified publications, articles by recognized authors, gold standard and silver standard websites, regulatory bodies, trade directories, and databases.
Primary Research
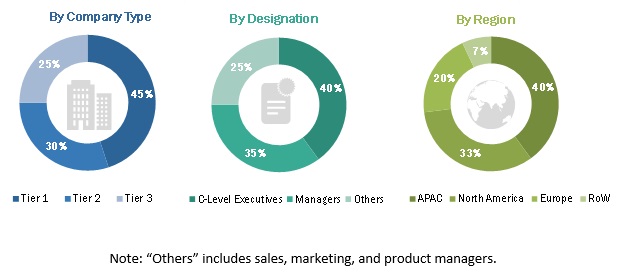
The microprinting market comprises several stakeholders, such as microprinting product manufacturers and providers, and microprinting service providers in the supply chain. The demand side of this market includes banking & finance, government, corporate, packaging, healthcare, education, and others. The supply side is characterized by advancements in microprinting technologies. Various primary sources from both supply and demand sides of the market have been interviewed to obtain qualitative and quantitative information. The breakdown of primary respondents is as follows
To know about the assumptions considered for the study, download the pdf brochure
Market Size Estimation
Both top-down and bottom-up approaches have been used to estimate and validate the total size of the microprinting market. These methods have also been used extensively to estimate the size of various subsegments in the market. The research methodology used to estimate the market size is as follows:
- Key players in the industry and markets have been identified through extensive secondary research.
- The industry’s supply chain and market size, in terms of value, have been determined through primary and secondary research processes.
- All percentage shares, splits, and breakdowns have been determined using secondary sources and verified through primary sources.
Data Triangulation
After arriving at the overall market size—using the market size estimation processes as explained above—the market has been split into several segments and subsegments. To complete the overall market engineering process and arrive at the exact statistics of each market segment and subsegment, the data triangulation, and market breakdown procedures have been employed, wherever applicable. The data has been triangulated by studying various factors and trends from both demand and supply sides in banking & finance, government, corporate, packaging, healthcare, education, and others applications.
Report Objectives
- To describe and forecast the microprinting market, in terms of value, by type, print type, substrate, type, application
- To describe and forecast the market, in terms of value, by region—North America, Europe, Asia Pacific (APAC), and Rest of the World (RoW)
- To provide detailed information regarding major factors influencing market growth (drivers, restraints, opportunities, and challenges)
- To strategically analyze micromarkets with respect to individual growth trends, prospects, and contributions to the overall market
-
To strategically profile key players and comprehensively analyze their market position in
terms of ranking and core competencies, along with detailing competitive landscape for market leaders - To analyze strategic approaches such as agreements, acquisitions, product developments and launches, expansions, partnerships, investments, and research and development (R&D) in the microprinting market
Available Customizations:
With the given market data, MarketsandMarkets offers customizations according to the company’s specific needs. The following customization options are available for the report:
Company Information:
- Detailed analysis and profiling of additional market players (up to 5)


Growth opportunities and latent adjacency in Microprinting Market