Miticides Market by Crop Type (Fruits & Vegetables, Cereals & Grains, and Oilseeds & Pulses), Mode of Application (Foliar Spray and Soil Treatment), Source (Biological and Chemical), Form (Dry and Liquid), and Region - Global Forecast to 2023


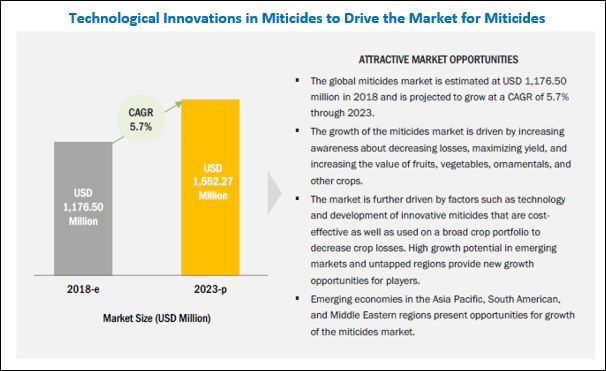
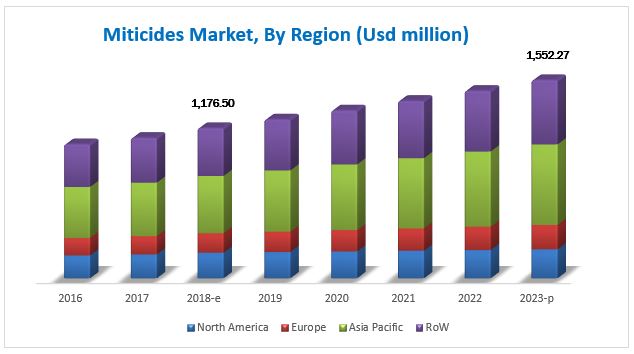
[135 Pages Report] The miticides market is estimated to be valued USD 1,176.5 Million in 2018 and is projected to reach USD 1,552.3 Million by 2023, at a CAGR of 5.7% from 2018 to 2023. The growth of the miticides market is driven by increasing awareness about decreasing losses, maximizing yield, and increasing the value of fruits, vegetables, ornamentals, and other crops. The market is further driven by factors such as technology and development of innovative miticides that are cost-effective as well as used on a broad crop portfolio to decrease crop losses. The rising concerns about crop protection against mites without adverse effects on the environment have led farmers to explore new formulations of miticides to increase yield. Promotions by government organizations for the adoption of miticides and their low cost compared to that of broad-spectrum insecticides are some factors that are expected to drive the market growth through the next five years in most regions.
For More details on this research, Request Free Sample Report
The demand for pesticides is increasing to meet the growing requirements from the constantly evolving agriculture sector. Agricultural productivity has risen as a result of improved crop varieties, enhanced crop protection chemicals, and supplementary irrigation water. Population growth exceeds global food production owing to which increased use of best grades of crop protection chemicals such as miticides will benefit growers in developing countries. North America is one of the largest consumers of miticide products. The region is a key exporter of agricultural products such as fruits, oilseeds, and ornamental plants. The region is dominated by large-scale operations, primarily focused on exports, with an organized distribution chain. Factors such as fertile soil, availability of water & land, entrepreneurial farmers, and efficient infrastructure are key competitive advantages for the North American market.
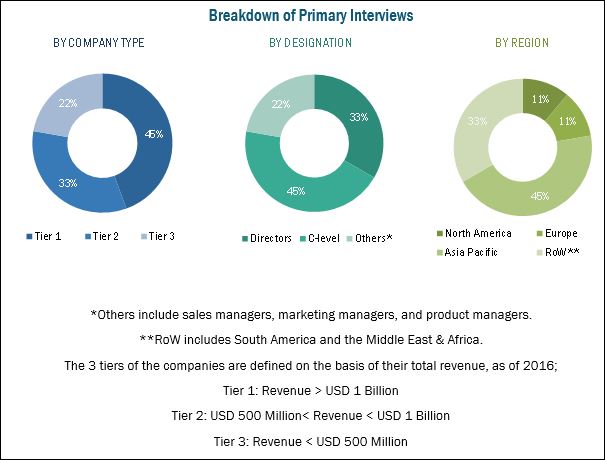
This report includes estimations of the market size in terms of value (USD million) and volume (KT). Both, the top-down and bottom-up approaches have been used to estimate and validate the size of the miticides market and to estimate the size of various other dependent submarkets in the overall market. The key players in the market have been identified through secondary research; some of these sources are press releases, paid databases such as Factiva and Bloomberg, annual reports, and financial journals; their market shares in respective regions have also been determined through primary and secondary research. All percentage shares, splits, and breakdowns have been determined using secondary sources and verified through primary sources. The figure below shows the breakdown of profiles of industry experts that participated in the primary discussions.
To know about the assumptions considered for the study, download the pdf brochure
Key participants in the miticides market are manufacturers, miticides manufacturers, distributors & suppliers, associations and industry bodies and end users. Syngenta (China), Gowan (US), BASF (Germany), and Bayer (Germany) are some of the leading players in the global miticides market.
This report is targeted at the existing stakeholders in the industry, which include the following:
- Miticide manufacturers
- Miticide traders, distributors, and suppliers
- Crop protection chemical manufacturers
- Government and research organizations
- Associations and industry bodies
- Agricultural universities
�The study answers several questions for stakeholders, primarily which market segments to focus on in the next two to five years for prioritizing efforts and investments.�
Scope of the Report
The miticides market has been segmented as follows:
On the basis of Crop Type,
- Fruits & vegetables
- Cereals & grains
- Oilseeds & pulses
- Others (turf & ornamentals and cash crops)
On the basis of Formulation,
- Liquid
- Dry
On the basis of Mode of Application,
- Foliar spray
- Soil treatment
- Others (seed treatment and post-harvest treatment)
On the basis of Source,
- Biological
- Chemical
On the basis of Region,
- North America
- Europe
- Asia Pacific
- RoW (South America and the Middle East & Africa)
Available Customizations
With the given market data, MarketsandMarkets offers customizations according to the company�s specific needs.
The following customization options are available for the report:
Segment Analysis
- Product Matrix, which gives a detailed comparison of the product portfolio of each company
Regional Analysis
- Further breakdown of the Rest of Asia Pacific miticides market, by country
- Further breakdown of the Rest of Europe miticides market, by country
- Further breakdown of the South American miticides market, by country
- Further breakdown of the Middle Eastern & African miticides market, by country
Company Information
- Detailed analysis and profiling of additional market players (up to five)
The miticides market is projected to grow at a CAGR of 5.7%, to reach a value of USD 1.55 Billion by 2023 from USD 1.17 Billion in 2018. Miticides are crop protection chemicals that specifically target plant mites. They constitute an important group of crop protection chemicals used to protect plants from harmful mites and insects such as spiders and ticks. Miticides often vary on the basis of the mites they target and the promptness of their killing rate and are effective against eggs and larval stages as well as adult mites.
On the basis of source, the chemical segment dominated the miticides market in 2017. The use of synthetic chemical miticides for plant and crop protection is constantly growing. Many specific miticides have been introduced, which are less toxic to predaceous mites than phytophagous mites are and help in controlling the population of phytophagous mites.
On the basis of crop type, the fruits & vegetables segment accounted for the largest market share; this can be attributed to growing health-consciousness among consumers and rising incomes, which result in increased consumption of a wide variety of products, particularly fruits & vegetables. Developing regions such as Asia Pacific offer opportunities for the miticides market, due to the large fruit-growing industries in major countries such as India, China, and Southeast Asian countries and the rise in awareness about the benefits of miticides in the market.
On the basis of formulation, the miticides market was led by the liquid segment in 2017. Liquid formulations are mainly preferred as they do not cause dust formation on spraying, do not cause toxicity or flammability, provide high efficiency due to smaller particle size, and low packaging volume. Moreover, foliar spray is the most widely used mode of application, owing to its ease and high effectiveness.
The Asia Pacific region is projected to be the fastest-growing market for miticides between 2018 and 2023. The increasing awareness about miticides and continuous technological advancements are factors contributing to the growth of this market. In addition to this, the growing demand for crops and rising cultivation in the countries of Asia Pacific have forced agribusiness companies to expand their supplier and manufacturing base in the region.
For more details on this research, Request Free Sample Report
Many countries have banned several chemical pesticides because of their hazardous nature. For instance, the US banned around 64 synthetic pesticides by 2003, and the number is still increasing. This has led to high consumption of biological miticides in the European and North American regions due to stringent environmental regulations. These stringent rules and regulations for miticides are generally associated with the toxicity of miticides, which affects animal and human health, along with leading to environmental degradation. Health hazards such as the presence of carcinogens, increasing pollution, and concerns about the environment are the main reasons for enforcing these restrictions, which is a restraint for the miticides market.
Syngenta (China), Gowan (US), BASF (Germany), and Bayer (Germany) are some of the leading players in the global miticides market. These companies adopted strategies such as agreements, expansions, mergers & acquisitions, new product launches and partnerships, and investment & collaborations to strengthen their position in the market.
To speak to our analyst for a discussion on the above findings, click Speak to Analyst
 Exclusive indicates content/data unique to MarketsandMarkets and not available with any competitors.
Table of Contents
1 Introduction (Page No. - 14)
1.1 Objectives of the Study
1.2 Market Definition
1.3 Study Scope
1.4 Periodization Considered for the Study
1.5 Currency Considered
1.6 Unit Considered
1.7 Stakeholders
2 Research Methodology (Page No. - 18)
2.1 Research Data
2.1.1 Secondary Data
2.1.2 Primary Data
2.1.2.1 Breakdown of Primary Interviews
2.2 Market Size Estimation
2.3 Data Triangulation
2.4 Research Assumptions
2.5 Research Limitations
3 Executive Summary (Page No. - 24)
4 Premium Insights (Page No. - 28)
4.1 Attractive Opportunities in the Miticides Market
4.2 Miticides Market Size, By Region (KT)
4.3 North American Miticides Market Share, By Crop Type & Country, 2018
4.4 Miticides Market, Fastest Growing Countries in Each Region
5 Market Overview (Page No. - 32)
5.1 Introduction
5.2 Market Dynamics
5.2.1 Drivers
5.2.1.1 Advancements in Farming Practices and Technology
5.2.1.2 Growth in Agricultural Productivity
5.2.1.3 Heavy Crop Loss Due to Pest Attacks
5.2.2 Restraints
5.2.2.1 High Residue Levels of Miticides on Excessive Use
5.2.2.2 Stringent Government Regulations
5.2.2.3 Easy Availability of Substitutes and Alternatives
5.2.3 Opportunities
5.2.3.1 Rapid Growth in Biopesticides Market and Organic Agriculture
5.2.3.2 Increasing Demand in Developing Countries
5.2.3.3 Increasing Adoption of Integrated Pest Management (IPM)
5.2.4 Challenges
5.2.4.1 Resistance of Mites to Miticides
5.2.4.2 Evolution of Biotechnology and Increasing Acceptance of GM Crops
5.3 Supply Chain
6 Miticides Market, By Crop Type (Page No. - 40)
6.1 Introduction
6.2 Fruits & Vegetables
6.2.1 Berries
6.2.2 Pome Fruits
6.2.3 Citrus Fruits
6.2.4 Root & Tuber Vegetables
6.2.5 Other Fruits & Vegetables
6.3 Cereals & Grains
6.3.1 Corn
6.3.2 Wheat
6.4 Oilseeds & Pulses
6.4.1 Cotton
6.4.2 Soybean
6.4.3 Sunflower & Rapeseed
6.4.4 Others
6.5 Other Crop Types
6.5.1 Turf & Ornamentals
6.5.2 Cash Crops
7 Miticides Market, By Mode of Application (Page No. - 48)
7.1 Introduction
7.2 Foliar Spray
7.3 Soil Treatment
7.4 Others
8 Miticides Market, By Formulation (Page No. - 54)
8.1 Introduction
8.2 Liquid
8.3 Dry
9 Miticides Market, By Source (Page No. - 59)
9.1 Introduction
9.2 Chemical
9.3 Biological
10 Miticides Market, By Region (Page No. - 64)
10.1 Introduction
10.2 North America
10.2.1 US
10.2.2 Canada
10.2.3 Mexico
10.3 Europe
10.3.1 Germany
10.3.2 Spain
10.3.3 France
10.3.4 Italy
10.3.5 Rest of Europe
10.4 Asia Pacific
10.4.1 China
10.4.2 India
10.4.3 Australia & New Zealand
10.4.4 Japan
10.4.5 Rest of Asia Pacific
10.5 Rest of the World (RoW)
10.5.1 South America
10.5.2 Middle East & Africa
11 Competitive Landscape (Page No. - 91)
11.1 Overview
11.2 Expansions
11.3 Agreements
11.4 Mergers & Acquisitions
11.5 New Product Launches
11.6 Partnerships, Investments, and Collaborations
12 Company Profiles (Page No. - 98)
(Business Overview, Products Offered, Recent Developments, SWOT Analysis & MnM View)*
12.1 BASF
12.2 Bayer AG
12.3 Syngenta
12.4 Nihon Nohyaku Co., Ltd.
12.5 Gowan Company, LLC
12.6 Dowdupont
12.7 ADAMA
12.8 Platform Solutions (Arysta Lifescience)
12.9 FMC Corporation
12.10 Nufarm Limited
12.11 Valent Biosciences
12.12 Certis
12.13 OHP, Inc.
12.14 Nissan Chemicals Industry
*Details on Business Overview, Products Offered, Recent Developments, SWOT Analysis & MnM View Might Not Be Captured in Case of Unlisted Companies.
13 Appendix (Page No. - 129)
13.1 Discussion Guide
13.2 Knowledge Store: Marketsandmarkets� Subscription Portal
13.3 Introducing RT: Real-Time Market Intelligence
13.4 Available Customizations
13.5 Related Reports
13.6 Author Details
List of Tables (72 Tables)
Table 1 US Dollar Exchange Rate, 2014�2017
Table 2 Steps Followed in IPM
Table 3 Miticides Market Size, By Crop Type, 2016�2023 (USD Million)
Table 4 Market Size, By Crop Type, 2016�2023 (KT)
Table 5 Miticides Market Size in Fruits & Vegetables, By Crop, 2016�2023 (USD Million)
Table 6 Miticides Market Size in Cereals & Grains, By Crop, 2016�2023 (USD Million)
Table 7 Miticides Market Size in Oilseeds & Pulses, By Crop, 2016�2023 (USD Million)
Table 8 Miticides Market Size in Other Crop Types, By Crop, 2016�2023 (USD Million)
Table 9 Miticides Market Size, By Mode of Application, 2016�2023 (USD Million)
Table 10 Market Size, By Mode of Application, 2016�2023 (KT)
Table 11 Miticides Market Size for Foliar Spray, By Region, 2016�2023 (USD Million)
Table 12 Market Size for Foliar Spray, By Region, 2016�2023 (KT)
Table 13 Miticides Market Size for Soil Treatment, By Region, 2016�2023 (USD Million)
Table 14 Market Size for Soil Treatment, By Region, 2016�2023 (KT)
Table 15 Miticides Market Size for Other Modes of Application, By Region, 2016�2023 (USD Million)
Table 16 Market Size for Other Modes of Application, By Region, 2016�2023 (KT)
Table 17 Miticides Market Size, By Form, 2016�2023 (USD Million)
Table 18 Market Size, By Form, 2016�2023 (KT)
Table 19 Liquid Miticides Market Size, By Region, 2016�2023 (USD Million)
Table 20 Liquid Miticides Market Size, By Region, 2016�2023 (KT)
Table 21 Dry Miticides Market Size, By Region, 2016�2023 (USD Million)
Table 22 Dry Miticides Market Size, By Region, 2016�2023 (KT)
Table 23 Miticides Market Size, By Source, 2016�2023 (USD Million)
Table 24 Market Size, By Source, 2016�2023 (KT)
Table 25 Chemical Miticides Market Size, By Region, 2016�2023 (USD Million)
Table 26 Chemical Miticides Market Size, By Region, 2016�2023 (KT)
Table 27 Biological Miticides Market Size, By Region, 2016�2023 (USD Million)
Table 28 Biological Miticides Market Size, By Region, 2016�2023 (KT)
Table 29 Miticides Market Size, By Region, 2016�2023 (USD Million)
Table 30 Market Size, By Region, 2016�2023 (KT)
Table 31 North America: Miticides Market Size, By Country, 2016�2023 (USD Million)
Table 32 North America: Market Size, By Mode of Application, 2016�2023 (USD Million)
Table 33 North America: Market Size, By Mode of Application, 2016�2023 (KT)
Table 34 North America: Market Size, By Crop Type, 2016�2023 (USD Million)
Table 35 North America: Market Size, By Crop Type, 2016�2023 (KT)
Table 36 North America: Market Size, By Source, 2016�2023 (USD Million)
Table 37 North America: Market Size, By Source, 2016�2023 (KT)
Table 38 North America: Market Size, By Form, 2016�2023 (USD Million)
Table 39 North America: Market Size, By Form, 2016�2023 (KT)
Table 40 Europe: Miticides Market Size, By Country, 2016�2023 (USD Million)
Table 41 Europe: Market Size, By Mode of Application, 2016�2023 (USD Million)
Table 42 Europe: Market Size, By Mode of Application, 2016�2023 (KT)
Table 43 Europe: Market Size, By Crop Type, 2016�2023 (USD Million)
Table 44 Europe: Market Size, By Crop Type, 2016�2023 (KT)
Table 45 Europe: Market Size, By Source, 2016�2023 (USD Million)
Table 46 Europe: Market Size, By Source, 2016�2023 (KT)
Table 47 Europe: Market Size, By Form, 2016�2023 (USD Million)
Table 48 Europe: Market Size, By Form, 2016�2023 (KT)
Table 49 Asia Pacific: Miticides Market Size, By Country/Region, 2016�2023 (USD Million)
Table 50 Asia Pacific: Market Size, By Mode of Application, 2016�2023 (USD Million)
Table 51 Asia Pacific: Miticides Market Size, By Mode of Application, 2016�2023 (KT)
Table 52 Asia Pacific: Market Size, By Crop Type, 2016�2023 (USD Million)
Table 53 Asia Pacific: Market Size, By Crop Type, 2016�2023 (KT)
Table 54 Asia Pacific: Market Size, By Source, 2016�2023 (USD Million)
Table 55 Asia Pacific Market Size, By Source, 2016�2023 (KT)
Table 56 Asia Pacific: Miticides Market Size, By Form, 2016�2023 (USD Million)
Table 57 Asia Pacific: Market Size, By Form, 2016�2023 (KT)
Table 58 RoW: Miticides Market Size, By Region, 2016�2023 (USD Million)
Table 59 RoW: Market Size, By Mode of Application, 2016�2023 (USD Million)
Table 60 RoW: Market Size, By Mode of Application, 2016�2023 (KT)
Table 61 RoW: Market Size, By Crop Type, 2016�2023 (USD Million)
Table 62 RoW: Market Size, By Crop Type, 2016�2023 (KT)
Table 63 RoW: Market Size, By Source, 2016�2023 (USD Million)
Table 64 RoW: Miticides Market Size, By Source, 2016�2023 (KT)
Table 65 RoW: Market Size, By Form, 2016�2023 (USD Million)
Table 66 RoW: Market Size, By Form, 2016�2023 (KT)
Table 67 Miticides Market Ranking, 2017
Table 68 Expansions, 2016�2017
Table 69 Agreements, 2015�2017
Table 70 Mergers & Acquisitions, 2016�2017
Table 71 New Product Launches, 2013�2017
Table 72 Partnerships, Investments, and Collaborations, 2014�2017
List of Figures (46 Figures)
Figure 1 Miticides Market Segmentation
Figure 2 Regional Segmentation
Figure 3 Miticides: Research Design
Figure 4 Breakdown of Primary Interviews, By Company Type, Designation, and Region
Figure 5 Market Size Estimation Methodology: Bottom-Up Approach
Figure 6 Market Size Estimation Methodology: Top-Down Approach
Figure 7 Data Triangulation Methodology
Figure 8 Miticides Market Size, By Mode of Application, 2018 vs 2023 (USD Million)
Figure 9 Miticides Market Size, By Crop Type, 2018 vs 2023 (USD Million)
Figure 10 Miticides Market Size, By Source, 2018 vs 2023 (USD Million)
Figure 11 Miticides Market Share, By Region, 2017
Figure 12 Technological Innovations in Miticides to Drive the Market for Miticides
Figure 13 Market Size for Miticides, 2018 vs 2023 (KT)
Figure 14 Fruits & Vegetables Segment to Dominate the North American Miticides Market in 2018
Figure 15 India to Grow at the Highest CAGR From 2018 to 2023
Figure 16 Market Dynamics: Miticides Market
Figure 17 Growth of Organic Agricultural Land, 1999�2016
Figure 18 Supply Chain of Miticides Market
Figure 19 Fruits & Vegetables are Projected to Dominate for the Next Five Years (USD Million)
Figure 20 Foliar Spray Segment to Dominate the Miticides Market Through 2023
Figure 21 Liquid Segment to Dominate the Miticides Market Through 2023
Figure 22 Chemical Segment to Dominate the Miticides Market Through 2023
Figure 23 Geographic Snapshot (2018�2023): Rapidly Growing Markets are Emerging as New Hotspots
Figure 24 North America: Miticides Market Snapshot
Figure 25 Spain Held the Largest Share in the Miticides Market in Europe
Figure 26 China Held the Largest Share in the Miticides Market in Asia Pacific
Figure 27 Agreements & Expansions Were Preferred By Key Miticides Players in the Last Five Years
Figure 28 Expansions: the Key Growth Strategy, 2012� April, 2018
Figure 29 Annual Developments in the Miticides Market, 2012�2018
Figure 30 BASF: Company Snapshot
Figure 31 BASF: SWOT Analysis
Figure 32 Bayer AG: Company Snapshot
Figure 33 Bayer AG: SWOT Analysis
Figure 34 Syngenta AG: Company Snapshot
Figure 35 Syngenta: SWOT Analysis
Figure 36 Nihon Nohyaku Co., Ltd.: Company Snapshot
Figure 37 Nihon Nohyaku Co., Ltd.: SWOT Analysis
Figure 38 Gowan Company, LLC: SWOT Analysis
Figure 39 Dowdupont: Company Snapshot
Figure 40 Dowdupont: SWOT Analysis
Figure 41 ADAMA: Company Snapshot
Figure 42 ADAMA: SWOT Analysis
Figure 43 Platform Solutions: Company Snapshot
Figure 44 FMC Corporation: Company Snapshot
Figure 45 Nufarm Limited: Company Snapshot
Figure 46 Nissan Chemicals Industry: Company Snapshot


Growth opportunities and latent adjacency in Miticides Market