Modular Robotics Market by Robot Type (Articulated Modular Robots, SCARA Modular Robots and Collaborative Modular Robots), Industry (Automotive, Electrical and Electronic, Plastic, Rubber and Chemicals) and Geography - Global Forecast 2035


Modular Robotics Market Summary
The global Modular Robotics Market was valued at approximately USD 10.4 billion in 2025 and is projected to reach USD 34.8 billion by 2035, expanding at a CAGR of 12.8% during the forecast period. The market is experiencing strong growth due to increasing adoption of flexible automation systems across manufacturing, logistics, healthcare, defense, and consumer applications. Modular robotics systems provide scalability, adaptability, and cost efficiency, enabling organizations to reconfigure robotic platforms according to changing operational requirements.
The integration of artificial intelligence (AI), Internet of Things (IoT), machine learning, cloud-based robotics management, and advanced automation technologies is transforming the modular robotics landscape. Smart factories increasingly rely on modular robotic architectures to improve productivity, reduce downtime, and support customized production. Growing investments in Industry 4.0 initiatives, digital transformation programs, and autonomous systems are expected to further accelerate market expansion through 2035.
Key Market Trends & Insights
North America remains the leading regional market due to widespread adoption of industrial automation, strong robotics investments, and advanced manufacturing ecosystems.
Asia Pacific is the fastest-growing region, driven by rapid industrialization, expanding electronics production, and government-supported smart manufacturing initiatives.
Modular industrial robots represent the dominant segment because of their extensive use in assembly, material handling, welding, and packaging operations.
AI-enabled self-reconfigurable robots are emerging as a major technological trend, allowing robotic systems to adapt automatically to dynamic environments and production requirements.
Cloud-connected robotics platforms are improving operational efficiency by enabling remote monitoring, predictive maintenance, and real-time performance optimization.
Automation technologies combined with IoT sensors are significantly enhancing robot intelligence, productivity, and interoperability across industrial facilities.
Market Size & Forecast
-
Base year market size (2025): USD 10.4 billion
-
Forecast value by 2035: USD 34.8 billion
-
CAGR (2025–2035): 12.8%
-
Growth is supported by rising automation demand, AI integration, flexible manufacturing requirements, and Industry 4.0 deployment across industries
Modular Robotics Market Top 10 key takeaway
-
Modular robotics market is projected to reach USD 34.8 billion by 2035.
-
AI-powered robotics is becoming a primary growth catalyst.
-
Industrial manufacturing remains the largest end-use sector.
-
North America leads global market revenue.
-
Asia Pacific is witnessing the highest growth rate.
-
Self-reconfigurable robotic systems are gaining commercial adoption.
-
IoT-enabled robots are improving operational intelligence.
-
Logistics and warehouse automation are creating significant opportunities.
-
Cloud robotics platforms are enhancing scalability and efficiency.
-
Industry 4.0 investments continue to accelerate market expansion.
Product Insights
Modular industrial robots currently dominate the market due to their ability to perform a wide variety of manufacturing functions while maintaining flexibility and scalability. These robotic systems consist of interchangeable modules that can be reconfigured according to specific operational requirements. Manufacturers increasingly prefer modular robots because they reduce capital expenditures associated with complete system replacements while improving production adaptability.
The growing demand for customized manufacturing and shorter product lifecycles has further strengthened the position of modular industrial robots. Automotive manufacturers, electronics producers, and consumer goods companies are increasingly adopting modular robotic systems to support agile production environments.
Emerging product categories include collaborative modular robots (cobots), autonomous modular mobile robots, self-reconfigurable robots, and swarm robotics systems. These advanced robotic platforms leverage AI algorithms, computer vision, and machine learning capabilities to operate safely alongside human workers while continuously optimizing performance. The integration of edge computing and advanced sensor technologies is further enhancing the intelligence and responsiveness of modular robotic products.
Technology / Component Insights
The modular robotics market is driven by a combination of advanced hardware and software technologies. Core technologies include AI-driven control systems, machine vision, intelligent sensors, robotic actuators, edge computing platforms, cloud robotics infrastructure, and advanced communication networks.
Artificial intelligence has become a critical enabler for modular robotics systems. AI algorithms facilitate autonomous decision-making, predictive maintenance, path planning, object recognition, and adaptive task execution. Machine learning models continuously improve robot performance by analyzing operational data and identifying optimization opportunities.
IoT technologies enable seamless connectivity between robotic modules, manufacturing equipment, and enterprise management systems. Real-time data collection and analytics support enhanced monitoring, operational transparency, and process optimization. Cloud platforms further strengthen these capabilities by providing centralized control, software updates, and performance management across distributed robotic fleets.
Automation technologies such as digital twins, autonomous navigation systems, and advanced robotics simulation platforms are shaping the future of modular robotics. Emerging innovations include self-healing robotic architectures, decentralized robotic intelligence, and AI-powered robotic orchestration systems capable of managing large-scale automated operations with minimal human intervention.
Application Insights
Industrial manufacturing represents the largest application segment within the modular robotics market. Companies increasingly deploy modular robotic systems for assembly operations, welding, packaging, quality inspection, and material handling. The ability to rapidly reconfigure robotic cells makes modular systems particularly attractive for manufacturers facing fluctuating production demands.
Logistics and warehousing applications are experiencing substantial growth as e-commerce expansion drives demand for efficient fulfillment operations. Modular robots are increasingly used for sorting, picking, inventory management, and autonomous transportation within warehouses.
Healthcare is emerging as another promising application area. Hospitals and medical device manufacturers utilize modular robotic systems for surgical assistance, laboratory automation, pharmaceutical production, and medical logistics. Defense and aerospace sectors are also adopting modular robotics for surveillance, maintenance, and autonomous mission support.
Future opportunities are expected to arise from smart cities, agricultural automation, construction robotics, and service robotics applications, where flexible robotic architectures can deliver significant operational advantages.
Regional Insights
North America continues to dominate the modular robotics market due to strong technological innovation, significant automation investments, and widespread Industry 4.0 implementation. The presence of major robotics manufacturers, advanced research institutions, and supportive government initiatives contributes to regional leadership. The United States remains the primary contributor to regional revenue growth.
Europe maintains a significant market position driven by advanced manufacturing industries, strong automotive production, and increasing adoption of intelligent automation systems. Countries such as Germany and France continue to invest heavily in robotics research and industrial modernization programs.
Asia Pacific is projected to register the highest CAGR during the forecast period. Rapid industrialization, expanding electronics manufacturing, favorable government policies, and increasing labor cost pressures are accelerating robotic adoption throughout the region. China and Japan remain key contributors to regional market growth, while emerging economies continue expanding their automation capabilities.
-
North America remains the largest regional market.
-
Asia Pacific records the fastest growth through 2035.
-
Europe benefits from strong industrial automation adoption.
-
Government-backed smart manufacturing initiatives support expansion.
-
Electronics and automotive sectors drive regional demand.
Country-Specific Market Trends
China is expected to grow at a CAGR of approximately 14.2% through 2035, supported by large-scale investments in smart manufacturing, semiconductor production, and industrial automation. Government programs promoting robotics adoption continue to strengthen market growth.
Japan is projected to expand at a CAGR of 12.9%, driven by its advanced robotics ecosystem, aging workforce challenges, and emphasis on high-precision manufacturing. Companies increasingly deploy modular robotics to improve operational efficiency and productivity.
The United States remains the largest national market, growing at a CAGR of approximately 11.8%. AI integration, warehouse automation, and advanced manufacturing investments continue to drive adoption. Canada is witnessing steady growth through industrial modernization initiatives, while Mexico benefits from expanding automotive and electronics manufacturing activities.
Germany is forecast to grow at a CAGR of 11.2%, supported by Industry 4.0 leadership and strong automotive production capabilities. France is increasingly adopting modular robotics across aerospace, healthcare, and advanced manufacturing sectors.
-
China leads global production and deployment activities.
-
Japan remains a center for robotics innovation.
-
The United States dominates North American revenues.
-
Germany drives European industrial robotics adoption.
-
France is expanding robotics use across multiple industries.
Key Modular Robotics Market Company Insights
Major market participants are increasingly focused on developing intelligent, flexible, and AI-powered robotic solutions capable of addressing evolving customer requirements. Innovation strategies emphasize modular architectures, autonomous capabilities, advanced sensing technologies, and cloud-connected robotics ecosystems.
Leading companies include ABB Ltd., KUKA AG, Yaskawa Electric Corporation, FANUC Corporation, Universal Robots, Teradyne Inc., Mitsubishi Electric Corporation, and Omron Corporation.
These organizations continue to invest heavily in AI-enabled robotics platforms, collaborative robotics technologies, and software ecosystems designed to simplify deployment and improve operational efficiency. Strategic partnerships, acquisitions, and research collaborations remain important competitive strategies.
-
AI-powered robotics development is a key strategic focus.
-
Companies are expanding cloud robotics capabilities.
-
Collaborative robot portfolios continue to grow.
-
Strategic partnerships accelerate innovation and market expansion.
-
Investments in software-driven automation are increasing.
Recent Developments
In 2025, several leading robotics manufacturers introduced AI-enabled modular robotic platforms featuring autonomous reconfiguration capabilities for advanced manufacturing environments. These systems significantly improve flexibility and reduce production downtime.
A major robotics provider partnered with a cloud technology company to develop a next-generation robotics management platform integrating IoT connectivity, predictive analytics, and real-time performance optimization capabilities.
Several industrial automation firms launched collaborative modular robots equipped with advanced machine vision systems and AI-driven motion control technologies designed for electronics assembly and precision manufacturing applications.
Market Segmentation
The modular robotics market is segmented by product, technology, application, and region. By product, the market includes modular industrial robots, collaborative robots, mobile robots, self-reconfigurable robots, and swarm robotics systems. By technology and component, the market encompasses AI software, sensors, actuators, machine vision systems, cloud platforms, communication modules, and control systems.
Application segments include manufacturing, logistics and warehousing, healthcare, aerospace and defense, agriculture, construction, and consumer robotics. Regionally, the market is analyzed across North America, Europe, Asia Pacific, Latin America, and the Middle East & Africa. Increasing demand for intelligent automation solutions continues to drive growth across all market segments.
-
Modular industrial robots represent the largest product category.
-
AI and machine vision dominate technology investments.
-
Manufacturing remains the leading application segment.
-
Logistics and healthcare applications are growing rapidly.
-
Asia Pacific offers the strongest long-term growth opportunities.
The Modular Robotics Market is positioned for substantial growth through 2035 as organizations increasingly prioritize flexibility, automation, and intelligent manufacturing capabilities. Advances in artificial intelligence, IoT connectivity, cloud robotics, and autonomous systems are fundamentally transforming how robotic platforms are designed, deployed, and managed.
As businesses pursue digital transformation and Industry 4.0 objectives, modular robotics will become an essential component of future production environments. The market's projected expansion to USD 34.8 billion by 2035 highlights its strategic importance across manufacturing, logistics, healthcare, aerospace, and emerging industrial applications. Companies that invest in AI-enabled, scalable, and interoperable robotics solutions will be best positioned to capitalize on the evolving automation landscape.
 Exclusive indicates content/data unique to MarketsandMarkets and not available with any competitors.
Table of Contents
1 Introduction (Page No. - 16)
1.1 Study Objectives
1.2 Definition
1.3 Study Scope
1.3.1 Years Considered
1.4 Currency
1.5 Stakeholders
2 Research Methodology (Page No. - 19)
2.1 Research Data
2.1.1 Secondary Data
2.1.1.1 Secondary Sources
2.1.2 Primary Data
2.1.2.1 Key Data From Primary Sources
2.1.2.2 Breakdown of Primaries
2.1.3 Secondary and Primary Research
2.1.3.1 Key Industry Insights
2.2 Market Size Estimation
2.2.1 Bottom-Up Approach
2.2.2 Top-Down Approach
2.3 Market Breakdown and Data Triangulation
2.4 Research Assumptions and Limitations
2.4.1 Assumptions
2.4.2 Limitations
3 Executive Summary (Page No. - 27)
4 Premium Insights (Page No. - 30)
4.1 Attractive Opportunities in Modular Robotics Market
4.2 Market, By Robot Type
4.3 Market, By Industry
4.4 Market in APAC, Country vs Industry
4.5 Market, By Country
5 Market Overview (Page No. - 33)
5.1 Introduction
5.2 Market Dynamics: Overview
5.2.1 Drivers
5.2.1.1 Growing Investments in Industrial Automation
5.2.1.2 Increasing Adoption of Collaborative Modular Robots Owing to Their Benefits and Features
5.2.2 Restraints
5.2.2.1 Complexity of Modular Robots With Respect to Their Designs and Controlling Electronics
5.2.3 Opportunities
5.2.3.1 Rising Adoption of Robotics-As-A-Service Model
5.2.4 Challenges
5.2.4.1 Interoperability Issues and Difficulty in Integration of Different Robotic Frameworks Into Existing Facilities
5.2.4.2 Address the Need for Safe Handling of Industrial-Grade Operations
5.3 Value Chain Analysis
6 Architecture of Modular Robots (Page No. - 40)
6.1 Introduction
6.2 Chain Type
6.3 Lattice Type
6.4 Hybrid Type
7 Modular Robotics Market, By Robot Type (Page No. - 42)
7.1 Introduction
7.2 Articulated Modular Robots
7.2.1 Articulated Modular Robots to Hold Largest Share of Market By 2018
7.3 Cartesian Modular Robots
7.3.1 Cartesian Modular Robots to Hold Second-Largest Share of Market By 2018.
7.4 Scara Modular Robots
7.4.1 Best Price-To-Performance Ratio Offered By Scara Modular Robots for High-Speed Applications to Drive Market During Forecast Period
7.5 Parallel Modular Robots
7.5.1 High Adoption Rate for Pick-And-Place Applications in Food & Beverages Industry to Drive Market for Parallel Modular Robots
7.6 Collaborative Modular Robots
7.6.1 Ability to Work Safely Alongside Humans Expected to Fuel Growth of Market for Collaborative Modular Robots
7.7 Other Modular Robots
7.7.1 Spherical Robots
7.7.1.1 Ability to Optimally Perform Tasks Involving Low-Weight Payloads Drives Market for Spherical Modular Robots
7.7.2 Cylindrical Robots
7.7.2.1 Adoption of Cylindrical Modular Robots in Manufacturing Industries for Welding Applications is Key Factor Driving Factor
8 Modular Robotics Market, By Industry (Page No. - 53)
8.1 Introduction
8.2 Automotive
8.2.1 Adoption of Modular Robots for Automatizing Assembly Lines is Key Factor Driving Growth of Market for Automotive Industry
8.3 Electrical and Electronics
8.3.1 Ability of Modular Robotics Systems to Enable Efficient Automation and Systematic Manufacturing Processes to Boost Their Adoption in Electrical and Electronics Industry
8.4 Plastics, Rubber, and Chemicals
8.4.1 Capability to Handle Hazardous Explosive Substances Boosts Adoption of Modular Robots in Plastics, Rubber, and Chemicals Industry
8.5 Metals and Machinery
8.5.1 High Rate of Adoption of Modular Robots for Applications Such as Welding and Pick-And-Place to Drive Market for Metals and Machinery Industry
8.6 Food & Beverages
8.6.1 Adoption of Parallel Modular Robots for Pick-And-Place Application is Key Trend Observed in Food & Beverages Industry
8.7 Precision Engineering and Optics
8.7.1 Adoption of Modular Robotics System for Error-Proofing Processes in Precision Engineering and Optics Industry to Fuel Growth of Modular Robotics Market During Forecast Period
8.8 Pharmaceuticals and Cosmetics
8.8.1 Use of Modular Robots in Pharmaceuticals and Cosmetics Industries to Handle Hazardous Biologicals and Radioactive Substances to Drive Growth of Market
8.9 Others
8.9.1 Adoption of Modular Robots in Other Industries to Perform Tasks Such as Material Removal Increasing Adoption of Modular Robotic Systems in Industries Such as Wood and Glass to Fuel Growth of Market for Other Industries
9 Geographic Analysis (Page No. - 85)
9.1 Introduction
9.2 North America
9.2.1 Us
9.2.1.1 US Held Largest Share of Modular Robotics Market in 2017
9.2.2 Canada
9.2.2.1 Increasing Adoption of Modular Robots in Electrical and Electronics Industry to Drive Market in Canada During Forecast Period
9.2.3 Mexico
9.2.3.1 Increasing Adoption of Modular Robotic Systems in Automotive Industry to Fuel Growth of Market in Mexico
9.3 Europe
9.3.1 Germany
9.3.1.1 Automotive Industry Was Largest Contributor to Market in Germany in 2017
9.3.2 France
9.3.2.1 Adoption of Modular Robotics Systems in Electrical and Electronics Industry to Automate Integration Process to Fuel Growth of Market in France
9.3.3 Uk
9.3.3.1 Food & Beverages Industry to Drive Market in the UK During Forecast Period
9.3.4 Italy
9.3.4.1 High Rate of Adoption of Modular Robots for Applications Such as Welding, Pick and Place, and Packing is Key Driver for Market in Italy
9.3.5 Spain
9.3.5.1 Increasing Adoption of Modular Robotic Systems for Applications Such as Handling and Painting Drives Market in Spain
9.3.6 Rest of Europe
9.3.6.1 Shortage of Skilled Labors is Key Factor Driving Market in Rest of European Countries
9.4 APAC
9.4.1 China
9.4.1.1 Automotive Industry Held Largest Share of Modular Robotics Market in China in 2017
9.4.2 Japan
9.4.2.1 Various Government Polices Promoting Utilization of Robots in Various Industries Fuel Implementation of Modular Robotics in Japan
9.4.3 South Korea
9.4.3.1 Increasing Adoption of Modular Robotic Systems in Electrical and Electronics Industry to Contribute to Growth of Market in South Korea
9.4.4 India
9.4.4.1 Rising Labor Cost is Key Factor Driving Growth of Market in India
9.4.5 Rest of APAC
9.4.5.1 Increasing Penetration Rate of Modular Robotic Systems in Automotive Industry to Drive Market in Rest of APAC
9.5 RoW
9.5.1 South America
9.5.1.1 Increasing Focus on Manufacturing By Global Players is Key Factor Driving Market in South America
9.5.2 Middle East and Africa
9.5.2.1 Rising Adoption of Automation Services is Leading to Steady Growth of Market in Middle East and Africa
10 Competitive Landscape (Page No. - 97)
10.1 Introduction
10.2 Modular Robotics Market Ranking Analysis, 2017
10.3 Competitive Situations and Trends
10.3.1 Product Launches
10.3.2 Partnerships and Collaborations
10.3.3 Expansions
10.3.4 Contracts and Agreements
10.3.5 Acquisitions
11 Company Profiles (Page No. - 103)
(Business Overview, Products Offered, Recent Developments, SWOT Analysis, and MnM View)*
11.1 Key Players
11.1.1 ABB
11.1.2 Fanuc
11.1.3 Kuka
11.1.4 Yaskawa
11.1.5 Kawasaki Heavy Industries
11.1.6 Mitsubishi Electric
11.1.7 Denso
11.1.8 Nachi-Fujikoshi
11.1.9 Universal Robots A/S
11.1.10 Rethink Robotics
11.2 Other Key Players
11.2.1 Stäubli International
11.2.2 Daihen
11.2.3 Cma Robotics Spa
11.2.4 Yamaha Motor
11.2.5 Engel
11.2.6 Comau S.P.A
11.2.7 Aurotek
11.2.8 Toshiba Machine
11.2.9 Acmi Spa
11.2.10 Cassioli Srl
*Details on Business Overview, Products Offered, Recent Developments, SWOT Analysis, and MnM View Might Not Be Captured in Case of Unlisted Companies.
12 Appendix (Page No. - 133)
12.1 Discussion Guide
12.2 Knowledge Store: Marketsandmarkets’ Subscription Portal
12.3 Available Customizations
12.4 Related Reports
12.5 Author Details
List of Tables (68 Tables)
Table 1 Modular Robotics Market, By Robot Type, 2015–2023 (USD Million)
Table 2 Market, By Robot Type, 2015–2023 (Units)
Table 3 Market for Articulated Modular Robots, By Industry, 2015–2023 (USD Million)
Table 4 Market for Cartesian Modular Robots, By Industry, 2015–2023 (USD Million)
Table 5 Market for Scara Modular Robots, By Industry, 2015–2023 (USD Million)
Table 6 Market for Parallel Modular Robots, By Industry, 2015–2023 (USD Million)
Table 7 Market for Collaborative Modular Robots, By Industry, 2015–2023 (USD Million)
Table 8 Market for Other Modular Robots, By Industry, 2015–2023 (USD Million)
Table 9 Market, By Industry, 2015–2023 (USD Million)
Table 10 Market for Automotive, By Region, 2015–2023 (USD Million)
Table 11 Market for Automotive in North America, By Country, 2015–2023 (USD Million)
Table 12 Market for Automotive in Europe, By Country, 2015–2023 (USD Million)
Table 13 Market for Automotive in APAC, By Country, 2015–2023 (USD Million)
Table 14 Market for Automotive in RoW, By Region, 2015–2023 (USD Million)
Table 15 Market for Automotive, By Robot Type, 2015–2023 (USD Million)
Table 16 Market for Electrical and Electronics in North America, By Country, 2015–2023 (USD Million)
Table 17 Market for Electrical and Electronics, By Region, 2015–2023 (USD Million)
Table 18 Market for Electrical and Electronics in Europe, By Country, 2015–2023 (USD Million)
Table 19 Market for Electrical and Electronics Industry in APAC, By Country, 2015–2023 (USD Million)
Table 20 Market for Electrical and Electronics in RoW, By Region, 2015–2023 (USD Million)
Table 21 Market for Electrical and Electronics, By Robot Type, 2015–2023 (USD Million)
Table 22 Market for Plastics, Rubber, and Chemicals, By Region, 2015–2023 (USD Million)
Table 23 Market for Plastics, Rubber, and Chemicals Industries in North America, By Country, 2015–2023 (USD Million)
Table 24 Market for Plastics, Rubber, and Chemicals in Europe, By Country, 2015–2023 (USD Million)
Table 25 Market for Plastics, Rubber, and Chemicals in APAC, By Country, 2015–2023 (USD Million)
Table 26 Market for Plastics, Rubber, and Chemicals in RoW, By Region, 2015–2023 (USD Million)
Table 27 Market for Plastics, Rubber, and Chemicals, By Robot Type, 2015–2023 (USD Million)
Table 28 Market for Metals and Machinery, By Region, 2015–2023 (USD Million)
Table 29 Market for Metals and Machinery in North America, By Country, 2015–2023 (USD Million)
Table 30 Market for Metals and Machinery in Europe, By Country, 2015–2023 (USD Million)
Table 31 Market for Metals and Machinery in APAC, By Country, 2015–2023 (USD Million)
Table 32 Market for Metals and Machinery in RoW, By Region, 2015–2023 (USD Million)
Table 33 Market for Metal and Machinery, By Rob0t Type, 2015–2023 (USD Million)
Table 34 Market for Food & Beverages, By Region, 2015–2023 (USD Million)
Table 35 Market for Food & Beverages in North America, By Country, 2015–2023 (USD Million)
Table 36 Market for Food & Beverages in Europe, By Country, 2015–2023 (USD Million)
Table 37 Market for Food & Beverages in APAC, By Country, 2015–2023 (USD Million)
Table 38 Market for Food & Beverages in RoW, By Region, 2015–2023 (USD Million)
Table 39 Market for Food & Beverages, By Robot Type, 2015–2023 (Million)
Table 40 Market for Precision Engineering and Optics, By Region, 2015–2023 (USD Million)
Table 41 Market for Precision Engineering and Optics in North America, By Country, 2015–2023 (USD Million)
Table 42 Market for Precision Engineering and Optics in Europe, By Country, 2015–2023 (USD Million)
Table 43 Market for Precision Engineering and Optics in APAC, By Country, 2015–2023 (USD Million)
Table 44 Market for Precision Engineering and Optics in RoW, By Region, 2015–2023 (USD Million)
Table 45 Market for Precision Engineering and Optics Industry, By Robot Type, 2015–2023 (Million)
Table 46 Market for Pharmaceuticals and Cosmetics, By Region, 2015–2023 (USD Million)
Table 47 Market for Pharmaceuticals and Cosmetics in North America, By Country, 2015–2023 (USD Million)
Table 48 Market for Pharmaceuticals and Cosmetics in Europe, By Country, 2015–2023 (Million)
Table 49 Market for Pharmaceuticals and Cosmetics in APAC, By Country, 2015–2023 (USD Million)
Table 50 Market for Pharmaceuticals and Cosmetics in RoW, By Region, 2015–2023 (USD Million)
Table 51 Market for Pharmaceuticals and Cosmetics, By Robot Type, 2015–2023 (USD Million)
Table 52 Market for Others, By Region, 2015–2023 (USD Million)
Table 53 Market for Others in North America, By Country, 2015–2023 (USD Million)
Table 54 Market for Others in Europe, By Country, 2015–2023 (USD Million)
Table 55 Market for Others in APAC, By Country, 2015–2023 (USD Million)
Table 56 Market for Others in RoW, By Region, 2015–2023 (USD Million)
Table 57 Market for Others, By Robot Type, 2015–2023 (USD Million)
Table 58 Market, By Region, 2015–2023 (USD Million)
Table 59 Market in North America, By Country, 2015–2023 (USD Million)
Table 60 Market in Europe, By Country, 2015–2023 (USD Million)
Table 61 Market in APAC, By Country, 2015–2023 (USD Million)
Table 62 Market in RoW, By Region, 2015–2023 (USD Milllion)
Table 63 Market Ranking, 2017
Table 64 Product Launches, 2015–2017
Table 65 Partnerships and Collaborations, 2015–2017
Table 66 Expansions, 2015–2017
Table 67 Contracts and Agreements, 2015–2017
Table 68 Acquisitions, 2015–2017
List of Figures (45 Figures)
Figure 1 Segmentation of Modular Robotics Market
Figure 2 Market: Research Design
Figure 3 Market: Bottom-Up Approach
Figure 4 Market: Top-Down Approach
Figure 5 Data Triangulation
Figure 6 Articulated Modular Robots to Hold Largest Share of Market Based on Robot Type By 2018
Figure 7 Automotive Industry to Hold Largest Share of Market By 2018
Figure 8 APAC to Hold Largest Share of Market By 2018
Figure 9 Growing Investments for Automation in Industries Drives Growth of Market
Figure 10 Articulated Modular Robots to Hold Largest Size of Market By 2018
Figure 11 Automotive Industry to Hold Largest Share of Market By 2018
Figure 12 China to Hold Largest Share of Market in APAC By 2018
Figure 13 China to Hold Largest Share of Market From 2018–2023
Figure 14 Growing Investments in Industrial Automation Drives Market
Figure 15 Modular Robotic Value Chain Analysis: Maximum Value Added During R&D Stage
Figure 16 Diagrammatic Representation of Chain Type Modular Robots
Figure 17 Diagrammatic Representation of Lattice Type Modular Robots
Figure 18 Market for Collaborative Robots to Grow at Highest CAGR During Forecast Period
Figure 19 Automotive to Hold Largest Share of Market for Articulated Modular Robots By 2018
Figure 20 Electrical & Electronics to Hold Largest Size of Market for Scara Modular Robots By 2023
Figure 21 Automotive Industry to Hold Largest Share of Market for Collaborative Modular Robots By 2023
Figure 22 Market for Metals & Machinery to Grow at Highest CAGR During Forecast Period
Figure 23 Modular Robotics Market for Automotive in APAC to Grow at Highest CAGR During Forecast Period
Figure 24 US to Hold Largest Size of Market for Electrical and Electronics in North America By 2018
Figure 25 China to Hold Largest Size of Market for Plastics, Rubber, and Chemicals in APAC in 2018
Figure 26 APAC to Hold Largest Size of Market for Metals and Machinery in 2023
Figure 27 Germany to Hold Largest Size of Market for Food and Beverages in 2018
Figure 28 Market for Precision Engineering and Optics in APAC to Grow at Highest CAGR During Forecast Period
Figure 29 Market for Pharmaceuticals and Cosmetics in Mexico to Grow at Highest CAGR During Forecast Period
Figure 30 US to Hold Largest Size of Market for Others During Forecast Period
Figure 31 Market in APAC to Grow at Significant CAGR During Forecast Period
Figure 32 North America: Market Snapshot
Figure 33 Europe: Market Snapshot
Figure 34 APAC: Market Snapshot
Figure 35 Market in South America to Grow at Higher CAGR During Forecast Period
Figure 36 Players in Market Adopted Product Launches as Their Key Growth Strategy From 2015 to 2017
Figure 37 Product Launches, Partnerships, and Collaborations as Key Business Strategies Adopted By Market Players During 2015–2017
Figure 38 ABB: Company Snapshot
Figure 39 Fanuc: Company Snapshot
Figure 40 Kuka: Company Snapshot
Figure 41 Yaskawa: Company Snapshot
Figure 42 Kawasaki Heavy Industries: Company Snapshot
Figure 43 Mitsubishi Electric: Company Snapshot
Figure 44 Denso: Company Snapshot
Figure 45 Nachi-Fujikoshi: Company Snapshot
The study involved four major activities in estimating the current size of the modular robotics market. Exhaustive secondary research was done to collect information on the market, peer market, and parent market. The next step was to validate these findings, assumptions, and sizing with industry experts across the value chain through primary research. Both top-down and bottom-up approaches were employed to estimate the complete market size. After that, market breakdown and data triangulation methods were used to estimate the market size of segments and subsegments.
Secondary Research
The research methodology used to estimate and forecast the modular robotics market begins with capturing data on revenue of key vendors in the market through secondary research. This study incorporates the use of extensive secondary sources, directories, and databases, such as Hoovers, Bloomberg Businessweek, Factiva, and OneSource to identify and collect information useful for the technical, market-oriented, and commercial study of the market. Vendor offerings have also been considered to determine the market segmentation. This entire research methodology includes the study of annual and financial reports of top players, presentations, press releases, journals, paid databases, trade directories, regulatory bodies, and safety standard organizations.
Primary Research
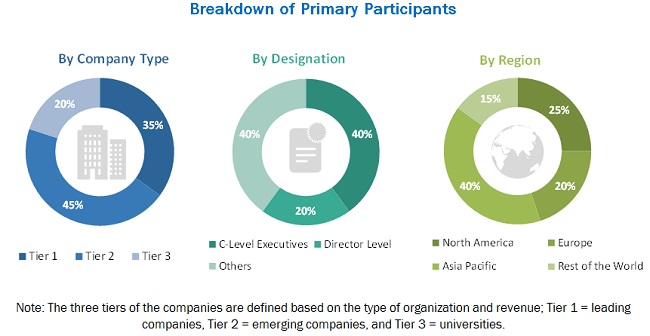
The modular robotics market comprises several stakeholders, such as suppliers of raw material and manufacturing equipment; standard components, original equipment manufacturers (OEMs); original device manufacturers (ODMs) of modular robotics; solutions providers; vendors of assembly, testing, and packaging solutions; and system integrators in the supply chain. Various primary sources from both the supply and demand sides of the market were interviewed to obtain qualitative and quantitative information. Following is the breakdown of primary respondents.
To know about the assumptions considered for the study, download the pdf brochure
Market Size Estimation
Both top-down and bottom-up approaches have been used to estimate and validate the total size of the modular robotics market. These methods have also been used extensively to estimate the size of various market subsegments. The research methodology used to estimate the market size includes the following:
- Key players in major application areas and markets were identified through extensive secondary research.
- The industry’s supply chain and market size, in terms of value, were determined through primary and secondary research processes.
- All percentage shares, splits, and breakdowns were determined using secondary sources and verified through primary sources.
Data Triangulation
After arriving at the overall market size—using the estimation processes as explained above—the market was split into several segments and subsegments. To complete the overall market engineering process and arrive at the exact statistics of each market segment and subsegment, data triangulation, and market breakdown procedures were employed, wherever applicable. The data have been triangulated by studying various factors and trends from both the demand and supply sides. The market has also been validated using both top-down and bottom-up approaches.
Research Objective
- To define, describe, and forecast the overall modular robotics market, in terms of value, segmented based on robot type, industry, and geography
- To forecast the market size for various segments with regard to 4 regions—North America, Europe, Asia Pacific (APAC), and Rest of the World (RoW)
- To forecast the market based on robot type in terms of volume
- To provide qualitative information regarding various architectures of modular robotic systems
- To provide detailed information regarding the major factors (drivers, restraints, opportunities, and challenges) influencing the growth of the market
- To provide a detailed overview of modular robotics value chain
- To strategically analyze the micromarkets with respect to individual growth trends, prospects, and contribution to the overall market
- To analyze opportunities in the market for stakeholders by identifying the high-growth segments
- To strategically profile key players, comprehensively analyze their market rankings and core competencies, and detail the competitive landscape for market leaders
- To analyze competitive developments such as product launches and development; contracts and agreement; partnerships and collaboration; and acquisition in the overall modular robotics market
Available Customizations
With the given market data, MarketsandMarkets offers customizations according to the company’s specific needs. The following customization options are available for the report:
Market size for 2019 and 2021 for segments such as robot type, and vertical, geography.
Company Information
- Detailed analysis and profiling of additional market players (up to 5)
Critical questions would be;
- The modular robotics ecosystem faces the major challenge regarding the interoperability and integration with existing platforms. When will this scenario ease out?
- What are the approaches followed by the industry players to address this challenge?


Growth opportunities and latent adjacency in Modular Robotics Market
Why the modular robots emerging? People won't buy the modular robotic joints/gear, reconfigure their own robot at all. Robot is a robotic system. What's the potential of modular robotic joint/gear?