SCARA Robot Market by Payload Capacity (Up to 5.00 kg, 5.01�15.00 kg), Application (Handling and Assembling & Disassembling), Industry (Automotive, Electrical & Electronics, Metals & Machinery, Food & Beverages), and Geography - Global Forecast 2025-2035


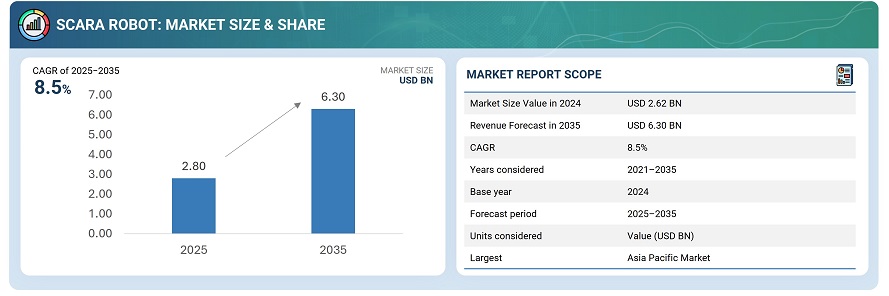
The global SCARA robot market was valued at USD 2.62 billion in 2024 and is estimated to reach USD 6.30 billion by 2035, at a CAGR of 8.5% between 2025 and 2035.
The SCARA robot market is being driven by rising demand for high-speed, precise, and cost-efficient automation in electronics, automotive, and semiconductor manufacturing. Increasing adoption of flexible assembly lines, miniaturization of components, and growing use in material handling and pick-and-place operations are key growth factors. Additionally, the push toward Industry 4.0 and labor cost optimization is further accelerating SCARA robot deployment across industries.

SCARA (Selective Compliance Assembly Robot Arm) robots are industrial robots designed for high-speed, precision tasks such as assembly, packaging, and material handling. They feature a rigid vertical axis and flexible horizontal movement, allowing fast and accurate operations within a limited workspace. Their compact design and repeatability make them ideal for electronics, automotive, and consumer goods manufacturing.
Market by Application
Handling
Processing applications are expected remain the fastest-growing segments in the SCARA robot market due to increasing adoption in precision tasks such as soldering, dispensing, screwing, and assembly. The growing demand for compact, high-speed, and accurate robots in electronics and semiconductor manufacturing drives this growth. SCARA robots’ ability to deliver consistent quality, handle delicate components, and integrate seamlessly with automated production lines further boosts their adoption in processing applications.
Processing
Handling applications will hold the largest market share in the global SCARA robot market due to their widespread use in material transfer, pick-and-place, packaging, and loading/unloading operations. SCARA robots offer high-speed, precise, and repeatable motion, making them ideal for handling small to medium components in electronics, automotive, and consumer goods industries. Their ability to improve productivity, reduce labor costs, and maintain consistency further strengthens their dominance in handling applications.
Market by Industry
Electrical & Electronics
The electrical and electronics industry will dominate the global SCARA robot market as manufacturers increasingly adopt automation for assembling PCBs, semiconductor wafers, connectors, and microcomponents. SCARA robots excel in precision-driven tasks like soldering, inspection, and component placement, ensuring high throughput and product quality. With growing demand for compact devices, wearables, and consumer electronics, these robots enable faster, more accurate, and cost-efficient production across electronics manufacturing environments.
Precision Engineering & Optics
The precision engineering and optics is expected to grow rapidly in the SCARA robot market due to rising demand for accurate assembly and handling of miniature optical and mechanical components. SCARA robots offer exceptional repeatability, vibration control, and cleanroom compatibility which is essential for lens alignment, optical device assembly, and micromechanical operations. As optical instruments, cameras, and photonic devices become more complex, manufacturers increasingly rely on SCARA robots for consistent precision and high productivity.
Market by Geography
Geographically, the SCARA robot market is experiencing widespread adoption across North America, Europe, Asia Pacific, and the Middle East & Africa. Asia Pacific leads the market, due to its strong manufacturing base, rapid industrial automation, and dominance in electronics, automotive, and semiconductor production. Countries like Japan, China, South Korea, and Taiwan are key hubs for robotics innovation and deployment, supported by major manufacturers such as Yamaha, Epson, and Fanuc. The region’s expanding consumer electronics demand, government initiatives promoting smart manufacturing, and availability of cost-effective labor and production facilities further accelerate adoption. Additionally, increasing investment in Industry 4.0 technologies and growing preference for precision, speed, and flexibility in manufacturing solidify Asia-Pacific’s leadership in the global SCARA robot market.
Market Dynamics
Driver: demand for high-speed automation
SCARA robots are increasingly adopted in industries requiring rapid, precise, and repetitive operations, such as electronics, automotive, and consumer goods manufacturing. Their ability to perform pick-and-place, assembly, and material handling tasks with high speed and accuracy improves production efficiency, reduces human error, and supports compact production lines. The growing focus on productivity and automation in modern manufacturing is a major factor driving SCARA robot market growth globally.
Restraint: High initial investment
Implementing SCARA robots involves substantial upfront costs, including the robot itself, peripheral equipment, and integration with existing production lines. Small and medium enterprises often find these costs prohibitive, limiting market penetration. Additionally, customization, software, and training add to total investment. High capital expenditure can delay adoption, especially in developing regions, and may discourage companies from replacing manual processes despite the long-term efficiency benefits offered by SCARA robots.
Opportunity: Expansion in emerging markets
Rapid industrialization in Asia-Pacific, Latin America, and parts of Eastern Europe offers strong growth potential for SCARA robots. Increasing electronics, automotive, and consumer goods manufacturing drives demand for automation solutions. Manufacturers are looking to reduce labor costs, improve precision, and accelerate production, making SCARA robots attractive. Strategic partnerships, local assembly facilities, and targeted marketing in these emerging regions can help companies capture new market share and expand their global footprint.
Challenge: Competition from alternative robots
Delta robots, articulated robots, and collaborative robots offer overlapping capabilities with SCARA robots, such as high-speed handling or flexible assembly. Industries may choose alternatives based on workspace, payload, or precision requirements, limiting SCARA adoption. Continuous innovation and differentiation are necessary to maintain market share. Manufacturers must balance cost, performance, and application suitability to remain competitive against other industrial robot types increasingly integrated into modern production lines.
Future Outlook
Between 2025 and 2031, the SCARA robot market is expected to grow rapidly as industries increasingly adopt automation for precision assembly, material handling, and high-speed manufacturing. Advances in AI-driven control systems, machine vision, and collaborative robotics will enable SCARA robots to perform complex tasks with higher accuracy and flexibility, integrating seamlessly into smart factories. Rising demand in electronics, automotive, and consumer goods manufacturing, coupled with Industry 4.0 initiatives and cost-efficiency goals, will drive widespread adoption.
Key Market Players
Top SCARA robot companies are Seiko Epson Corporation (Japan), Yamaha Motor Co., Ltd. (Japan), YASKAWA ELECTRIC CORPORATION. (Japan), DENSO CORPORATION. (Japan), and Stäubli International AG. (Switzerland).
Key Questions addressed in this report:
- What are the global trends in demand for the market?
- What are the upcoming technologies/product areas that will have a significant impact on the market in the future?
- What will be the revenue pockets for the market players in the next 6 years?
- What are the prime strategies followed by key players in the market?
 Exclusive indicates content/data unique to MarketsandMarkets and not available with any competitors.
Table of Contents
1 Introduction (Page No. - 18)
1.1 Study Objectives
1.2 Definition and Scope
1.2.1 Inclusions and Exclusions
1.3 Study Scope
1.3.1 Years Considered
1.4 Currency
1.5 Stakeholders
2 Research Methodology (Page No. - 21)
2.1 Research Data
2.1.1 Secondary Data
2.1.1.1 Major Secondary Sources
2.1.1.2 Key Data From Secondary Sources
2.1.2 Primary Data
2.1.2.1 Key Data From Primary Sources
2.1.2.2 Breakdown of Primaries
2.1.3 Secondary and Primary Research
2.1.3.1 Key Industry Insights
2.2 Market Size Estimation
2.2.1 Bottom-Up Approach
2.2.2 Top-Down Approach
2.2.3 Market Projections
2.3 Market Breakdown and Data Triangulation
2.4 Research Assumptions and Limitations
2.4.1 Assumptions
2.4.2 Limitations
3 Executive Summary (Page No. - 31)
4 Premium Insights (Page No. - 35)
4.1 Attractive Market Opportunities in SCARA Robot Market
4.2 Market, By Payload Capacity
4.3 Market, By Application
4.4 Market in Europe, By Industry vs By Country
4.5 Market, By Industry
4.6 Market, By Country
5 Market Overview (Page No. - 39)
5.1 Introduction
5.2 Market Dynamics
5.2.1 Drivers
5.2.1.1 Growing Need to Reduce Human Efforts and Errors in Production Process
5.2.1.2 Increasing Adoption of SCARA Robots in Electronics Sector
5.2.2 Restraints
5.2.2.1 High Overall Installation Cost for Low Volume Production
5.2.3 Opportunities
5.2.3.1 Rising Labor Costs in Developing Countries
5.2.3.2 Growing Integration of SCARA Robots With AI and IoT Technologies
5.2.4 Challenges
5.2.4.1 Increasing Demand for Collaborative Robots
5.2.4.2 Interoperability and Integration Issues With SCARA Robots
5.3 Value Chain Analysis
6 SCARA Robot Market, By Payload Capacity (Page No. - 48)
6.1 Introduction
6.2 Up to 5.00 kg
6.2.1 SCARA Robots With Payload Capacity of Up to 5.00 kg Accounted for Largest Share in 2018
6.3 5.01–15.00 kg
6.3.1 Market for SCARA Robots With Payload Capacity Ranging 5.01–15.00 kg to Grow at Highest CAGR During Forecast Period
6.4 More Than 15.00 kg SCARA Robots With Payload Carrying Capacity of More Than 15.00 kg Mainly Adopted in Automotive, and Metals and Machinery Industries
7 SCARA Robot Market, By Application (Page No. - 64)
7.1 Introduction
7.2 Handling
7.2.1 Handling Application Held Largest Share of Market in 2018
7.3 Assembling and Disassembling
7.3.1 SCARA Robots are Mainly Used for Small Products During Assembling and Disassembling Applications
7.4 Welding and Soldering
7.4.1 Welding and Soldering Application of SCARA Robots is Ideal for Small-Volume Production
7.5 Processing
7.5.1 Market for Processing Applications to Grow at Highest CAGR During Forecast Period
7.6 Dispensing
7.6.1 SCARA Robots Provide Maximum Flexibility for Complex Dispensing Applications Such as Painting and Gluing
7.7 Others
8 SCARA Robot Market, By Industry (Page No. - 83)
8.1 Introduction
8.2 Electrical & Electronics
8.2.1 Electrical & Electronics Industry Accounted for Largest Share of Market in 2018
8.3 Automotive
8.3.1 SCARA Robots are Mainly Used for Assembling & Disassembling Applications in Automotive Industry
8.4 Metals & Machinery
8.4.1 SCARA Robots are Used for Material Handling, Assembly, and Dispensing Applications in Metals & Machinery Industry
8.5 Plastics, Rubbers, and Chemicals
8.5.1 SCARA Robots are Used for Handling Hazardous Explosive Substances in Chemicals Industry
8.6 Precision Engineering and Optics
8.6.1 Precision Engineering and Optics Industry to Witness Highest CAGR During Forecast Period
8.7 Food & Beverages
8.7.1 SCARA Robots are Used for Wide Range of Handling Processes
8.8 Pharmaceuticals & Cosmetics
8.8.1 SCARA Robots are Used for Assembling and Packaging Medical Devices and Implants, and Custom Prescription Filling
8.9 Others
9 Geographic Analysis (Page No. - 108)
9.1 Introduction
9.2 North America
9.2.1 US
9.2.1.1 US Held Largest Share of Market in 2018
9.2.2 Mexico
9.2.2.1 Market in Mexico to Witness Highest CAGR During Forecast Period
9.2.3 Canada
9.2.3.1 Canada to Witness Accelerated Demand for SCARA Robots Due to Continuous Investments By Automotive Players in Industrial Automation
9.3 Europe
9.3.1 Germany
9.3.1.1 Germany Accounted for Largest Share of European Market in 2018
9.3.2 Italy
9.3.2.1 Demand for SCARA Robots in Electrical & Electronics and Automotive Industries in Italy to Grow During Forecast Period
9.3.3 Spain
9.3.3.1 Rising Awareness About Benefits of SCARA Robots to Increase Their Demand in Spain
9.3.4 France
9.3.4.1 France to Witness Highest CAGR in European Market During Forecast Period
9.3.5 UK
9.3.5.1 Increase in Government Funding for Research on Artificial Intelligence and Robotics to Strengthen Market in Uk
9.3.6 Rest of Europe (RoE)
9.4 APAC
9.4.1 China
9.4.1.1 China Held Largest Share of Market in APAC in 2018
9.4.2 Japan
9.4.2.1 Development and Production of Electric Cars By Japanese Automotive Manufacturers to Propel Growth of Market in Japan
9.4.3 South Korea
9.4.3.1 Financial Support of South Korean Government to Develop SCARA Robots Likely to Propel Market Growth
9.4.4 Taiwan
9.4.4.1 Electrical & Electronics and Metals & Machining Industries in Taiwan to Drive Market for SCARA Robots
9.4.5 Thailand
9.4.5.1 Government Initiatives in Thailand to Boost Demand for SCARA Robots
9.4.6 India
9.4.6.1 Market in India to Grow at Highest CAGR in APAC During Forecast Period
9.4.7 Rest of APAC (RoAPAC)
9.5 RoW
9.5.1 Middle East and Africa
9.5.1.1 Middle East and Africa to Hold Larger Market in 2018
9.5.2 South America
9.5.2.1 Market in South America to Witness Higher CAGR During Forecast Period
10 Competitive Landscape (Page No. - 128)
10.1 Overview
10.2 Market Ranking Analysis: Market, 2018
10.3 Competitive Leadership Mapping
10.3.1 Visionary Leaders
10.3.2 Dynamic Differentiators
10.3.3 Innovators
10.3.4 Emerging Companies
10.3.5 Strength of Product Portfolio (25 Players)
10.3.6 Business Strategy Excellence (25 Players)
10.4 Competitive Situations and Trends
10.4.1 Expansions
10.4.2 Product Launches
10.4.3 Partnerships and Collaborations
10.4.4 Acquisitions
11 Company Profiles (Page No. - 140)
(Business Overview, Products Offered, Recent Developments, SWOT Analysis, and MnM View)*
11.1 Key Players
11.1.1 Seiko Epson
11.1.2 Yamaha Motor
11.1.3 Denso
11.1.4 Yaskawa
11.1.5 Stäubli
11.1.6 ABB
11.1.7 Mitsubishi Electric
11.1.8 Kawasaki Heavy Industries
11.1.9 Toshiba Machine
11.1.10 Comau
11.2 Right to Win
11.2.1 Seiko Epson
11.2.2 Yamaha Motor
11.2.3 Denso
11.2.4 Yaskawa
11.2.5 Stäubli
11.3 Other Players
11.3.1 Nachi-Fujikoshi
11.3.2 Kuka
11.3.3 Fanuc
11.3.4 Omron Adept
11.3.5 Durr
11.3.6 Hiwin Technologies
11.3.7 Janome
11.3.8 Hirata
11.3.9 Adtech
11.3.10 Delta Electronics
*Details on Business Overview, Products Offered, Recent Developments, SWOT Analysis, and MnM View Might Not Be Captured in Case of Unlisted Companies.
12 Appendix (Page No. - 178)
12.1 Discussion Guide
12.2 Knowledge Store: Marketsandmarkets’ Subscription Portal
12.3 Available Customizations
12.4 Related Reports
12.5 Author Details
List of Tables (118 Tables)
Table 1 Average Selling Prices for SCARA Robots With Different Payload Capacities as of 2019
Table 2 SCARA Robot Market (Excluding Prices of Peripherals, Software, and System Engineering), By Payload Capacity, 2016–2024 (USD Million)
Table 3 Market (Including Prices of Peripherals, Software, and System Engineering), By Payload Capacity, 2016–2024 (USD Million)
Table 4 Market, By Payload Capacity, 2016–2024 (Units)
Table 5 Major Companies Offering SCARA Robots With Payload Capacity of Up to 5.00 kg
Table 6 Market for Payload Capacity of Up to 5.00 kg, By Application, 2016–2024 (USD Million)
Table 7 Market for Up to 5.00 kg Payload, By Application, 2016–2024 (Units)
Table 8 Market for Payload Capacity of Up to 5.00 kg, By Region (USD Million)
Table 9 Market for Payload Capacity of Up to 5.00 kg, By Region (Units)
Table 10 Market for Payload Capacity of Up to 5.00 kg, By Industry (USD Million)
Table 11 Market for Payload Capacity of Up to 5.00 kg, By Industry (Units)
Table 12 Major Companies Offering SCARA Robots With Payload Capacity Ranging 5.01–15.00 kg
Table 13 Market for Payload Capacity Ranging 5.01–15.00 kg, By Application, 2016–2024 (USD Million)
Table 14 Market for Payload Capacity Ranging 5.01–15.00 kg, By Application, 2016–2024 (Units)
Table 15 Market for Payload Capacity Ranging 5.01–15.00 kg, By Region, 2016–2024 (USD Million)
Table 16 Market for Payload Capacity Ranging 5.01–15.00 kg, By Region, 2016–2024 (Units)
Table 17 Market for Payload Capacity Ranging 5.01–15.00 kg, By Industry, 2016–2024 (USD Million)
Table 18 Market for Payload Capacity Ranging 5.01–15.00 kg, By Industry, 2016–2024 (Units)
Table 19 Major Companies Offering SCARA Robots With Payload Capacity of More Than 15.00 kg
Table 20 Market for Payload Capacity of More Than 15.00 kg, By Application, 2016–2024 (USD Million)
Table 21 Market for Payload Capacity of More Than 15.00 kg, By Application, 2016–2024 (Units)
Table 22 Market for Payload Capacity of More Than 15.00 kg, By Region (USD Million)
Table 23 Market for Payload Capacity of More Than 15.00 kg, By Region, 2016–2024 (Units)
Table 24 Market for Payload Capacity of More Than 15.00 kg, By Industry, 2016–2024 (USD Million)
Table 25 Market for Payload Capacity of More Than 15.00 kg, By Industry, 2016–2024 (Units)
Table 26 Market, By Application, 2016–2024 (USD Million)
Table 27 Market, By Application, 2016–2024 (Units)
Table 28 Market for Handling Applications, By Payload Capacity, 2016–2024 (USD Million)
Table 29 Market for Handling Applications, By Payload Capacity, 2016–2024 (Units)
Table 30 Market for Handling Applications, By Industry, 2016–2024 (USD Million)
Table 31 Market for Handling Applications, By Industry, 2016–2024 (Units)
Table 32 Market for Handling Applications, By Region, 2016–2024 (USD Million)
Table 33 Market for Assembling and Disassembling Applications, By Payload Capacity, 2016–2024 (USD Million)
Table 34 Market for Assembling and Disassembling Applications, By Payload Capacity, 2016–2024 (Units)
Table 35 Market for Assembling and Disassembling Applications, By Industry, 2016–2024 (USD Million)
Table 36 Market for Assembling and Disassembling Applications, By Industry, 2016–2024 (Units)
Table 37 Market for Assembling and Disassembling Applications, By Region, 2016–2024 (USD Million)
Table 38 Market for Welding and Soldering Applications, By Payload Capacity, 2016–2024 (USD Million)
Table 39 Market for Welding and Soldering Applications, By Payload Capacity, 2016–2024 (Units)
Table 40 Market for Welding and Soldering Applications, By Industry, 2016–2024 (USD Million)
Table 41 Market for Welding and Soldering Applications, By Industry, 2016–2024 (Units)
Table 42 Market for Welding and Soldering Applications, By Region, 2016–2024 (USD Million)
Table 43 Market for Processing Applications, By Payload Capacity, 2016–2024 (USD Million)
Table 44 Market for Processing Applications, By Payload Capacity, 2016–2024 (Units)
Table 45 Market for Processing Applications, By Industry, 2016–2024 (USD Million)
Table 46 Market for Processing Applications, By Industry, 2016–2024 (Units)
Table 47 Market for Processing Applications, By Region, 2016–2024 (USD Million)
Table 48 Market for Dispensing Applications, By Payload Capacity, 2016–2024 (USD Million)
Table 49 Market for Dispensing Applications, By Payload Capacity, 2016–2024 (Units)
Table 50 Market for Dispensing Applications, By Industry, 2016–2024 (USD Million)
Table 51 SCARA Robot Market for Dispensing Applications, By Industry, 2016–2024 (Units)
Table 52 Market for Dispensing Applications, By Region, 2016–2024 (USD Million)
Table 53 Market for Other Applications, By Payload Capacity, 2016–2024 (USD Million)
Table 54 Market for Other Applications, By Payload Capacity, 2016–2024 (Units)
Table 55 Market for Other Applications, By Industry, 2016–2024 (USD Million)
Table 56 Market for Other Applications, By Industry, 2016–2024 (Units)
Table 57 Market for Other Applications, By Region, 2016–2024 (USD Million)
Table 58 Market, By Industry, 2016–2024 (USD Million)
Table 59 Market, By Industry, 2016–2024 (Units)
Table 60 Market for Electrical & Electronics, By Region, 2016–2024 (Units)
Table 61 Market for Electrical & Electronics, By Application, 2016–2024 (Units)
Table 62 Market for Electrical & Electronics, By Application, 2016–2024 (USD Million)
Table 63 Market for Electrical & Electronics, By Payload Capacity, 2016–2024 (Units)
Table 64 Market for Electrical & Electronics, By Payload Capacity, 2016–2024 (USD Million)
Table 65 Market for Automotive, By Region, 2016–2024 (Units)
Table 66 Market for Automotive, By Application, 2016–2024 (Units)
Table 67 Market for Automotive, By Application, 2016–2024 (USD Million)
Table 68 Market for Automotive, By Payload Capacity, 2016–2024 (Units)
Table 69 Market for Automotive, By Payload Capacity, 2016–2024 (USD Million)
Table 70 Market for Metals & Machinery, By Region, 2016–2024 (Units)
Table 71 Market for Metals & Machinery, By Application, 2016–2024 (Units)
Table 72 Market for Metals & Machinery, By Application, 2016–2024 (USD Million)
Table 73 Market for Metals & Machinery, By Payload Capacity, 2016–2024 (Units)
Table 74 Market for Metals & Machinery, By Payload Capacity, 2016–2024 (USD Million)
Table 75 SCARA Robot Market for Plastics, Rubbers, and Chemicals, By Region, 2016–2024 (Units)
Table 76 Market for Plastics, Rubbers, and Chemicals, By Application, 2016–2024 (Units)
Table 77 Market for Plastics, Rubbers, and Chemicals, By Application, 2016–2024 (USD Million)
Table 78 Market for Plastics, Rubbers, and Chemicals, By Payload Capacity, 2016–2024 (Units)
Table 79 Market for Plastics, Rubbers, and Chemicals, By Payload Capacity, 2016–2024 (USD Million)
Table 80 Market for Precision Engineering and Optics, By Region, 2016–2024 (Units)
Table 81 Market for Precision Engineering and Optics, By Application, 2016–2024 (Units)
Table 82 Market for Precision Engineering and Optics, By Application, 2016–2024 (USD Million)
Table 83 Market for Precision Engineering and Optics, By Payload Capacity, 2016–2024 (Units)
Table 84 Market for Precision Engineering and Optics, By Payload Capacity, 2016–2024 (USD Million)
Table 85 Market for Food & Beverages, By Region, 2016–2024 (Units)
Table 86 Market for Food & Beverages, By Application, 2016–2024 (Units)
Table 87 Market for Food & Beverages, By Application, 2016–2024 (USD Million)
Table 88 Market for Food & Beverages, By Payload Capacity, 2016–2024 (Units)
Table 89 Market for Food & Beverages, By Payload Capacity, 2016–2024 (USD Million)
Table 90 Market for Pharmaceuticals & Cosmetics, By Region, 2016–2024 (Units)
Table 91 Market for Pharmaceuticals & Cosmetics, By Application, 2016–2024 (Units)
Table 92 Market for Pharmaceuticals & Cosmetics, By Application, 2016–2024 (USD Million)
Table 93 Market for Pharmaceuticals & Cosmetics, By Payload Capacity, 2016–2024 (Units)
Table 94 Market for Pharmaceuticals & Cosmetics, By Payload Capacity, 2016–2024 (USD Million)
Table 95 Market for Other Industries, By Region, 2016–2024 (Units)
Table 96 Market for Other Industries, By Application, 2016–2024 (Units)
Table 97 Market for Other Industries, By Application, 2016–2024 (USD Million)
Table 98 SCARA Robot Market for Other Industries, By Payload Capacity, 2016–2024 (Units)
Table 99 Market for Other Industries, By Payload Capacity, 2016–2024 (USD Million)
Table 100 Market, By Region, 2016–2024 (USD Million)
Table 101 Market, By Region, 2016–2024 (Units)
Table 102 Market in North America, By Country, 2016–2024 (Units)
Table 103 Market in North America, By Industry, 2016–2024 (Units)
Table 104 Market in North America, By Application, 2016–2024 (Units)
Table 105 Market in Europe, By Country, 2016–2024 (Units)
Table 106 Market in Europe, By Industry, 2016–2024 (Units)
Table 107 Market in Europe, By Application, 2016–2024 (Units)
Table 108 SCARA Robots Market in APAC, By Country, 2016–2024 (Units)
Table 109 SCARA Robots Market in APAC, By Industry, 2016–2024 (Units)
Table 110 SCARA Robots Market in APAC, By Application, 2016–2024 (Units)
Table 111 Market in RoW, By Region, 2016–2024 (Units)
Table 112 SCARA Robots Market in RoW, By Industry, 2016–2024 (Units)
Table 113 Market in RoW, By Application, 2016–2024 (Units)
Table 114 Market Ranking, 2018
Table 115 Expansion, 2018
Table 116 Product Launch, 2017–2018
Table 117 Partnership and Collaboration, 2017–2018
Table 118 Acquisition, 2016–2018
List of Figures (45 Figures)
Figure 1 Segmentation of SCARA Robot Market
Figure 2 Market: Research Design
Figure 3 Market: Bottom-Up Approach
Figure 4 SCARA Robots Market: Top-Down Approach
Figure 5 Data Triangulation
Figure 6 Market for SCARA Robots With Payload Capacity Ranging 5.01–15.00 kg to Grow at Highest CAGR During Forecast Period
Figure 7 Handling Application to Hold Largest Share of Market By 2024
Figure 8 Precision Engineering and Optics Industry to Exhibit Highest CAGR in Market During Forecast Period
Figure 9 APAC to Hold Largest Share of Market By 2019
Figure 10 Increasing Adoption of SCARA Robots in Electronics Industry to Drive Growth of SCARA Robot Market During Forecast Period
Figure 11 Market for SCARA Robots With Payload Capacity Ranging 5.01–15.00 kg to Grow at Highest CAGR During Forecast Period
Figure 12 Handling Application to Hold Largest Share of SCARA Robots Market, in Terms of Volume, By 2019
Figure 13 Automotive Industry to Hold Largest Share of Market in Europe in 2019
Figure 14 Electrical & Electronics Industry to Hold Largest Share of Market in 2019
Figure 15 China to Hold Largest Share of Market in 2019
Figure 16 Impact of Drivers and Opportunities on Market
Figure 17 Impact of Challenges and Restraints on Market
Figure 18 Market for Electrical & Electronics to Grow at Significant CAGR During Forecast Period
Figure 19 Industrial Robotics Market for Collaborative Robots to Grow at Significant CAGR During Forecast Period
Figure 20 Value Chain Analysis of SCARA Robot Ecosystem: R&D and Manufacturing Phases Contribute Maximum Value
Figure 21 Market, in Terms of Value, for Payload Capacity Ranging 5.01–15.00 kg to Grow at Highest CAGR During Forecast Period
Figure 22 Processing Application to Witness Highest CAGR in Market for SCARA Robots With Payload Capacity Ranging 5.01–15.00 kg During Forecast Period
Figure 23 SCARA Robots Market for Processing Applications to Grow at Highest CAGR During Forecast Period
Figure 24 SCARA Robots With Payload Capacity Ranging 5.01–15 kg to Witness Highest CAGR in the Market for Welding and Soldering Applications During Forecast Period
Figure 25 Market for Processing Applications in Precision Engineering and Optics Industry to Grow at Highest CAGR During Forecast Period
Figure 26 Precision Engineering and Optics Industry to Witness Highest CAGR During Forecast Period
Figure 27 Market for SCARA Robots With Payload Capacity Ranging 5.01–15.00 kg in Metals & Machinery to Witness at Highest CAGR During Forecast Period
Figure 28 Market for SCARA Robots With Payload Capacity Ranging 5.01–15.00 kg in Food & Beverages to Grow at Highest CAGR During Forecast Period
Figure 29 SCARA Robot Market in Countries Such as France and India to Grow at Highest CAGR During Forecast Period
Figure 30 Europe to Witness Highest CAGR in SCARA Robot Market During Forecast Period
Figure 31 North America: Snapshot of Market
Figure 32 Europe: Snapshot of Market
Figure 33 APAC: Snapshot of Market
Figure 34 Middle East and Africa to Dominate Market During Forecast Period
Figure 35 Players in SCARA Robots Market Adopted Expansion as Their Key Strategy for Business Expansion From 2016 to 2018
Figure 36 Market (Global) Competitive Leadership Mapping, 2018
Figure 37 Market Witnessed A Significant Growth From 2016 to 2018
Figure 38 Seiko Epson: Company Snapshot
Figure 39 Yamaha Motor: Company Snapshot
Figure 40 Denso: Company Snapshot
Figure 41 Yaskawa: Company Snapshot
Figure 42 ABB: Company Snapshot
Figure 43 Mitsubishi Electric: Company Snapshot
Figure 44 Kawasaki Heavy Industries: Company Snapshot
Figure 45 Toshiba Machine: Company Snapshot
The study involved 4 major activities in estimating the current size of the SCARA robot market. Exhaustive secondary research has been done to collect information about the market, the peer market, and the parent market. Validating findings, assumptions, and sizing with industry experts across the value chain through primary research has been the next step. Both top-down and bottom-up approaches have been employed to estimate the complete market size. After that, market breakdown and data triangulation methods have been used to estimate the market size of segments and subsegments.
Secondary Research
The research methodology used to estimate and forecast the SCARA robot market begins with capturing data on revenues of the key vendors in the market through secondary research. This study incorporates the use of extensive secondary sources, directories, and databases such as Hoovers, Bloomberg Businessweek, Factiva, and OneSource to identify and collect information useful for the technical, market-oriented, and commercial study of the market. Vendor offerings have also been considered to determine the market segmentation. This entire research methodology includes the study of annual and financial reports of top players, presentations, press releases, journals, paid databases, trade directories, regulatory bodies, and safety standard organizations.
Primary Research
The SCARA robot market comprises several stakeholders, such as suppliers, system integrators, suppliers of standard components, software providers, and original equipment manufacturers (OEMs), in the supply chain. Several primary interviews have been conducted with market experts from both demand (commercial application providers) and supply (equipment manufacturers and distributors) sides across 4 major regions: North America, Europe, APAC, and RoW to gather both qualitative and quantitative information. Following is the breakdown of primary respondents.
To know about the assumptions considered for the study, download the pdf brochure
Market Size Estimation
Both top-down and bottom-up approaches have been used to estimate and validate the overall size of the SCARA robot market. These methods have also been used extensively to estimate the size of various market subsegments. The research methodology used to estimate the market size includes the following:
- Key players in major applications and markets have been identified through extensive secondary research.
- The industry’s supply chain and market size, in terms of value and volume, have been determined through primary and secondary research processes.
- All percentage shares, splits, and breakdowns have been determined using secondary sources and verified through primary sources.
Data Triangulation
After arriving at the overall market size using the estimation processes as explained above, the market was split into several segments and subsegments. To complete the overall market engineering process and arrive at the exact statistics of each market segment and subsegment, data triangulation and market breakdown procedures have been employed, wherever applicable. The data has been triangulated by studying various factors and trends from both demand and supply sides.
Report Objectives
- To describe and forecast the SCARA robot market, in terms of value and volume, segmented into payload capacity, application, and industry
- To describe and forecast the market size, in terms of value and volume, for various industries with regard to 4 main regions: North America, Europe, Asia Pacific (APAC), and Rest of the World (RoW)
- To provide detailed information regarding drivers, restraints, opportunities, and challenges influencing the growth of the market
- To provide a detailed overview of the value chain pertaining to the SCARA robots ecosystem
- To strategically analyze micromarkets with respect to individual growth trends, prospects, and contributions to the total market
- To analyze opportunities in the market for various stakeholders by identifying high-growth segments of the SCARA robot market
- To benchmark players within the market using proprietary "Competitive Leadership Mapping" framework, which analyzes market players on various parameters within the broad categories of business and product strategy
- To strategically profile key players and comprehensively analyze their market position in terms of ranking and core competencies, along with detailing the competitive landscape for market leaders
- To analyze competitive developments such as acquisitions, product launches and developments, and research and developments in the SCARA robot market
Available Customizations
With the given market data, MarketsandMarkets offers customizations according to the company’s specific needs. The following customization options are available for the report:
Product Analysis
- Product matrix that gives a detailed comparison of the product portfolio of each company
Company Information
- Detailed analysis and profiling of additional market players (up to 5).


Growth opportunities and latent adjacency in SCARA Robot Market