
Plant Breeding and CRISPR Plants Market

Plant Breeding and CRISPR Plants Market by Type (Conventional Breeding and Biotechnological Method), Trait (Herbicide Tolerance, Disease Resistance, Yield & Grain Size Improvement, Temperature Tolerance), Technology, Application, and Region - Global Forecast to 2030


OVERVIEW
Source: Secondary Research, Interviews with Experts, MarketsandMarkets Analysis
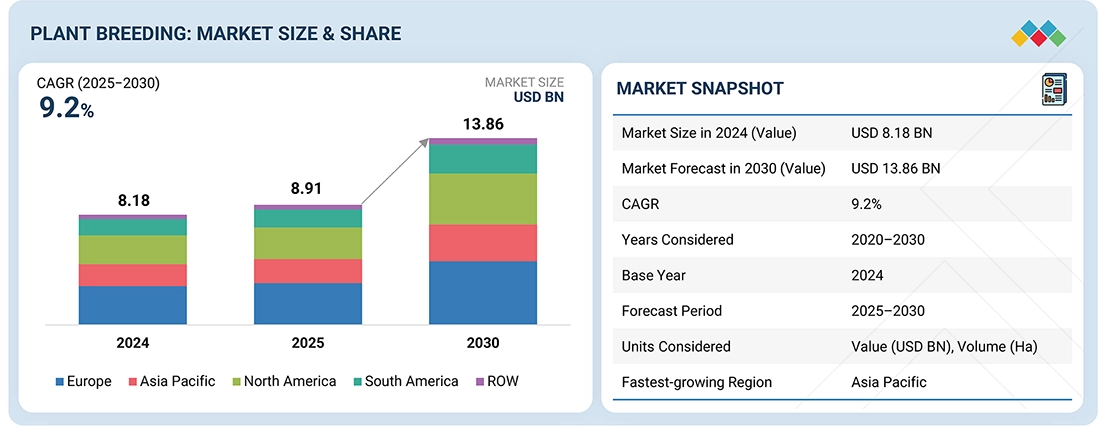
The global plant breeding market is estimated at USD 8.91 billion in 2025 and is projected to reach USD 13.86 billion by 2030, growing at a CAGR of 9.2%. As the global population rises (to reach 9.8 billion by 2050, as projected by the United Nations), food security concerns are increasing. This further drives advancements in plant breeding and CRISPR technologies. To maintain food production, farmers require crops that are high-yielding, pest-resistant, and climate-resilient.
Market Size and Forecast:
- Market Size Value in 2024: USD 8.81 Billion
- Market Size Value in 2025: USD 8.91 Billion
- Revenue Forecast in 2030: USD 13.86 Billion
- Growth Rate: CAGR of 9.2% from 2025 to 2030
- Base year: 2024
- Forecast period: 2025–2030
- North America accounted for a 35.1% share of the plant breeding market in 2024.
- Fruits & vegetables are the fastest-growing application segment, projected to register a CAGR of 10.0% during the forecast period.
Key Market Trends and Insights
- By Trait: The Herbicide Tolerance segment holds the largest share of the CRISPR plants market, driven by the increasing demand for crop varieties that enable effective weed management, enhance farm productivity, and support sustainable agricultural practices.
- Innovation Trends: Plant breeders are increasingly leveraging CRISPR gene-editing technologies to develop crops with improved yield potential, disease resistance, stress tolerance, and enhanced nutritional characteristics while accelerating breeding timelines.
- Growth Factors: Rising global food demand, the need for climate-resilient crop varieties, advancements in genome-editing technologies, and growing investments in agricultural biotechnology are supporting market expansion.
- Future Outlook: Significant opportunities are emerging in next-generation gene-edited crops, sustainable crop improvement programs, precision breeding applications, and the commercialization of plants with enhanced agronomic and consumer-focused traits.
KEY TAKEAWAYS
- North America accounted for a 35.1% share of the plant breeding market in 2024.
- Biotechnological breeding is set to be the largest and fastest-growing segment in the plant breeding market.
- Fruits & vegetables are the fastest-growing application segment, projected to register a CAGR of 10.0% during the forecast period.
- Herbicide tolerance is dominating the plant breeding market with a share of 30.5% in 2024.
- Bayer AG, Corteva, and Syngenta Group were identified as star players in the plant breeding market, given their strong market share and extensive product portfolios.
- Inari Agriculture, Inc., TROPIC, and Hudson River Biotechnology, among others, have distinguished themselves among startups and SMEs by securing strong footholds in specialized niche areas, underscoring their potential as emerging market leaders.
The global plant breeding market is being driven by rising food demand due to population growth, which necessitates the development of high-yielding, disease-resistant, and climate-resilient crops to ensure food security. Technological advancements, including CRISPR and molecular breeding, are enhancing the efficiency and precision of developing improved crop varieties to meet evolving agricultural needs.
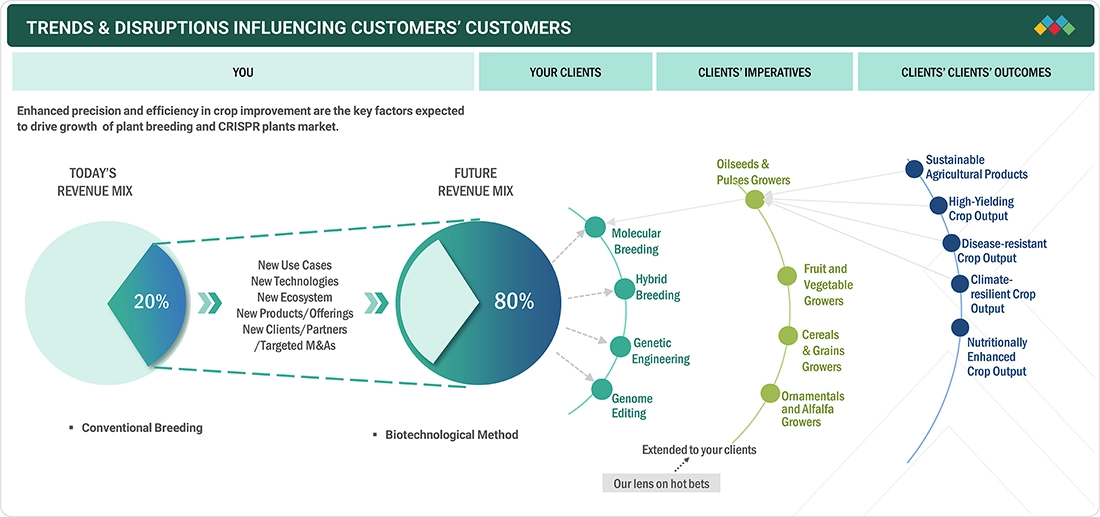
TRENDS & DISRUPTIONS IMPACTING CUSTOMERS' CUSTOMERS
The impact on consumers' business emerges from customer trends or disruptions. The need to accelerate and optimize breeding cycles and digitize breeding workflows is disrupting the marketspace related to seeding companies and governments. Companies such as Cargill and ADM are focusing on meeting regulatory and sustainability standards, while companies such as Corteva and Syngenta are investing in increasing genetic gain per crop generation. Higher productivity, lesser environmental footprint, and consistent food supply are key outcomes being aimed for by all stakeholders.
Source: Secondary Research, Interviews with Experts, MarketsandMarkets Analysis
MARKET DYNAMICS
Level
-
Technological advancements in plant breeding

-
Rising demand for high-yielding and stress-tolerant crops to ensure food security

Level
-
Stringent and lack of harmonized global regulatory frameworks for gene-edited crops

-
High costs associated with modern breeding techniques and infrastructure

Level
-
Development of crops with enhanced nutritional profiles

-
Growing private and public partnerships in plant breeding research

Level
-
Limited public awareness and consumer skepticism about gene-edited foods

-
Long breeding cycles delaying commercialization of new varieties

Source: Secondary Research, Interviews with Experts, MarketsandMarkets Analysis
Driver: Technological advancements in plant breeding
High-yielding, disease-resistant, and climate-resilient crops have been developed much more quickly due to rapid advancements in plant breeding technologies, such as CRISPR-based genome editing. Compared to conventional breeding techniques, CRISPR technology provides a precise, economical, and time-efficient means of enhancing crop traits. Molecular breeding methods, such as marker-assisted selection, have also improved breeding efficiency. This has enabled businesses to create better crop varieties more quickly. Hybrid breeding has further strengthened the market by enabling the production of high-performance seeds with superior traits.
Restraint: Stringent and lack of harmonized global regulatory frameworks for gene-edited crops
The lack of globally harmonized regulations for gene-edited crops remains a major restraint in the plant market. While some countries have enacted science-based policies that differentiate gene-edited crops from genetically modified organisms (GMOs), others have enacted strict regulations that limit commercialization. In the European Union (EU), for instance, gene-edited crops are currently governed by the same laws as genetically modified organisms (GMOs), which complicates and prolongs the approval process.
Opportunity: Development of crops with enhanced nutritional profiles
The development of crops with enhanced nutritional profiles presents a major opportunity in the plant breeding market. Consumers are increasingly looking for healthier food options, which has boosted interest in biofortified crops. These crops contain higher levels of essential nutrients like vitamins, minerals, and proteins. Advances in genome editing and molecular breeding have made it possible to enhance the nutritional value of staple crops. Breeding programs have also worked to improve digestibility by reducing antinutritional compounds in crops like soybeans and pulses.
Challenge: Limited public awareness and consumer skepticism about gene-edited foods
Public skepticism and limited awareness about gene-edited foods remain key challenges in the plant breeding market. Although genome editing technologies have many advantages, consumers continue to have misconceptions about their safety and moral implications. Despite differences in the underlying technology, many people mistakenly believe that gene-edited crops are the same as traditional GMOs, which leads to resistance. False information and negative media portrayals have also increased consumer hesitancy. The ambiguity surrounding the differences between genetically modified and gene-edited crops has contributed to the confusion in areas with stringent labelling regulations.
Plant Breeding and CRISPR Plants Market: COMMERCIAL USE CASES ACROSS INDUSTRIES
| COMPANY | USE CASE DESCRIPTION | BENEFITS |
|---|---|---|
 |
Implements precision breeding and gene editing technologies in corn programs to create varieties resistant to drought and pests | Enhanced crop adaptation to climate change, reduced pesticide and nutrient use, and accelerated breeding cycles for faster market delivery |
 |
Utilizes HI-Edit and CRISPR genome-editing tools in soybean breeding to introduce targeted genetic improvements for disease resistance | Quicker development of resilient seeds and increased yields and pest protection, enabling sustainable farming practices |
 |
Applies CRISPR-Cas gene editing in corn hybrids to stack native resistance genes against multiple disease | Improved disease protection without additional chemicals, higher yield potential, and reduced breeding time from years to months |
 |
Develops breeding solutions for vegetables using modern techniques to enhance quality and sustainability in production | Greater efficiency in resource use, minimized food waste through better shelf life, and support for climate-resilient agriculture |
Logos and trademarks shown above are the property of their respective owners. Their use here is for informational and illustrative purposes only.
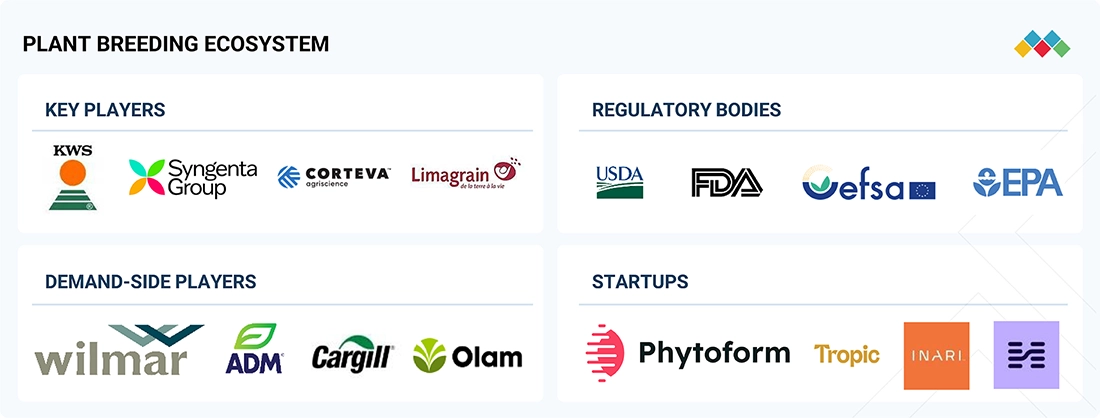
MARKET ECOSYSTEM
Some of the prominent companies in this market include well-established and financially sound in-house seed breeding companies, plant breeding service providers, and plant genome editing companies. These companies have diversified portfolios, latest technologies, and excellent global sales and marketing networks. Some of the prominent companies in this market include Bayer AG (Germany), Syngenta Group (Switzerland), KWS SAAT SE & Co. KGaA (Germany), Corteva (US), BASF (Germany), and Limagrain (France).
Logos and trademarks shown above are the property of their respective owners. Their use here is for informational and illustrative purposes only.
MARKET SEGMENTS
Source: Secondary Research, Interviews with Experts, MarketsandMarkets Analysis
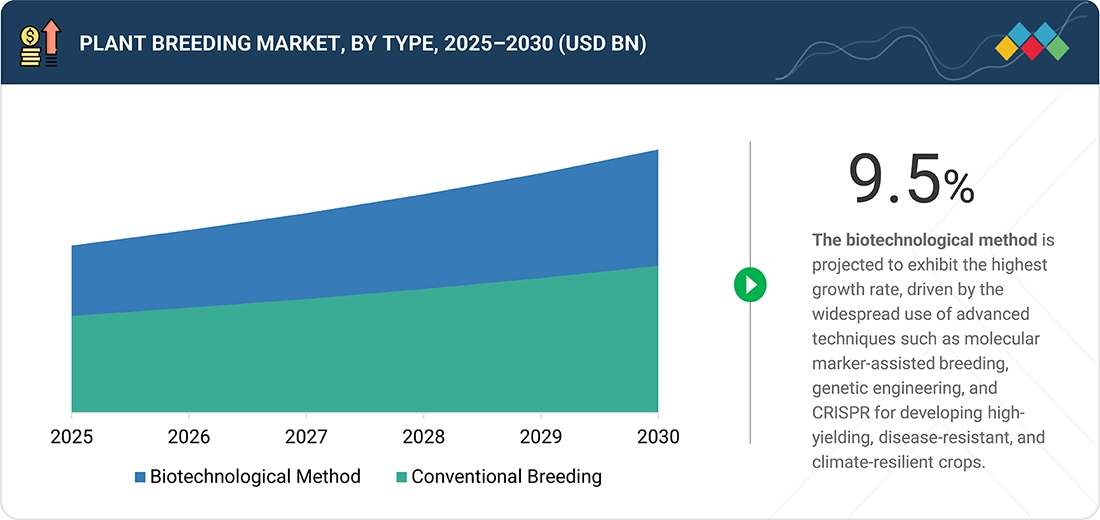
Plant Breeding Market, by Type
Biotechnological methods account for the larger share in the plant breeding market, driven by the widespread use of advanced techniques such as molecular marker-assisted breeding, genetic engineering, and CRISPR for developing high-yielding, disease-resistant, and climate-resilient crops. These methods offer greater precision and efficiency compared to conventional breeding, making them the preferred choice for meeting global food security and sustainability challenges.
Plant Breeding Market, by Trait
Herbicide tolerance is estimated to be the largest trait segment of the plant breeding market, as it enables farmers to effectively control weeds while minimizing crop damage. This trait improves productivity, reduces labor and input costs, and supports large-scale farming efficiency, making it one of the most widely adopted traits in modern crop development.
Plant Breeding Market, by Application
Cereals & grains are pegged to form the largest application segment of the plant breeding market, as they are staple food crops across major regions and are essential for ensuring food security. Rising demand for high-yielding, disease-resistant, and climate-resilient varieties of rice, wheat, corn, and other grains has driven extensive use of advanced breeding techniques in this segment, making it the dominant application area.
REGION
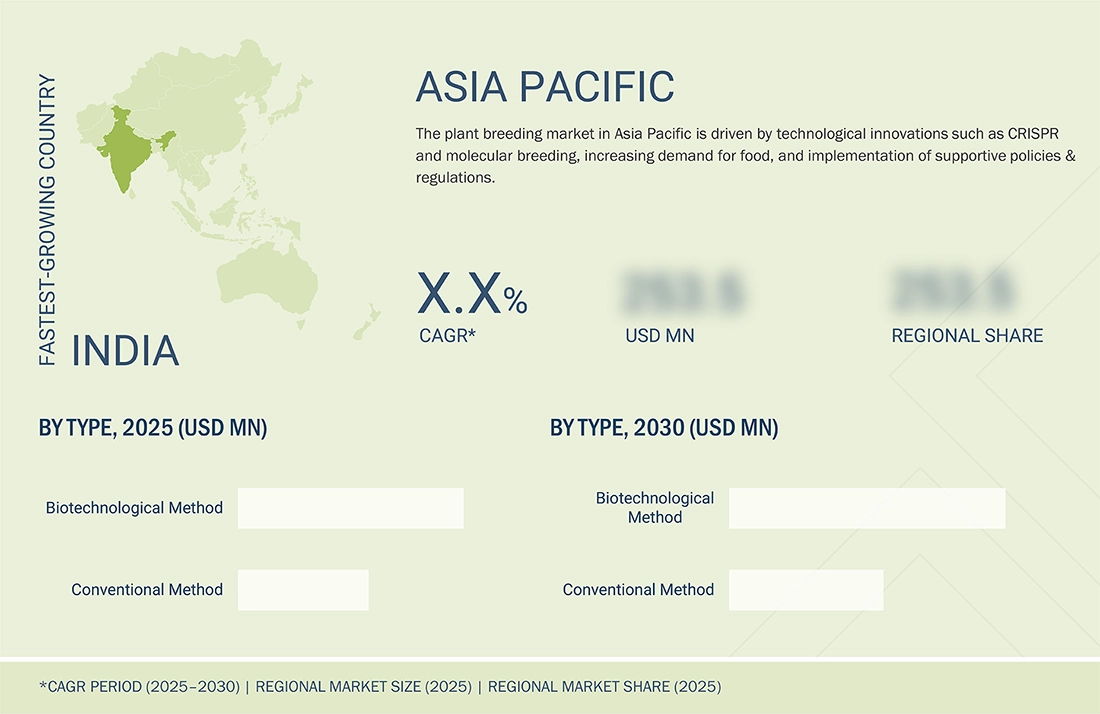
Asia Pacific to be fastest-growing region in global plant breeding market during forecast period
The Asia Pacific region is estimated to experience the fastest growth in the plant breeding market due to rising food demand, supportive regulatory frameworks, and increasing investments in agricultural biotechnology. Governments in countries like China, India, Japan, and the Philippines are enacting laws to support research and commercialisation, putting them at the forefront of the adoption of genome editing. Rapid population growth and changing climatic conditions have intensified the need for high-yield, stress-tolerant crops, making advanced breeding techniques essential. According to an article by ISAAA in August 2024, several Asia Pacific nations have revised their regulatory policies to encourage genome editing innovations. India, for instance, has exempted certain genome-edited crops from stringent GMO regulations, while Japan has approved multiple gene-edited food products for commercial sale.
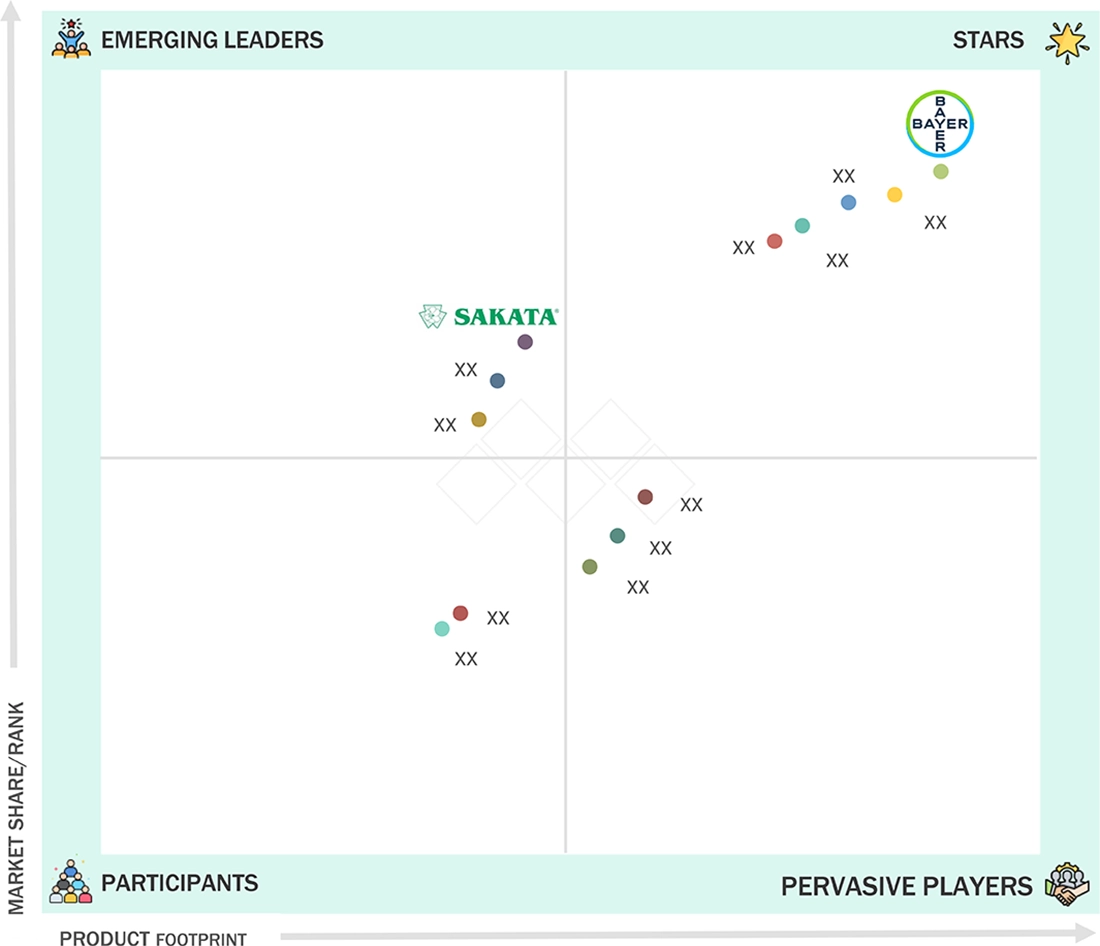
Plant Breeding and CRISPR Plants Market: COMPANY EVALUATION MATRIX
In the plant breeding market matrix, Bayer (Star) stands out, leveraging its strong R&D capabilities, advanced biotechnological platforms, and global presence to deliver high-yielding, resilient crop varieties that address food security and sustainability challenges. Sakata Seeds is positioning itself as an emerging leader, expanding its footprint through innovative breeding programs, targeted investments in vegetables and specialty crops, and a growing international presence, signaling its increasing influence in the competitive plant breeding landscape.
Source: Secondary Research, Interviews with Experts, MarketsandMarkets Analysis
KEY MARKET PLAYERS
MARKET SCOPE
| REPORT METRIC | DETAILS |
|---|---|
| Market Size in 2024 (Value) | USD 8.18 Billion |
| Market Forecast in 2030 (value) | USD 13.86 Billion |
| Growth Rate | CAGR of 9.2% from 2025 to 2030 |
| Years Considered | 2020–2030 |
| Base Year | 2024 |
| Forecast Period | 2025–2030 |
| Units Considered | Value (USD Million/Billion), Volume (Ha) |
| Report Coverage | Revenue forecast, company ranking, competitive landscape, growth factors, and trends |
| Segments Covered |
|
| Regions Covered | North America, Asia Pacific, Europe, South America, RoW |
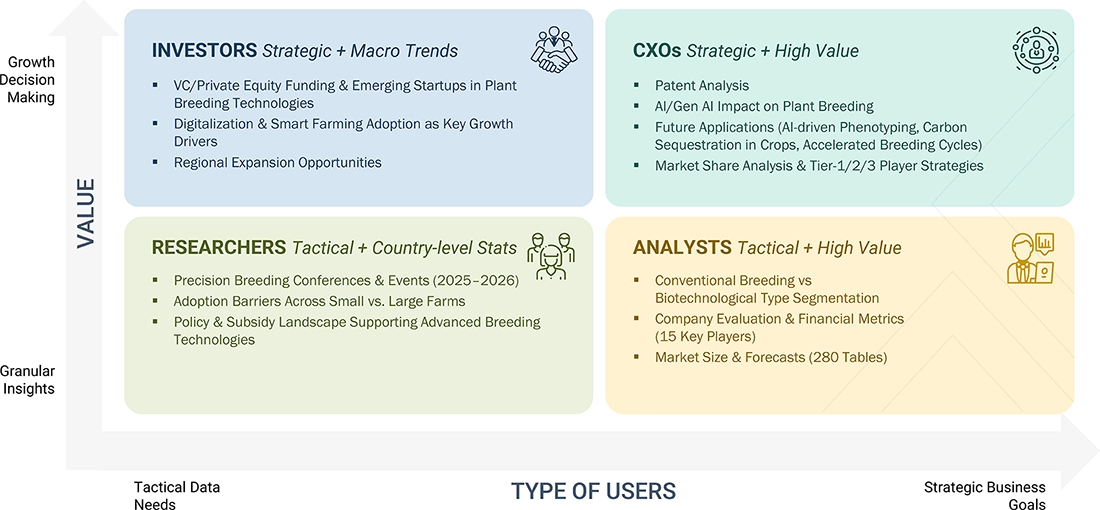
WHAT IS IN IT FOR YOU: Plant Breeding and CRISPR Plants Market REPORT CONTENT GUIDE
DELIVERED CUSTOMIZATIONS
We have successfully delivered the following deep-dive customizations:
| CLIENT REQUEST | CUSTOMIZATION DELIVERED | VALUE ADDS |
|---|---|---|
| APAC-based Seed Developers |
|
|
| AgBiotech Innovators |
|
|
| Crop Nutrition Providers |
|
|
RECENT DEVELOPMENTS
- February 2025 : KWS SAAT SE & Co. KGaA (Germany) introduced new combination varieties that combined the CONVISO SMART system with high Cercospora protection (CR+), solidifying its market position in the sugar beet seed industry. These varieties were introduced in several European markets, with further expansion planned.
- January 2025 : Syngenta Vegetable Seeds, part of Syngenta Group (Switzerland) signed a global licensing partnership deal with Apricus Seeds (US), that would give Syngenta exclusive access to Apricus' melon, squash, and watermelon germplasm. This partnership enhanced Syngenta’s cucurbits portfolio.
- November 2024 : Hazera, a brand by Limagrain (France) opened a high-tech R&D tomato greenhouse in Made, the Netherlands, near its headquarters. The nearly 5-hectare facility, supported by Limagrain, aimed to enhance research on disease-resistant, high-yield tomato varieties. The greenhouse, which was repurposed from a commercial operation, reflected Hazera's sustainability goals and used innovative breeding techniques to spur innovation in the high-tech tomato market worldwide.
- October 2023 : SAKATA SEED CORPORATION (Japan) acquired Brazilian seed company Isla Sementes LTDA (Brazil) and its holding company, Spalding, for USD 12.7 million. The acquisition was intended to increase Sakata's market share among smallholder farmers and home gardeners in Brazil. Sakata planned to leverage Isla’s sales network and product lineup, expecting synergies to boost sales by USD 3 million within five years.
- August 2023 : Pairwise (US) and Bayer AG (Germany) signed a new five-year, multi-million-dollar agreement to advance gene-edited short-stature corn for Bayer AG’s Preceon Smart Corn System. The partnership improved corn's resistance to extreme weather and increased input efficiency by utilizing Pairwise's Fulcrum platform, building on their previous partnership that produced 27 novel traits.
Table of Contents
 Exclusive indicates content/data unique to MarketsandMarkets and not available with any competitors.
Methodology
The study involved two major approaches in estimating the current size of the plant breeding and CRISPR plants market. Exhaustive secondary research was done to collect information on the market, peer, and parent markets. The next step was to validate these findings, assumptions, and sizing with industry experts across the value chain through primary research. Both top-down and bottom-up approaches were employed to estimate the complete market size. After that, market breakdown and data triangulation were used to estimate the market size of segments and subsegments.
Secondary Research
This research study involved the extensive use of secondary sources—directories and databases such as Bloomberg Businessweek and Factiva—to identify and collect information useful for a technical, market-oriented, and commercial study of the market.
In the secondary research process, various sources such as annual reports, press releases & investor presentations of companies, white papers, food journals, certified publications, articles from recognized authors, directories, and databases were referred to identify and collect information.
Secondary research was mainly used to obtain key information about the industry’s supply chain, the total pool of key players, and market classification and segmentation as per the industry trends to the bottom-most level, regional markets, and key developments from both market- and technology-oriented perspectives.
Primary Research
Extensive primary research was conducted after obtaining information regarding the plant breeding and CRISPR plants market scenario through secondary research. Several primary interviews were conducted with market experts from both the demand and supply sides across major countries of North America, Europe, Asia Pacific, South America, and the Rest of the World. Primary data was collected through questionnaires, emails, and telephonic interviews. The primary sources from the supply side included various industry experts, such as Chief X Officers (CXOs), Vice Presidents (VPs), Directors from business development, marketing, research, and development teams, and related key executives from distributors and key opinion leaders. Primary interviews were conducted to gather insights such as market statistics, data on revenue collected from the products and services, market breakdowns, market size estimations, market forecasting, and data triangulation. Primary research also helped in understanding the various trends related to type, trait, technology, application, and region. Stakeholders from the demand side, such as research institutions, government institutions, agri-businesses, and food & beverage manufacturing comapnies were interviewed to understand the buyer’s perspective on the suppliers, products, and their current usage of plant breeding and CRISPR plants and the outlook of their business, which will affect the overall market.

Note 1: Others include sales managers, marketing managers, and product managers.
Note 2: Tier 1 companies’ revenues are more than USD 10 billion; tier 2 companies’ revenues range between USD 1 and 10 billion; and tier 3 companies’ revenues range between USD 500 million and USD 1 billion.
Source: Industry Experts
To know about the assumptions considered for the study, download the pdf brochure
|
COMPANY NAME |
DESIGNATION |
|
Limagrain (France) |
General Manager |
|
Syngenta Sales Manager (Switzerland) |
Sales Manager |
|
UPL (India) |
Research Scientist |
|
Bayer AG (Germany) |
Innovation Development Manager |
|
Corteva (US) |
Manager |
|
BASF (Germany) |
Marketing Manager |
Market Size Estimation
Both the top-down and bottom-up approaches have been used to estimate and validate the total size of the plant breeding and CRISPR plants market. These approaches have also been used extensively to determine the size of the various sub-segments in the market. The research methodology used to estimate the market size includes the following details:
- The key players in the industry and market have been identified through extensive secondary research.
- Primary and secondary research have determined the plant breeding and CRISPR plants value chain and market size in terms of value.
- All percentage shares, splits, and breakdowns were determined using secondary sources and verified through primary sources.
- All macroeconomic and microeconomic factors affecting the growth of the plant breeding and CRISPR plants market were considered while estimating the market size.
- All the possible parameters that affect the market covered in this research study have been accounted for, viewed in extensive detail, verified through primary research, and analyzed to obtain the final quantitative and qualitative data.
Plant Breeding and CRISPR Plants Market : Top-Down and Bottom-Up Approach

Data Triangulation
After arriving at the overall market size from the estimation process explained above, the total market was split into the application segment and sub-segments. The data triangulation and market breakdown procedures were employed to estimate the overall plant breeding and CRISPR plants market and arrive at the exact statistics for all sub-segments, wherever applicable. The data was triangulated by studying various factors and trends from the demand and supply sides. The market size was also validated using both the top-down and bottom-up approaches.
Market Definition
According to the National Association of Plant Breeders, “plant breeding is the science-driven creative process of developing new plant varieties that goes by various names including cultivar development, crop improvement, and seed improvement. Breeding involves the creation of multi-generation genetically diverse populations on which human selection is practiced to create adapted plants with new combinations of specific desirable traits.”
According to the Food and Agriculture Organization (FAO), plant breeding is the “art and science of genetically improving plants for the benefit of humankind. Plant breeding can be accomplished through many different techniques ranging from simply selecting plants with desirable characteristics for propagation, to more complex molecular techniques. Plant breeding has a proven track record in increasing crop productivity.”
Additionally, gene editing technology accelerates breeding processes more efficiently than cross-breeding, mutation breeding, or transgenesis, as per FAO Director-General, who studied plant breeding and genetics and made important contributions to understanding the potato genome. It encompasses various molecular techniques, with CRISPR driving a surge in research and applications. CRISPR is faster and more cost-effective than traditional breeding methods, enabling the development of climate-resilient and nutrient-rich crops and livestock while preserving genetic biodiversity and strengthening agrifood systems.
In general terms, multiple seed manufacturers define plant breeding as crossing of two plants to produce an offspring that, ideally, shares the best traits of the two parent plants. Traditionally, conventional breeding techniques were practiced for the development of new traits and seeds. With the advent of biotechnology in agriculture, hybridization, molecular breeding, and genetic engineering are currently being explored by plant breeders. Consequently, the CRISPR plants market focuses on the application of gene-editing technologies to develop crops with enhanced traits such as improved yield, pest resistance, and environmental adaptability.
Stakeholders
- Plant breeders (Farmers & Growers)
- Genetic solution providers and biotechnological companies
- Technology providers and lab instrument & equipment manufacturers
- Commercial and GMO seed companies
- Research institutions/agencies/laboratories/ academic institutions
-
Concerned government authorities, commercial R&D institutions, and other regulatory bodies
- Food and Agriculture Organization (FAO)
- World Health Organization (WHO)
- US Department of Agriculture (USDA)
- European Food Safety Authority (EFSA)
- European Commission
- Government agencies
-
Associations
- International Seed Federation (ISF)
- American Seed Trade Association (ASTA)
- US National Corn Growers Association (NCGA)
- Importers, exporters, distributors, & traders
- Food & Beverage Companies
Report Objectives
- Determining and projecting the size of the plant breeding and CRISPR plants market, concerning type, trait, application, and regional markets, over five years ranging from 2025 to 2030
- Identifying the attractive opportunities in the market by determining the largest and fastest-growing segments across regions
- Providing detailed information about the key factors influencing the growth of the market (drivers, restraints, opportunities, and industry-specific challenges)
- Analyzing the micromarkets, concerning individual growth trends, prospects, and their contribution to the total market
Available Customizations
With the given market data, MarketsandMarkets offers customizations according to company-specific scientific needs.
The following customization options are available for the report:
Product Analysis
- Product/Service Matrix, which gives a detailed comparison of the product or service portfolio of each company.
Geographic Analysis as per Feasibility
With the given market data, MarketsandMarkets offers customizations according to company-specific scientific needs.
- Further breakdown of the Rest of Europe plant breeding and CRISPR plants market into key countries.
- Further breakdown of the Rest of Asia Pacific plant breeding and CRISPR plants market into key countries.
- Further breakdown of the Rest of South America plant breeding and CRISPR plants market into key countries.
Company Information
- Detailed analyses and profiling of additional market players (up to five)
Key Questions Addressed by the Report
What is the current size of plant breeding and CRISPR plants market?
The global plant breeding and CRISPR plants market is estimated at USD 8.91 billion in 2025 and is projected to reach USD 13.86 billion by 2030, at a CAGR of 9.2% from 2025 to 2030.
Which are the key players in the market, and how intense is the competition?
Bayer AG (Germany), Syngenta Group (Switzerland), KWS SAAT SE & Co. KGaA (Germany), Corteva (US), BASF (Germany), and Limagrain (France) are some of the key market players.
The market for plant breeding and CRISPR plants is expanding rapidly, with more collaborations, acquisitions, and product/service launches.
Which region is projected to account for the largest share of the plant breeding and CRISPR plants market?
North America has the largest share in the global plant breeding and CRISPR plants market owing to strong regulatory support for genome-edited crops, high R&D investments from leading biotech firms, and the widespread adoption of advanced breeding technologies in large-scale commercial farming.
What kind of information is provided in the company profiles section?
The provided company profiles deliver crucial details, including a thorough business summary that covers different segments, financial results, geographic presence, revenue distribution, and business revenue breakdown. They also offer insights into product/service lines, key achievements, and expert analyst opinions to better illustrate the company's potential.
What are the factors driving the plant breeding and CRISPR plants market?
Technological advancements in plant breeding & CRISPR, growing adoption of hybrid and genetically engineered/edited seeds, and government initiatives and regulatory support.
Need a Tailored Report?
Customize this report to your needs
Get 10% FREE Customization
Customize This ReportPersonalize This Research
- Triangulate with your Own Data
- Get Data as per your Format and Definition
- Gain a Deeper Dive on a Specific Application, Geography, Customer or Competitor
- Any level of Personalization
Let Us Help You
- What are the Known and Unknown Adjacencies Impacting the Plant Breeding and CRISPR Plants Market
- What will your New Revenue Sources be?
- Who will be your Top Customer; what will make them switch?
- Defend your Market Share or Win Competitors
- Get a Scorecard for Target Partners

Custom Market Research Services
We Will Customise The Research For You, In Case The Report Listed Above Does Not Meet With Your Requirements
Get 10% Free CustomisationTESTIMONIALS

Business Innovation Director
US Based Leading Agribusiness,
Food and Ingredients ManufacturerI highly appreciate the team's efficiency for a well conducted study that helped us clarify some blind spots in food and agricultural niche markets. Although compiling information for B2B markets is very difficult, the MnM team pulled out the task successfully. The quality of research, level of insights, and responsiveness of team were commendable.


Growth opportunities and latent adjacency in Plant Breeding and CRISPR Plants Market