Motor Management Market by Product & Service (Hardware and Software & Solution Services), Type (Synchronous Motor and Asynchronous Motor), Control, Voltage Range, Application, Industry, and Geography - Global Forecast to 2036


Motor Management Market Summary
The Motor Management Market size is estimated to be valued between USD 4.0–5.0 billion and is projected to reach approximately USD 9.0–11.0 billion by 2036, expanding at a CAGR of 7%–9% during the forecast period. The Market is witnessing strong growth driven by the rapid expansion of industrial automation, smart manufacturing, and energy efficiency initiatives. The increasing integration of Artificial Intelligence (AI), Industrial Internet of Things (IIoT), and predictive maintenance technologies is transforming traditional motor control systems into intelligent motor management solutions. Industries are increasingly adopting automated motor control centers (MCCs) and smart drives to optimize performance, reduce downtime, and improve energy consumption. The shift toward digital transformation and Industry 4.0 is further accelerating demand across manufacturing, oil & gas, utilities, and infrastructure sectors.
Key Market Trends & Insights
The Motor Management Market is evolving with significant technological advancements and industry adoption trends. North America currently leads the market due to early adoption of automation and strong industrial infrastructure, while Asia Pacific is emerging as the fastest-growing region driven by rapid industrialization and urbanization.
The motor control centers (MCCs) segment dominates the market owing to their widespread use in large-scale industrial operations. Meanwhile, intelligent motor protection systems integrated with AI-driven analytics are gaining traction as companies focus on predictive maintenance.
The rise of smart factories and connected devices is fueling the integration of IoT-enabled motor management systems. Additionally, cloud-based monitoring platforms are becoming increasingly popular for real-time performance tracking and remote diagnostics.
AI and automation technologies are playing a crucial role in reducing operational costs and enhancing system reliability, making motor management systems a core component of modern industrial ecosystems.
Market Size & Forecast
-
Base year market size (2025): USD 4.0–5.0 billion
-
Forecast market size (2036): USD 9.0–11.0 billion
-
CAGR (2025–2036): 7%–9%
-
Growth is driven by increasing adoption of industrial automation, energy efficiency regulations, and the integration of AI and IoT technologies into motor control systems
Motor Management Market Top 10 key takeaway
-
The market is expected to nearly double by 2036 due to digital transformation across industries
-
Motor control centers (MCCs) remain the dominant product segment
-
Asia Pacific is the fastest-growing regional market
-
AI-driven predictive maintenance is a key growth driver
-
Increasing focus on energy efficiency is boosting demand
-
Industrial IoT integration is reshaping motor monitoring systems
-
Cloud-based motor management solutions are gaining popularity
-
Oil & gas and manufacturing sectors are major end users
-
Smart factories are accelerating adoption of intelligent motor systems
-
Regulatory compliance for energy efficiency is influencing purchasing decisions
Product Insights
The motor control centers (MCCs) segment leads the Motor Management Market due to its critical role in managing and controlling multiple motors in industrial settings. MCCs offer centralized control, enhanced safety, and operational efficiency, making them indispensable in industries such as manufacturing, mining, and utilities. Their ability to integrate with automation systems further strengthens their dominance.
Motor protection relays and intelligent motor starters are also gaining traction as industries seek advanced solutions for equipment protection and operational reliability. These systems are increasingly embedded with AI algorithms that enable predictive fault detection and real-time diagnostics.
Emerging product categories such as smart drives and digital motor management systems are transforming the market landscape. These solutions leverage AI and IoT to provide data-driven insights, enabling industries to optimize motor performance, reduce downtime, and extend equipment lifespan.
Technology / Component Insights
The Motor Management Market is being driven by a combination of advanced technologies, including AI, IoT, cloud computing, and automation. AI-powered analytics are enabling predictive maintenance by analyzing motor performance data to identify potential failures before they occur. This significantly reduces unplanned downtime and maintenance costs.
IoT-enabled sensors and devices are facilitating real-time monitoring of motor operations, providing insights into parameters such as temperature, vibration, and energy consumption. These connected systems allow for remote monitoring and control, enhancing operational efficiency.
Cloud-based platforms are becoming integral to motor management systems, offering scalable and flexible solutions for data storage and analysis. Automation technologies, including programmable logic controllers (PLCs) and distributed control systems (DCS), are further enhancing system integration and control.
Looking ahead, the integration of digital twins and edge computing is expected to revolutionize motor management by enabling real-time simulation and decision-making at the source of data generation.
Application Insights
The manufacturing sector is the leading application segment in the Motor Management Market, driven by the widespread adoption of automation and smart factory initiatives. Motors are essential components in manufacturing processes, and efficient motor management systems are critical for ensuring productivity and minimizing downtime.
The oil & gas industry is another significant contributor, where motor management systems are used in upstream, midstream, and downstream operations to ensure reliability and safety in harsh environments. The utilities sector, including power generation and water treatment, is also witnessing increased adoption due to the need for efficient energy management.
Future opportunities lie in sectors such as renewable energy, electric vehicles, and smart infrastructure, where advanced motor management systems can play a crucial role in optimizing performance and ensuring sustainability.
Regional Insights
North America dominates the Motor Management Market due to its advanced industrial infrastructure and early adoption of automation technologies. The presence of major industry players and strong investments in smart manufacturing further support market growth in the region.
Europe follows closely, driven by stringent energy efficiency regulations and the adoption of Industry 4.0 initiatives. Countries such as Germany and France are leading the region with strong industrial bases and technological advancements.
Asia Pacific is the fastest-growing region, fueled by rapid industrialization, urbanization, and increasing investments in infrastructure development. Countries like China and Japan are at the forefront of adopting advanced motor management solutions.
-
North America leads due to automation and digital transformation
-
Europe benefits from strong regulatory frameworks
-
Asia Pacific shows the highest growth potential
-
Industrial expansion drives demand in emerging economies
-
Smart infrastructure projects are boosting regional adoption
Country-Specific Market Trends
In Asia Pacific, China is experiencing rapid growth with a CAGR of 9%–11%, driven by large-scale manufacturing and infrastructure projects. Japan, with a CAGR of 7%–9%, is focusing on advanced automation and robotics integration.
In North America, the United States leads with a CAGR of 6%–8%, supported by investments in industrial IoT and smart manufacturing. Canada and Mexico are also witnessing steady growth due to industrial modernization.
In Europe, Germany is a key market with a CAGR of 7%–9%, driven by Industry 4.0 initiatives, while France is experiencing moderate growth due to increasing adoption of energy-efficient technologies.
-
China dominates APAC with rapid industrial expansion
-
Japan focuses on robotics and automation integration
-
United States leads North America in smart manufacturing
-
Germany drives European growth through Industry 4.0
-
France emphasizes energy efficiency and sustainability
Key Motor Management Market Company Insights
The Motor Management Market is highly competitive, with key players focusing on innovation, AI integration, and strategic partnerships. Companies are investing heavily in R&D to develop advanced motor management solutions that offer enhanced efficiency and reliability.
Major players include ABB Ltd., Siemens AG, Schneider Electric SE, Rockwell Automation Inc., Eaton Corporation, General Electric Company, Mitsubishi Electric Corporation, Honeywell International Inc., and Emerson Electric Co. These companies are leveraging AI and IoT technologies to offer intelligent motor management systems that cater to evolving industry needs.
Their strategies include expanding product portfolios, integrating digital technologies, and forming partnerships to strengthen market presence and enhance customer offerings.
-
Companies are investing in AI-driven motor management solutions
-
Strategic partnerships are enhancing market reach
-
Focus on digital transformation and smart technologies
-
Expansion into emerging markets is a key strategy
-
Continuous innovation drives competitive advantage
Recent Developments
Recent developments in the Motor Management Market highlight the growing focus on technological innovation and collaboration. Several companies have launched AI-enabled motor protection systems that offer predictive maintenance capabilities and real-time monitoring.
In addition, partnerships between industrial automation firms and cloud service providers are enabling the development of integrated motor management platforms. These platforms provide advanced analytics and remote monitoring capabilities, enhancing operational efficiency.
Furthermore, new product launches featuring IoT-enabled motor control centers are gaining traction, offering improved performance and energy efficiency for industrial applications.
Market Segmentation
The Motor Management Market is segmented based on product, technology/component, application, and region. By product, the market includes motor control centers, motor protection relays, and intelligent motor starters. By technology, it encompasses AI-based systems, IoT-enabled devices, and cloud-based platforms. Applications span across manufacturing, oil & gas, utilities, and infrastructure. Regionally, the market is divided into North America, Europe, Asia Pacific, and the rest of the world.
-
Product segmentation includes MCCs and protection systems
-
Technology includes AI, IoT, and cloud integration
-
Applications cover industrial and infrastructure sectors
-
Regional segmentation highlights global market dynamics
-
Smart solutions are gaining prominence across segments
The Motor Management Market is poised for significant growth through 2036, driven by the increasing adoption of AI, IoT, and automation technologies. As industries continue to embrace digital transformation, motor management systems will play a critical role in enhancing operational efficiency, reducing costs, and ensuring sustainability. The integration of advanced technologies such as predictive analytics and digital twins will further revolutionize the market, offering new opportunities for innovation and growth. Businesses that invest in intelligent motor management solutions will be well-positioned to gain a competitive edge in the evolving industrial landscape.
FAQs
1. What is the current size of the Motor Management Market?
The market size is estimated at USD 4.0–5.0 billion in 2025.
2. What is the expected growth rate of the market?
The market is projected to grow at a CAGR of 7%–9% from 2025 to 2036.
3. What are the key drivers of market growth?
Key drivers include industrial automation, AI and IoT integration, and energy efficiency initiatives.
4. Which region leads the market?
North America currently leads the Motor Management Market.
5. Who are the key players in the market?
Major companies include ABB, Siemens, Schneider Electric, Rockwell Automation, and Eaton Corporation.
To speak to our analyst for a discussion on the above findings, click Speak to Analyst
 Exclusive indicates content/data unique to MarketsandMarkets and not available with any competitors.
Table of Contents
1 Introduction (Page No. - 16)
1.1 Objectives of the Study
1.2 Definition
1.3 Study Scope
1.3.1 Markets Covered
1.3.2 Years Considered for the Study
1.4 Currency
1.5 Limitations
1.6 Stakeholders
2 Research Methodology (Page No. - 19)
2.1 Research Data
2.1.1 Secondary Data
2.1.1.1 Secondary Sources
2.1.2 Primary Data
2.1.2.1 Primary Sources
2.1.2.2 Key Industry Insights
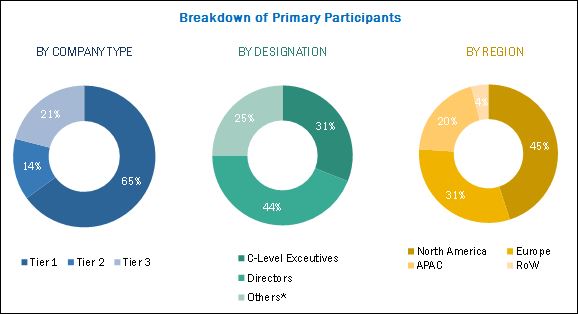
2.1.2.3 Breakdown of Primaries
2.2 Market Size Estimation
2.2.1 Bottom-Up Approach
2.2.1.1 Approach for Capturing the Market Share By Bottom-Up Analysis (Demand Side)
2.2.2 Top-Down Approach
2.2.2.1 Approach for Capturing the Market Share Top-Down Analysis (Supply Side)
2.3 Market Breakdown and Data Triangulation
2.4 Research Assumptions
3 Executive Summary (Page No. - 28)
4 Premium Insights (Page No. - 33)
4.1 Motor Management and Control Device Market, 2017–2023 (USD Million)
4.2 Motor Management and Control Device Market, By Type (2017–2023)
4.3 Motor Management and Control Device Market, By Motor Voltage (2017)
4.4 Motor Management and Control Device Market, By Motor Control (2017)
4.5 Motor Management and Control Device Market, By Application (2017)
4.6 Motor Management and Control Device Market, By Industry and Region (2017)
4.7 Motor Management and Control Device Market, By Geography (2017)
5 Market Overview (Page No. - 38)
5.1 Introduction
5.1.1 Drivers
5.1.1.1 Rising Demand for Smart, Multifunctional, Integrated Motor Control and Protection Devices
5.1.1.2 Need for Reducing Unplanned Industrial Downtime
5.1.2 Opportunities
5.1.2.1 Increasing Adoption of Industrial Automation
5.1.2.2 Improved Software to Create New Possibilities in the Motors Management and Control Device Market
5.1.3 Challenges
5.1.3.1 Dominance of Conventional Motor Management and Controllers
5.1.3.2 Lack of Awareness Regarding Motor Management and Control Devices
5.1.3.3 Decreasing Greenfield Investments in the Oil & Gas Industry
6 Industry Trends (Page No. - 43)
6.1 Introduction
6.1.1 Raw Material Suppliers
6.1.2 Original Equipment Manufacturers & Assemblers
6.1.3 Industries
6.2 Standards
6.2.1 Nema Standard Classification for Motor Management and Control Devices
6.2.2 International Electrotechnical Commission (IEC) for Motor Management and Control Devices
6.2.3 Others
7 Market, By Product & Service (Page No. - 46)
7.1 Introduction
7.2 Hardware
7.3 Software & Solution Services
8 Market, By Type (Page No. - 51)
8.1 Introduction
8.2 Asynchronous Motors
8.3 Synchronous Motors
9 Market, By Control (Page No. - 54)
9.1 Introduction
9.2 Automatic Controls
9.3 Semi-Automatic Controls
9.4 Manual Controls
10 Market, By Voltage Range (Page No. - 57)
10.1 Introduction
10.2 Low Voltage (60 to 240 Volt AC)
10.3 Medium Voltage (250 to 395 Volt AC)
10.4 High Voltage (396 to 485 Volt AC)
11 Market, By Application (Page No. - 60)
11.1 Introduction
11.2 Pumps
11.3 Compressors
11.4 Material Handling
11.5 Other Applications
12 Market, By Industry (Page No. - 88)
12.1 Introduction
12.2 Metals & Mining Industry
12.3 Oil & Gas Industry
12.4 Power Generation Industry
12.5 Water Supply and Wastewater Treatment Industry
12.6 Food & Beverages Industry
12.7 Agriculture
12.8 Chemicals Industry
12.9 Cement Industry
12.10 Other Industries
13 Geographic Analysis (Page No. - 104)
13.1 Introduction
13.2 North America
13.2.1 US
13.2.2 Canada
13.2.3 Mexico
13.3 Europe
13.3.1 Germany
13.3.2 UK
13.3.3 France
13.3.4 Rest of Europe
13.4 Asia Pacific
13.4.1 China
13.4.2 Japan
13.4.3 India
13.4.4 Rest of Asia Pacific
13.5 Rest of World
13.5.1 Middle East and Africa
13.5.2 South America
14 Competitive Landscape (Page No. - 116)
14.1 Overview
14.2 Market Ranking Analysis of Motor Management and Control Device Market
14.3 Motor Management and Control Device Market, Competitive Leadership Mapping, 2017
14.3.1 Introduction
14.3.2 Visionary Leaders
14.3.3 Dynamic Differentiators
14.3.4 Innovators
14.3.5 Emerging Companies
14.3.6 Motor Management and Control Device Market
14.4 Strength of Product Portfolio
14.5 Business Strategy Excellence
*Top 25 Companies Analyzed for This Study are - ABB Ltd. (Switzerland), Ametek, Inc. (US), Anaheim Automation Inc. (US), Analog Devices, Inc. (US), Arm Holdings PLC (UK), Bartec GmbH (Germany), Bosch Rexroth AG (Germany), Boston Engineering (US), C3controls (US), Eaton Corporation PLC (Ireland), Fanox Electronic S.L (Spain), Fuji Electric Co. Ltd (Japan), General Electric (US), Hitachi, Ltd.(Japan), Iar System (Sweden), Larsen & Toubro (L&T) (India), Mitsubishi Electric Corporation (Japan), Nanotec Electronic GmbH & Co. Kg (Germany), Renesas Electronics (Japan), Rockwell Automation (US), Schneider Electric SE (France), Siemens AG (Germany), Texas Instruments (US), Velmex Inc. (US), Weg Sa (Brazil)
14.6 Competitive Situation and Trends
15 Company Profiles (Page No. - 124)
(Business Overview, Products Offered & Services Strategies, Key Insights, Recent Developments, MnM View)*
15.1 Introduction
15.2 ABB Ltd
15.3 Analog Devices, Inc.
15.4 Eaton Corporation
15.5 General Electric (GE)
15.6 Hitachi Ltd.
15.7 Mitsubishi Electric Corporation
15.8 Rockwell Automation
15.9 Schneider Electric SE
15.10 Siemens AG
15.11 Texas Instruments Inc.
15.12 Key Innovators
15.12.1 Ametek, Inc.
15.12.2 Fuji Electric Co., Ltd.
15.12.3 Larsen & Toubro
15.12.4 Nanotec Electronic GmbH & Co. Kg
15.12.5 Weg Sa
*Details on Business Overview, Products Offered & Services Strategies, Key Insights, Recent Developments, MnM View Might Not Be Captured in Case of Unlisted Companies.
16 Appendix (Page No. - 158)
16.1 Insights of Industry Experts
16.2 Discussion Guide
16.3 Knowledge Store: Marketsandmarkets’ Subscription Portal
16.4 Introducing RT: Real-Time Market Intelligence
16.5 Available Customizations
16.6 Related Reports
16.7 Author Details
List of Tables (72 Tables)
Table 1 Motor Management Market, By Product & Service, 2014–2023 (USD Million)
Table 2 Motor Management Market for Hardware, By Component, 2014–2023 (USD Million)
Table 3 Motor Management Market for Software & Solution Services, By Type, 2014–2023 (USD Million)
Table 4 Motor Management Market, By Motor Type, 2014–2023 (USD Million)
Table 5 Motor Management Market, By Motor Control Type, 2014–2023 (USD Million)
Table 6 Motor Management Market, By Voltage Range, 2014–2023 (USD Million)
Table 7 Motor Management Market, By Application, 2014–2023 (USD Million)
Table 8 Motor Management Market for Pumps, By Region, 2014–2023 (USD Million)
Table 9 Motor Management Market for Pumps for Oil & Gas, By Region, 2014–2023 (USD Million)
Table 10 Motor Management Market for Pumps for Metals & Mining, By Region, 2014–2023 (USD Million)
Table 11 Motor Management Market for Pumps for Power Generation, By Region, 2014–2023 (USD Million)
Table 12 Motor Management Market for Pumps for Chemicals, By Region, 2014–2023 (USD Million)
Table 13 Motor Management Market for Pumps for Cement, By Region, 2014–2023 (USD Million)
Table 14 Motor Management Market for Pumps for Food & Beverages, By Region, 2014–2023 (USD Million)
Table 15 Motor Management Market for Pumps for Agriculture, By Region, 2014–2023 (USD Million)
Table 16 Motor Management Market for Pumps for Water Supply and Wastewater Treatment, By Region, 2014–2023 (USD Million)
Table 17 Motor Management Market for Pumps for Other Industries, By Region, 2014–2023 (USD Million)
Table 18 Motor Management Market for Compressors, By Region, 2014–2023 (USD Million)
Table 19 Motor Management Market for Compressors for Oil & Gas, By Region, 2014–2023 (USD Million)
Table 20 Motor Management Market for Compressors for Metals & Mining, By Region, 2014–2023 (USD Million)
Table 21 Motor Management Market for Compressors for Power Generation, By Region, 2014–2023 (USD Million)
Table 22 Motor Management Market for Compressors for Chemicals, By Region, 2014–2023 (USD Million)
Table 23 Motor Management Market for Compressors for Cement, By Region, 2014–2023 (USD Million)
Table 24 Motor Management Market for Compressors for Food & Beverages, By Region, 2014–2023 (USD Million)
Table 25 Motor Management Market for Compressors for Agriculture, By Region, 2014–2023 (USD Million)
Table 26 Motor Management Market for Compressor for Water Supply and Wastewater Treatment, By Region, 2014–2023 (USD Million)
Table 27 Motor Management Market for Compressors for Other Industries, By Region, 2014–2023 (USD Million)
Table 28 Motor Management Market for Material Handling, By Region, 2014–2023 (USD Million)
Table 29 Motor Management Market for Material Handling for Oil & Gas, By Region, 2014–2023 (USD Million)
Table 30 Motor Management Market for Material Handling for Metals & Mining, By Region, 2014–2023 (USD Million)
Table 31 Motor Management Market for Material Handling for Power Generation, By Region, 2014–2023 (USD Million)
Table 32 Motor Management Market for Material Handling for Chemicals, By Region, 2014–2023 (USD Million)
Table 33 Motor Management Market for Material Handling for Cement, By Region, 2014–2023 (USD Million)
Table 34 MMCD Market for Material Handling for Food & Beverages, By Region, 2014–2023 (USD Million)
Table 35 MMCD Market for Material Handling for Agriculture, By Region, 2014–2023 (USD Million)
Table 36 MMCD Market for Material Handling for Water Supply and Wastewater Treatment, By Region, 2014–2023 (USD Million)
Table 37 MMCD Market for Material Handling for Other Industries, By Region, 2014–2023 (USD Million)
Table 38 MMCD Market for Others, By Region, 2014–2023 (USD Million)
Table 39 MMCD Market for Others for Oil & Gas, By Region, 2014–2023 (USD Million)
Table 40 MMCD Market for Others for Metals & Mining, By Region, 2014–2023 (USD Million)
Table 41 MMCD Market for Others for Power Generation, By Region, 2014–2023 (USD Million)
Table 42 MMCD Market for Others for Chemicals, By Region, 2014–2023 (USD Million)
Table 43 MMCD Market for Others for Cement, By Region, 2014–2023 (USD Million)
Table 44 MMCD Market for Others for Food & Beverages, By Region, 2014–2023 (USD Million)
Table 45 MMCD Market for Others for Agriculture, By Region, 2014–2023 (USD Million)
Table 46 MMCD Market for Others for Water Supply and Wastewater Treatment, By Region, 2014–2023 (USD Million)
Table 47 MMCD Market for Other Applications for Other Industries, By Region, 2014–2023 (USD Million)
Table 48 MMCD Market, By Industry, 2014–2023 (USD Million)
Table 49 MMCD Market for Metals & Mining Industry, By Application, 2014–2023 (USD Million)
Table 50 MMCD Market for Metals & Mining Industry, By Region, 2014–2023 (USD Million)
Table 51 MMCD Market for the Oil & Gas Industry, By Application, 2014–2023 (USD Million)
Table 52 MMCD Market for Oil & Gas Industry, By Region, 2014–2023 (USD Million)
Table 53 MMCD Market for Power Generation Industry, By Application, 2014–2023 (USD Million)
Table 54 MMCD Market for Power Generation Industry, By Region, 2014–2023 (USD Million)
Table 55 MMCD Market for Water Supply and Wastewater Treatment Industry, By Application, 2014–2023 (USD Million)
Table 56 MMCD Market for Water Supply and Wastewater Treatment Industry, By Region, 2014–2023 (USD Million)
Table 57 MMCD Market for Food & Beverages Industry, By Application, 2014–2023 (USD Million)
Table 58 MMCD Market for Food & Beverages Industry, By Region, 2014–2023 (USD Million)
Table 59 MMCD Market for Agriculture Industry, By Application, 2014–2023 (USD Million)
Table 60 MMCD Market for Agriculture Industry, By Region, 2014–2023 (USD Million)
Table 61 MMCD Market for Chemicals Industry, By Application, 2014–2023 (USD Million)
Table 62 MMCD Market for Chemicals Industry, By Region, 2014–2023 (USD Million)
Table 63 MMCD Market for Cement Industry, By Application, 2014–2023 (USD Million)
Table 64 MMCD Market for Cement Industry, By Region, 2014–2023 (USD Million)
Table 65 MMCD Market for Other Industries, By Application, 2014–2023 (USD Million)
Table 66 MMCD Market for Other Industries, By Region, 2014–2023 (USD Million)
Table 67 MMCD Market, By Region, 2014–2023 (USD Million)
Table 68 MMCD Market in North America, By Country, 2014–2023 (USD Million)
Table 69 MMCD Market in Europe, By Country, 2014–2023 (USD Million)
Table 70 MMCD Market in Asia Pacific, By Country, 2014–2023 (USD Million)
Table 71 MMCD Market in RoW, By Region, 2014–2023 (USD Million)
Table 72 Ranking of Key Players in the MMCD Market, 2016
List of Figures (72 Figures)
Figure 1 Markets Covered in the Motor Management and Control Device Market Report
Figure 2 Research Design
Figure 3 Motor Management Market Size Estimation Methodology: Bottom-Up Approach
Figure 4 Motor Management Market Size Estimation Methodology: Top-Down Approach
Figure 5 Motor Management Market Breakdown Data Triangulation Approach
Figure 6 Assumptions of the Research Study
Figure 7 Hardware Expected to Hold the Largest Size of the MMCD Market During 2017–2023
Figure 8 Asynchronous Motor Expected to Hold the Largest Share of the MMCD Market During 2017–2023
Figure 9 Automatic Control Expected to Hold the Largest Share of the MMCD Device in During 2017–2023
Figure 10 Low-Voltage Electric Motors Expected to Lead the MMCD Market During the 2017–2023
Figure 11 Pump Application Expected to Dominate the MMCD Market During the 2017–2023
Figure 12 MMCD Market for the Metals & Mining Industry Expected to Grow at the Highest Rate During 2017–2023
Figure 13 Asia Pacific Expected to Dominate the MMCD Market During 2017–2023
Figure 14 Attractive Growth Opportunities in the MMCD Market (2017–2023)
Figure 15 Asynchronous MMCD Market Expected to Grow at A High CAGR Between 2017 and 2023
Figure 16 Low-Voltage Motors Expected to Lead the MMCD Market in 2017
Figure 17 Automatic Motor Management and Controllers Expected to Lead the Market in 2017
Figure 18 Pumps Application Expected to Lead the Motor Management and Controllers Market in 2017
Figure 19 Oil & Gas Industry Expected to Hold the Largest Share of the MMCD Market in 2017
Figure 20 US to Hold the Largest Share of the MMCD Market in 2017
Figure 21 Drivers, Restraints, Opportunities, and Challenges for the MMCD Market
Figure 22 Snapshot: Crude Oil Monthly Price, USD/Barrel (2013–2017)
Figure 23 Motor Management and Control Devices Supply Chain Analysis
Figure 24 Hardware Expected to Hold the Larger Size of the MMCD Market By 2023
Figure 25 Soft Starters With Microcontrollers Expected to Lead the MMCD Hardware Market During the Forecast Period
Figure 26 Sensing & Fault Detection Expected to Hold the Largest Size of the MMCD Software Market Between 2017 and 2023
Figure 27 Asynchronous Motor Expected to Hold the Larger Size of the MMCD Market Between 2017 and 2023
Figure 28 Automatic Control Expected to Hold the Largest Size of the MMCD Market During the Forecast Period
Figure 29 MMCD Market for Low-Voltage Electric Motors Expected to Hold the Largest Market Size By 2023
Figure 30 Pumps Application Expected to Hold the Largest Size of the MMCD Market During the Forecast Period
Figure 31 MMCD Market for Pumps Application in North America Expected to Grow at the Highest CAGR During the Forecast Period
Figure 32 North America Expected Lead the MMCD Market for the Pump Application for the Oil & Gas Industry During the Forecast Period
Figure 33 Asia Pacific to Lead the MMCD Market for the Pumps Application for the Chemicals Industry During the Forecast Period
Figure 34 Europe to Lead the MMCD Market for Pumps for Other Industries During the Forecast Period
Figure 35 Asia Pacific Expected to Lead the MMCD Market for Compressors During the Forecast Period
Figure 36 Asia Pacific to Lead the MMCD Market for Compressors for Metals & Mining Industry During the Forecast Period
Figure 37 APAC to Lead the MMCD Market for the Compressor Application for the Cement Industry During the Forecast Period
Figure 38 APAC to Lead the MMCD Market for the Compressor Application for the Water Supply and Wastewater Treatment Industry During the Forecast Period
Figure 39 APAC to Lead the MMCD Market for the Material Handling Application in Asia Pacific During the Forecast Period
Figure 40 APAC to Lead the MMCD Market for the Material Handling Application for the Metals & Mining Industry During the Forecast Period
Figure 41 APAC to Lead the MMCD Market for the Material Handling Application for the Cement Industry During the Forecast Period
Figure 42 APAC to Witness the Highest CAGR for MMCD in Material Handling in Water Treatment Industry During the Forecast Period
Figure 43 APAC to Lead the MMCD Market for Other Applications for the Power Generation During the Forecast Period
Figure 44 APAC to Lead the MMCD Market for Other Applications for the Cement Industry During the Forecast Period
Figure 45 APAC to Witness the Highest CAGR for MMCD in Other Applications for the Agriculture Industry During the Forecast Period
Figure 46 Metals & Mining Industry Expected to Hold the Largest Size of the MMCD Market By 2023
Figure 47 North America Expected to Dominate the MMCD Market for the Oil & Gas Industry Between 2017 and 2023
Figure 48 MMCD Material Handling Market for the Power Generation Industry to Grow at the Highest CAGR By 2023
Figure 49 MMCD Market for the Water Supply and Wastewater Treatment in Europe Expected to Grow at the Highest Rate By 2023
Figure 50 MMCD Market for Compressors in the Food & Beverages Industry to Grow at the Highest CAGR By 2023
Figure 51 Asia Pacific Expected to Hold the Largest Size of the MMCD Market for the Agriculture Industry During the Forecast Period
Figure 52 North America Expected to Witness the Highest CAGR for the MMCD Market for Cement Industry During the Forecast Period
Figure 53 Rest of APAC to Witness the Highest Growth Rate in the MMCD Market During the Forecast Period
Figure 54 North America: MMCD Market Snapshot
Figure 55 MMCD Market in Europe: Snapshot
Figure 56 Germany Likely to Dominate the European MMCD Market During the Forecast Period
Figure 57 MMCD Market in Asia Pacific: Snapshot
Figure 58 Middle East & Africa to Lead the MMCD Market in RoW During the Forecast Period
Figure 59 Product Development Was the Key Growth Strategy Adopted By the Companies Between 2014 and 2017
Figure 60 Competitive Leadership Mapping, 2017
Figure 61 Market Evolution Framework: New Product Developments Fuelled the Growth of the Motor Management and Control Market
Figure 62 Product Launches & Developments—The Key Strategies Adopted By Players Between 2014 and 2017
Figure 63 ABB Ltd.: Company Snapshot
Figure 64 Analog Devices, Inc.: Company Snapshot
Figure 65 Eaton Corporation: Company Snapshot
Figure 66 General Electric (GE),: Company Snapshot
Figure 67 Hitachi Ltd.: Company Snapshot
Figure 68 Mitsubishi Electric Corporation Company Snapshot
Figure 69 Rockwell Automation: Company Snapshot
Figure 70 Schneider Electric Se: Company Snapshot
Figure 71 Siemens AG: Company Snapshot
Figure 72 Texas Instruments Inc.,: Company Snapshot
The motor management market for control devices and software was valued at USD 2.95 Billion in 2016 and is expected to reach USD 4.03 Billion by 2023, at a CAGR of 5.35% between 2017 and 2023.
The objective of the report is to provide a detailed analysis of the motor management market based on type, product & service, voltage range, control, application, industry, and region. The report provides detailed information regarding the major factors influencing the growth of the motor management market. It also gives a detailed overview of the value chain of the motor management and profiles the market leaders through competitive leadership mapping.
The research methodology used to estimate and forecast the motor management market begins with capturing data on key vendor revenue through secondary sources such as Organization of the Petroleum Exporting Countries (OPEC), Motion Control & Motor Association (MCMA), National Electrical Manufacturers Association (NEMA), press releases, investor relation presentations, annual reports, etc. Vendor offerings are also taken into consideration to determine the market segmentation. The bottom-up approach is employed to arrive at the overall size of the global motor management market from the revenue of key players. After arriving at the overall market size, the total market is split into several segments and subsegments. These are further verified through primary research by conducting extensive interviews with people holding key positions, such as CEOs, VPs, directors, and executives. Market breakdown and data triangulation procedures have been employed to complete the overall market engineering process and arrive at the exact statistics for all the segments and subsegments. The breakdown of the profiles of the primaries is depicted in the following figure:
To know about the assumptions considered for the study, download the pdf brochure
The motor management ecosystem comprises equipment providers, system integrators, software providers, and distributors. Major players involved in the manufacturing of control devices for the motor management market are General Electric (US), Texas Instruments (US), Siemens AG (Germany), Schneider Electric SE (France), ABB Ltd. (Switzerland), Analog Devices, Inc., (US), Eaton Corporation Plc (Ireland), Mitsubishi Electric Corporation (Japan), Rockwell Automation (US), and Hitachi, Ltd (Japan).
Target Audience of the Report:
- Energy efficiency consultancies
- Government and research organizations
- Investors/shareholders
- Manufacturing industries
- Motor control center manufacturers, dealers, and suppliers
- Petroleum companies
- Process industries and power industry associations
- Research organizations and consulting companies
- System integrators
- Technology consultants
- Value added resellers
“This study answers several questions for stakeholders, primarily, which market segments to focus on in the next two to six years for prioritizing efforts and investments.”
Scope of the Report:
This research report categorizes the global motor management market segmented on the basis of type, product & service, voltage range, control, application, industry, and region.
Motor Management Market, by Type
- Synchronous Motor
- Asynchronous Motor
Motor Management Market, by Product & Service
- Hardware
- Software & Solution Services
Motor Management Market, by Voltage Range
- Low Voltage
- Medium Voltage
- High Voltage
Motor Management Market, by Control:
- Automatic
- Semi-Automatic
- Manual
Motor Management Market, by Application
- Pumps
- Compressors
- Material Handling
- Others
Motor Management Market, by Industry
- Oil & Gas
- Metals & Mining
- Power Generation
- Chemicals
- Cement
- Food & Beverages
- Agriculture
- Water Supply and Wastewater Treatment
- Others
Motor Management Market, by Region:
- North America
- Europe
- Asia Pacific (APAC)
- Rest of the World (RoW)
Available Customizations:
With the given market data, MarketsandMarkets offers customizations according to the specific needs of companies. The following customization options are available for the report:
Company Information:
Detailed analysis and profiling of additional market players (up to five)


Growth opportunities and latent adjacency in Motor Management Market