
Energy Efficient Motor Market Size, Share, Growth, Analysis

Energy Efficient Motor Market by Efficiency Level (IE1, IE2, IE3, IE4, IE5), Type (AC, DC), Power Output Rating (<1 kW, 1-2.2 kW, 2.3-375 kW, >375 kW), Application (HVACs, Fans, Pumps, Compressors), End User, and Region - Global Forecast to 2030


OVERVIEW
Source: Secondary Research, Interviews with Experts, MarketsandMarkets Analysis
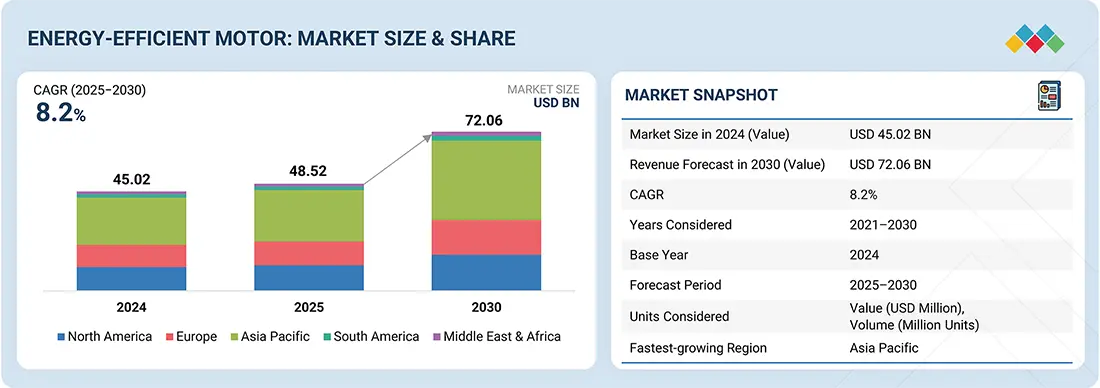
The energy-efficient motor market is projected to reach USD 72.06 billion by 2030 from USD 48.52 billion in 2025, at a CAGR of 8.2% from 2025 to 2030. There is a growing need to use energy-efficient motors due to the growing industrialization, strict government policies on the use of energy, and the rising cost of electricity that leaves industries with no other option but to use efficient technology in an effort to cut down on operational costs and prevent the harmful effects of pollution. These motors help to realize energy loss reduction, decarbonization efforts, and long-term cost savings, and thus increase their popularity with industries like manufacturing, HVAC, and transport. Furthermore, motor technological development and financial offers encourage mass production since corporate organizations are striving to reach sustainability goals and meet changing energy requirements.
Energy Efficient Motor Market Size and Forecast:
- Market Size Value in 2024: USD 45.02 Billion
- Market Size Value in 2025: USD 48.52 Billion
- Revenue Forecast in 2030: USD 72.06 Billion
- Growth Rate: CAGR of 8.2% from 2025 to 2030
- Data available from 2021 to 2030
Energy Efficient Motor Market Trends and Insights
- Market Growth: Energy Efficient Motor Market growth is driven by stringent energy-efficiency regulations, rising industrial automation, and increasing demand for energy-saving equipment.
-
Growing Trends: Industries are increasingly adopting IE3 and IE4 motors to reduce energy consumption and improve operational efficiency.
- Growth Opportunities: Emergence of robotics and automation technologies, HVAC systems, and rising decarbonization initiatives is creating significant Energy Efficient Motor market opportunities.
- Market Share Analysis: The AC motor segment holds the largest Energy Efficient Motor market share due to its widespread use across industrial and commercial applications.
KEY TAKEAWAYS
-
BY END USERThe end-user segment includes industrial, commercial, residential, automotive, agriculture, and aerospace & defense. The industrial end-user segment is driven by automation, high energy consumption, and strict sustainability targets across industries.
-
BY APPLICATIONThe application segment includes HVAC, pumps, fans, compressors, refrigeration, material handling, and material processing. The HVAC segment is driven by increased focus on indoor air quality and energy savings.
-
BY EFFICIENCY LEVELThe efficiency level segment consists of IE2, IE2, IE3, IE4, and IE5. Regulatory mandates and attractive lifecycle savings make IE3 the preferred efficiency class.
-
BY POWER RATINGThe power rating segment includes <1 kW, 1–2.2 kW, 2.2–375 kW, and above 375 kW. The <1 kW power rating has widespread use in residential appliances and office equipment, which ensures segment dominance.
-
BY TYPEThe type segment includes AC motors and DC motors. AC motors dominate due to broad industrial, commercial, and HVAC applications and established power grid compatibility.
-
BY INSTALLATION TYPEThe installation type segment includes open drip proof (ODP) and totally enclosed fan-cooled (TEFC).
-
BY REGIONThe regions considered are North America, Europe, Asia Pacific, South America, and the Middle East & Africa. Asia Pacific leads due to rapid industrialization, the massive manufacturing base, population growth, and government energy efficiency policies and incentives.
-
COMPETITIVE LANDSCAPEMajor market players use organic and inorganic strategies like partnerships and investments to drive growth in energy-efficient motor applications. Companies such as WEG, NIDEC CORPORATION, and SIEMENS, have entered various collaborations, partnerships, and acquisitions to meet the increasing demand for energy-efficient motors in innovative uses.
The projected growth in the demand for energy-efficient motors is a direct result of industrial stakeholders and government agencies trying to realize considerable energy consumption savings, cut back on carbon emissions, and meet the growing efficiency standards. The increased pace of industrialization and urbanization and the growth of applications in the HVAC, automotive, and manufacturing industries are further catalyzing adoption based on sustainability policies, decarbonization measures, and rapid technological changes.
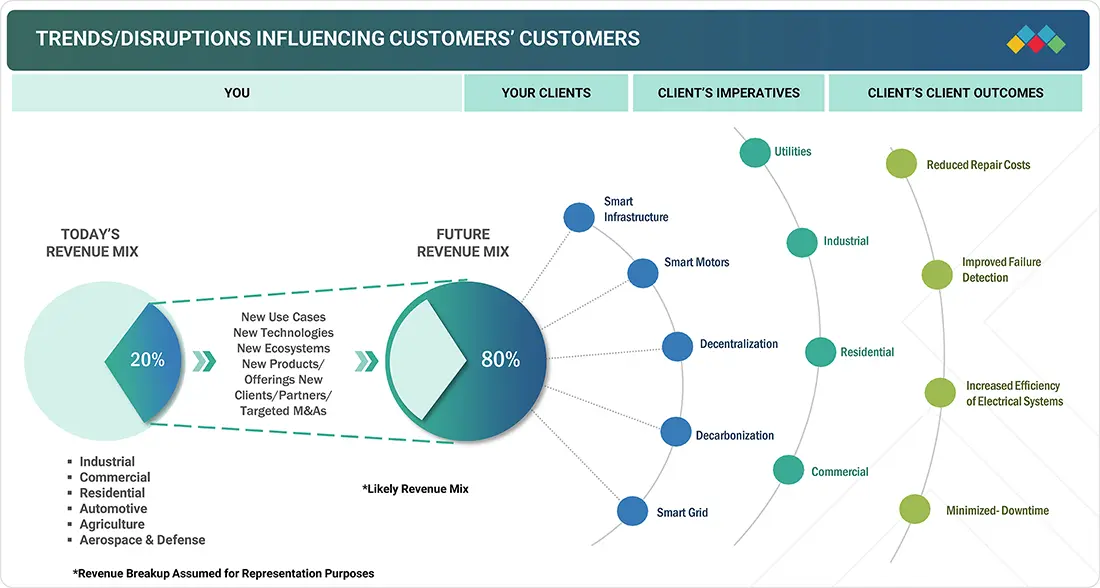
TRENDS & DISRUPTIONS IMPACTING CUSTOMERS' CUSTOMERS
The energy-efficient motor market is projected to grow at a CAGR of 8.2% during the forecast period (by value). Rising decarbonization goals and the increasing demand for renewable energy are driving market expansion. Global government initiatives promoting the adoption of energy-efficient motors are expected to offer significant growth opportunities for market players.
Source: Secondary Research, Interviews with Experts, MarketsandMarkets Analysis
MARKET DYNAMICS
Level
-
Lower life cycle costs than traditional motors

-
Government initiatives encouraging adoption of energy-efficient motors

Level
-
Requirement of superior materials, rigorous testing, and certifications

Level
-
Rising industrialization and decarbonization initiatives

-
Emergence of robotics and automation technologies

Level
-
Limited awareness about benefits of energy-efficient motors

-
Supply chain disruptions

Source: Secondary Research, Interviews with Experts, MarketsandMarkets Analysis
Driver: Lower life cycle costs than traditional motors
The life cycle costs of motors encompass all expenses associated with an asset, from its initial purchase price to its end-of-life disposal. These costs include the purchase price, energy expenses, and maintenance fees. In recent years, the industrial sector has significantly increased its electricity consumption through electric motors. According to ABB, a leading manufacturer of electric motors based in Switzerland, over 40% of the total electricity consumed worldwide is used by the industrial sector, with two-thirds of that consumption attributed to electric motors. This statistic highlights the substantial potential for energy and cost savings through improved efficiency. Investing in energy-efficient motors can lead to significant energy savings and help achieve key efficiency goals. ABB also notes that high-efficiency motors and variable speed drives can save energy, often with a payback period of just 1 to 3 years, and in some cases, the payback period can be as short as a few months. Additionally, energy costs have been rising and are expected to continue increasing in the future. This trend makes it crucial for industries to address energy consumption as a solution to environmental challenges and resource scarcity. Consequently, the price of energy used to operate motors is becoming an increasingly important concern for industries.
Restraint: Requirement of superior materials, rigorous testing, and certifications
Energy-efficient motors generally have a higher initial purchase cost compared to standard motors. This increased price is due to the use of high-quality materials and the optimized design and assembly processes that enhance efficiency. For instance, the rotor of these motors features larger diameter copper wires and additional aluminum to reduce resistance losses. Additionally, winding losses are minimized through the implementation of an optimized cooling fan. The superior materials and advanced manufacturing techniques required for energy-efficient motors lead to higher production costs for manufacturers. This, in turn, increases the prices that consumers must pay. On average, energy-efficient motors can be about 20% more expensive than regular models; however, actual prices may vary based on the manufacturer and market conditions. As a result, the higher purchase cost of energy-efficient motors is a significant barrier, particularly for small-scale users who may not be able to afford to install these motors in their facilities. Consequently, this issue contributes to the slow adoption of energy-saving motors.
Opportunity: Rising industrialization and decarbonization initiatives
Industrialization plays a crucial role in various companies operating in the global marketplace. Over the past decade, developing countries have experienced significant transformations due to the increasing adoption of effective and sustainable energy sources, improved labor productivity, and growth in exports of manufactured goods. The rise in industrialization worldwide is likely to drive the demand for energy-saving motors across a range of industries. As we look toward 2024, the major industrial powers will include China, the US, Japan, Germany, India, South Korea, and the UK, collectively accounting for the majority of global manufacturing output. According to the State Council of China, in 2025, the annual growth rate of value-added industrial output in China was 5.8%, an increase from 4.6% in 2023, with a year-on-year growth of 6.2% recorded in December. Similarly, the US reported a 2.0% annual growth in industrial production by January 2025, while Japan's industrial sector maintained a steady growth rate of 2.6% per year during the same period. India saw a strong recovery with a 5.0% year-on-year increase in January 2025, driven by enhanced manufacturing efforts. In Germany, industrial production increased by 1.2% monthly in May 2025; however, there was a decline of 1.4% in new orders, according to data from CEIC. Furthermore, the push for decarbonization across various industries has heightened the demand for energy-efficient systems and solutions, including electric motors.
Challenge: Limited awareness about benefits of energy-efficient motors
The level of awareness regarding energy-efficient motors among various end users is currently low, but this situation is expected to improve over the next several years. Many end users lack sufficient information about the potential of these motors to save energy and the financial implications of excessive energy use. The challenges in obtaining information stem from a lack of clarity about the efficiency levels of motors, as well as insufficient details on the energy-saving benefits these motors provide. Key barriers to the adoption of energy-efficient motors include a lack of awareness regarding potential savings and returns on investment, along with a tendency to focus on lower upfront costs instead of considering the long-term benefits throughout the motor's lifecycle. As a result, energy-efficient motors have not been widely accepted by end users. However, an increasing wave of information is beginning to clarify these issues, and it is likely to lead to greater adoption of energy-efficient motors in the near future.
energy efficient motor market: COMMERCIAL USE CASES ACROSS INDUSTRIES
| COMPANY | USE CASE DESCRIPTION | BENEFITS |
|---|---|---|
 |
Upgrades rolling mill drives with energy-efficient motors to reduce electricity use | Lower energy bills, reduced emissions |
 |
Implements efficient motors in mineral extraction equipment for continuous operation | Improved reliability, operational cost savings |
 |
Deploys motors in smelting and processing plants to boost productivity | Enhanced uptime, decreased maintenance costs |
Logos and trademarks shown above are the property of their respective owners. Their use here is for informational and illustrative purposes only.
MARKET ECOSYSTEM
The market map provides a quick snapshot of the key stakeholders involved in the energy-efficient motor market, from motor providers and end users to regulatory bodies/standards organizations. This list is not exhaustive and is meant to give an idea of the key market players.
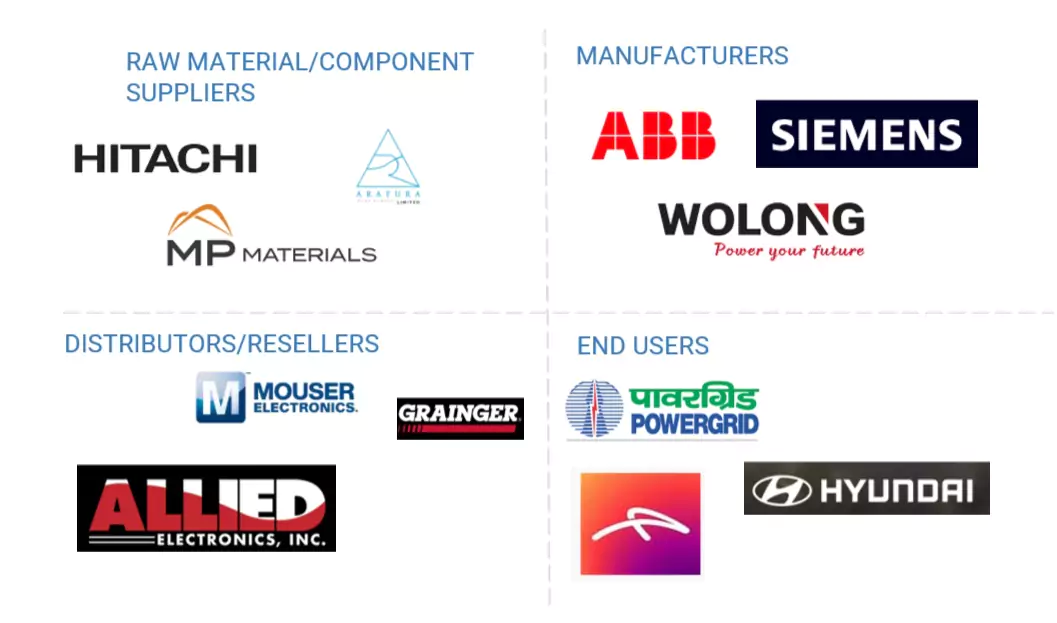
Logos and trademarks shown above are the property of their respective owners. Their use here is for informational and illustrative purposes only.
MARKET SEGMENTS
Source: Secondary Research, Interviews with Experts, MarketsandMarkets Analysis
Energy-efficient Motor Market, By End User
The industrial segment represents the largest potential market for energy-efficient motors. This dominance can be attributed to the high rates of automation in industries, the expanding manufacturing sectors, and the increasing need to reduce operational costs and energy consumption. Energy-efficient motors are particularly essential in industries such as oil and gas, chemicals, automotive, and food processing, where equipment like conveyors, pumps, and compressors are frequently used. Additionally, the growing popularity of smart factories and the implementation of strict energy efficiency policies are driving demand, especially in emerging markets such as China and India.
Energy-efficient Motor Market, By Application
The most popular application segment in the energy-efficient motor market is the pumps segment. Pumps play a very important role in different fields, such as water treatment, oil & gas, agriculture, and HVAC systems, where saving energy is crucial since they must be operational all the time. Energy-efficient motors enhance the performance of pumps by consuming less electricity, which, in turn, lowers the expenditure on maintenance. The increase in demand for clean water and management of industrial fluids has favored the sales of pump motors. Also, technological advances like variable frequency drives are used to optimize pump energy use, which enhance the use of energy-efficient motors in this segment in both the commercial and industrial sectors.
Energy-efficient Motor Market, By Efficiency Level
The IE4 segment is the fastest-growing segment in terms of efficiency levels. IE4 motors, categorized as ultra-premium efficiency motors, experience significantly less energy loss compared to lower IE classes (IE1 to IE3). Their use is becoming increasingly critical for governments and industries that must comply with stricter energy regulations and aim to reduce carbon footprints. These motors are constructed with high-quality materials and are optimized for superior performance, making them more efficient and reliable. The rising emphasis on sustainability, cost reductions, and environmental policies is driving the development of the IE4 segment, particularly in the industrial automation and HVAC markets, both in developed and developing regions.
Energy-efficient Motor Market, By Power Rating
The 375 kW power rating segment is the fastest-growing area in the market. These large-capacity motors are essential for heavy-duty industrial applications, including mining, steel production, oil and gas, and power generation. They are designed to endure severe mechanical and thermal loads while delivering high power output with exceptional reliability. This segment features energy-efficient motors that significantly reduce energy consumption, thereby lowering operational costs and emissions. Increasing investments and modernization efforts in the global infrastructure sector, along with regulatory pressures for sustainable technologies, are driving the demand for 375 kW energy-saving motors in large industries and infrastructures with high performance requirements.
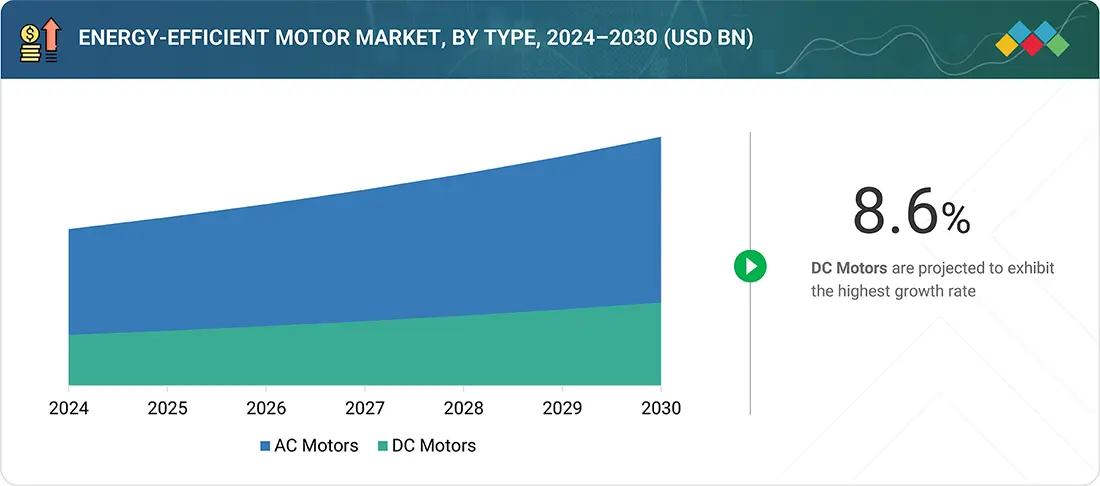
Energy-efficient Motor Market, By Type
The DC motors segment is the fastest-growing type segment in the energy-efficient motor market. DC motors provide high accuracy in controlling speed and torque, making them especially popular in robotics, electric vehicles, and automation. The brushless DC (BLDC) technology is increasingly being used across various applications to enhance efficiency, reduce energy consumption, and lower maintenance needs. Additionally, the use of DC motors as battery-powered and variable-speed technology supports the trend toward electrification in the transport sector and industrial automation. This trend has significantly contributed to the increased adoption of energy-efficient DC motors worldwide.
Energy-efficient Motor Market, By Installation Type
Open Drip Proof (ODP) motors are designed with openings that allow air circulation to cool the motor while preventing larger droplets from entering. These motors are intended for use indoors and in clean environments where ventilation is essential. ODP motors are economical and commonly used in light-duty industrial processes, but they require protective maintenance in damp or dusty conditions. On the other hand, Totally Enclosed Fan-Cooled (TEFC) motors feature completely sealed enclosures to prevent the entry of dust, dirt, and moisture. Cooling is facilitated by an external fan. TEFC motors are suitable for harsh environments, outdoor applications, and situations that demand resistance to contamination. Their robust design contributes to their longevity and reliability, making them popular in heavy industries where durable energy-saving motor installations are necessary.
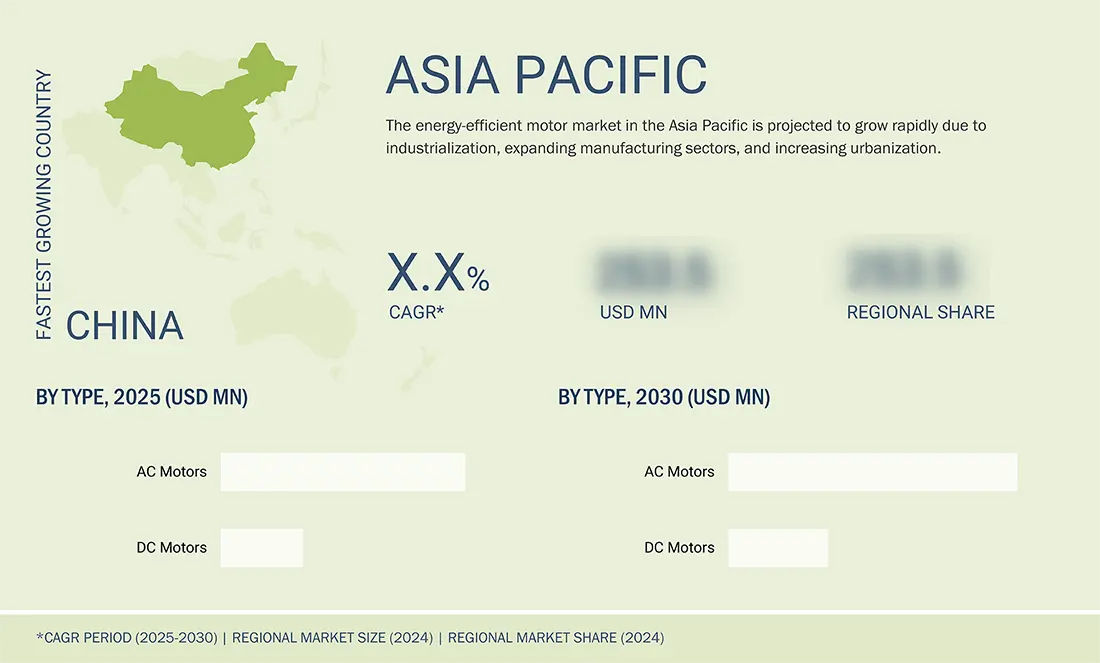
REGION
Asia Pacific to be the fastest-growing region in the global energy-efficient motor market during the forecast period
The Asia Pacific is currently the fastest-growing market for energy-efficient motors, driven by rapid industrialization, expanding manufacturing industries, and increasing urbanization. Governments in the region are promoting energy efficiency through regulations and incentives aimed at reducing carbon emissions. The region's large population contributes to a high demand for energy, which encourages the adoption of efficient technologies. Countries like China, India, Japan, and South Korea are making significant investments in infrastructure, renewable energy, and smart manufacturing. Additionally, there is growing awareness of the cost savings and sustainability benefits associated with energy-efficient operations. As a result, many industries are replacing traditional motors with energy-saving alternatives, leading to a notable increase in market growth for energy-efficient motors in the Asia Pacific.
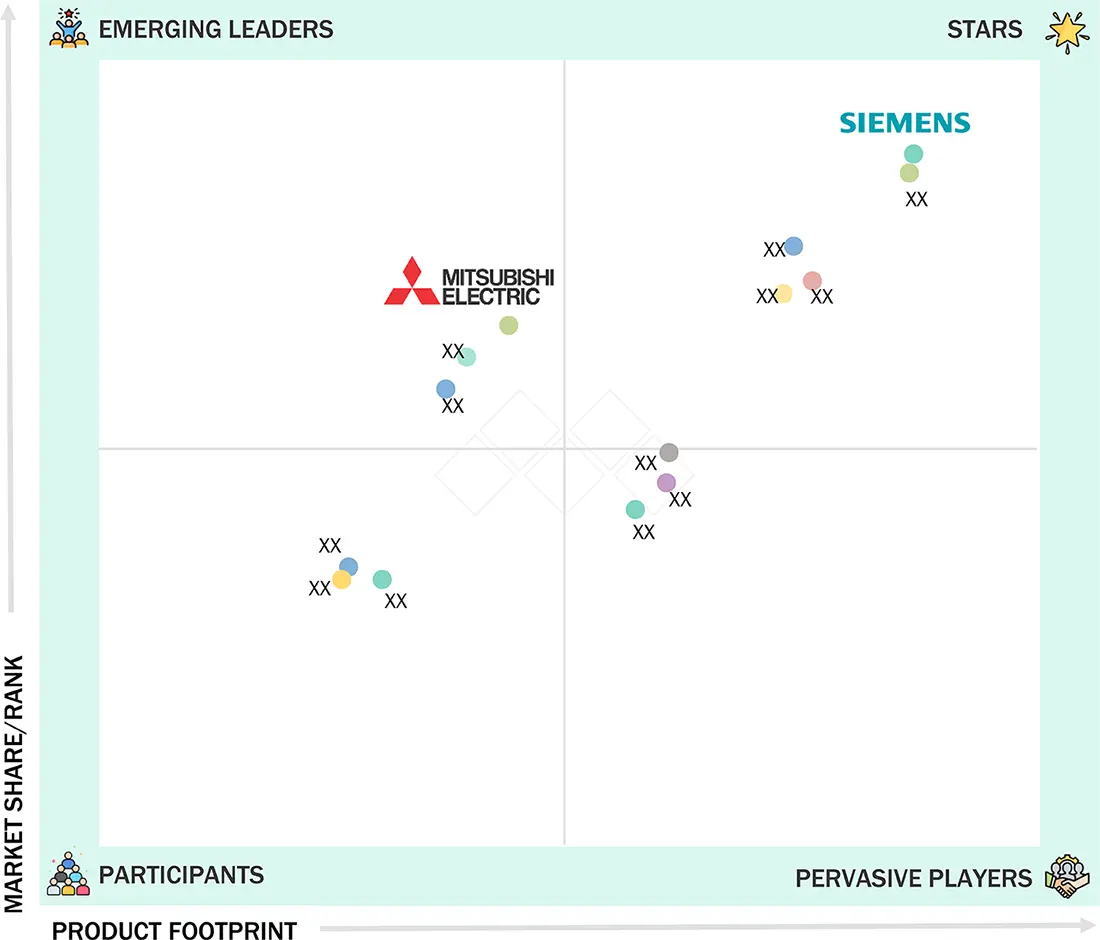
energy efficient motor market: COMPANY EVALUATION MATRIX
In the energy-efficient motor market, Regal Rexnord Corporation is a dominant player, classified as a "Star" due to its strong market presence and extensive product portfolio. This positions the company to facilitate large-scale adoption across various industries, including industrial and commercial sectors. On the other hand, Mitsubishi Electric Corporation is recognized as an "Emerging Leader," gaining momentum with its high-efficiency industrial motors and energy-saving ozone generators. While Regal Rexnord Corporation leads in scale, Mitsubishi Electric Corporation demonstrates significant growth potential, positioning itself to advance toward the leaders' quadrant.
Source: Secondary Research, Interviews with Experts, MarketsandMarkets Analysis
KEY MARKET PLAYERS
MARKET SCOPE
| REPORT METRIC | DETAILS |
|---|---|
| Market Size in 2024 (Value) | USD 45.02 Billion |
| Market Forecast in 2030 (Value) | USD 72.06 Billion |
| Growth Rate | CAGR 8.2% from 2025–2030 |
| Years Considered | 2021–2030 |
| Base Year | 2024 |
| Forecast Period | 2025–2030 |
| Units Considered | Value (USD Million), Volume (Million Units) |
| Report Coverage | Revenue forecast, company ranking, competitive landscape, growth factors, and trends |
| Segments Covered |
|
| Regions Covered | North America, Europe, Asia Pacific, South America, and the Middle East & Africa |
WHAT IS IN IT FOR YOU: energy efficient motor market REPORT CONTENT GUIDE
DELIVERED CUSTOMIZATIONS
We have successfully delivered the following deep-dive customizations:
| CLIENT REQUEST | CUSTOMIZATION DELIVERED | VALUE ADDS |
|---|---|---|
| End User & Application Segmentation |
|
|
RECENT DEVELOPMENTS
- May 2025 : Bharat Bijlee (India) reached an important milestone by delivering a batch of 3.3 kV Closed Air Circuit Air-Cooled (CACA) medium-voltage motors. This batch includes two units each in the 355 and 400 frame sizes, which were provided to Madhya Pradesh Jal Nigam (MPJN) through a prominent pump OEM and EPC partner. From an analyst's perspective, this achievement is a significant step towards meeting the growing demand for high-power motor solutions in the infrastructure and utility sectors.
- October 2024 : ABB (Switzerland) introduced a new brand positioning and tagline: "Engineered to Outrun." This shift emphasizes the company's strategic focus on electrification and automation. The new positioning highlights ABB's commitment to helping industries operate more efficiently by improving productivity through automation and reducing environmental impact by promoting electrification for decarbonization. This refreshed brand identity aligns with ABB's mission to create a more sustainable and resource-efficient future through its technological leadership and decentralized operating model.
- June 2024 : WEG introduced the W01 line, which provides additional benefits compared to its well-known sheet metal frame motors. These open motors are available in NEMA frame sizes 42, 48, and 56. They feature a new design that offers numerous advantages while maintaining the durability and quality that WEG is renowned for.
- September 2023 : Regal Rexnord Corporation (US) entered into an agreement to sell its Industrial Motors and Generators businesses—representing the majority of its Industrial Systems segment—to WEG, a company located in Brazil. This transaction will be conducted through certain subsidiaries of WEG, with a total consideration of USD 400 million.
- June 2023 : Nidec Corporation (Japan) developed a proof of concept for an Intelligent Motor solution. This system aims to enhance Intelligent Motors by incorporating microcomputers, data coupling, and time synchronization functions. As a result, products equipped with these Intelligent Motors will be able to connect to a digital twin.
Table of Contents
 Exclusive indicates content/data unique to MarketsandMarkets and not available with any competitors.
Methodology
The study involved major activities in estimating the current size of the energy efficient motor market. Exhaustive secondary research was done to collect information on the peer and parent markets. The next step was to validate these findings, assumptions, and sizing with industry experts across the value chain through primary research. Both top-down and bottom-up approaches were employed to estimate the complete market size. Thereafter, market breakdowns and data triangulation were used to estimate the market size of the segments and subsegments.
Secondary Research
This research study on the energy efficient motor market involved the use of extensive secondary sources, directories, and databases, such as Hoovers, Bloomberg, Businessweek, Factiva, International Energy Agency, and BP Statistical Review of World Energy, to identify and collect information useful for a technical, market-oriented, and commercial study of the global energy efficient motor market. The other secondary sources included annual reports, press releases, investor presentations of companies, white papers, certified publications, articles by recognized authors, manufacturer associations, trade directories, and databases.
Primary Research
The energy efficient motor market comprises several stakeholders, such as energy efficient motor manufacturers, manufacturers of energy efficient motor infrastructure components, technology providers, and technology support providers in the supply chain. The demand side of this market is characterized by the rising demand for energy efficient motors in nations to reduce energy consumption and move toward decarbonization. The supply side is characterized by rising demand for contracts from the industries, and mergers & acquisitions among big players. Various primary sources from the supply and demand sides of the market were interviewed to obtain qualitative and quantitative information. The following is the breakdown of primary respondents:

Note: Other designations include sales managers, engineers, and regional managers.
The tiers of the companies are defined based on their total revenue as of 2024: Tier 1: >USD 1 billion, Tier 2:
USD 500 million–1 billion, and Tier 3:
To know about the assumptions considered for the study, download the pdf brochure
Market Size Estimation
Top-down and bottom-up approaches were used to estimate and validate the size of the energy efficient motor market and its dependent submarkets. Key players in the market were identified through secondary research, and their market share in the respective regions was obtained through primary and secondary research. The research methodology includes studying top market players’ annual and financial reports and interviews with industry experts, such as chief executive officers, vice presidents, directors, sales managers, and marketing executives, for key quantitative and qualitative insights related to the energy efficient motor market.
Energy Efficient Motor Market : Top-Down and Bottom-Up Approach

Data Triangulation
After arriving at the overall market size from the estimation process explained above, the total market has been split into several segments and subsegments. To complete the overall market engineering process and arrive at the exact statistics for all the segments and subsegments, the data triangulation and market breakdown processes have been employed, wherever applicable. The data has been triangulated by studying various factors and trends from the demand and supply sides. Along with this, the market has been validated using both the top-down and bottom-up approaches.
Market Definition
The energy efficient motor market consists of all business enterprises dealing with electric motors to reduce energy use and preserve or enhance performance. These motors meet global efficiency requirements, such as IE2, IE3, IE4, and IE5, and are designed to minimize energy wastage by improving their development, material, and controls. However, compared with conventional motors, energy-efficient motors have greater operational efficiency, less heat production, and lower carbon emissions. This market caters to the needs of manufacturing, distribution, and use of such motors in major sectors, such as industrial manufacturing, HVAC, water & wastewater treatment, transportation, and building automation. The strong energy efficiency regulation, electricity price increment, and the growing prominence of sustainability and decarbonization within the global industrial processes contribute to the market growth.
Stakeholders
- Motor Manufacturing Companies
- Energy Efficient Motor Manufacturers Associations
- Government & Research Organizations
- Institutional Investors
- Investors/Shareholders
- Electric Motors Manufacturers, Dealers, and Suppliers
- Consulting Companies
- Automotive Manufacturers
- Electronic Equipment Manufacturers
- Food & Beverage, Textile, and Pulp & Paper Companies
- Motor Part and Component Suppliers
Report Objectives
- To define, describe, segment, and forecast the energy efficient motor market size, by installation type, type, power output rating, efficiency level, end user, and application
- To provide detailed information on the major drivers, restraints, opportunities, and challenges influencing the growth of the energy efficient motor market
- To strategically analyze the energy efficient motor market with respect to individual growth trends, prospects, and contributions of each segment to the market
- To analyze market opportunities for stakeholders and provide a detailed competitive landscape for market leaders
- To forecast the revenue of the market segments with respect to five main regions (along with countries), namely North America, Europe, Asia Pacific, South America, and the Middle East & Africa
- To strategically profile key players and comprehensively analyze their market ranking and core competencies
- To track and analyze competitive developments, such as new product developments, agreements, investments & expansions, and acquisitions, in the energy efficient motor market
Available Customizations
MarketsandMarkets offers customizations according to the specific needs of the companies using the given market data.
The following customization options are available for the report:
Product Analysis
- Product matrix, which gives a detailed comparison of the product portfolio of each company
Geographic Analysis as per Feasibility
- Further breakdown of the energy efficient motor market, by country
Company Information
- Detailed analysis and profiling of additional market players (up to five)
Key Questions Addressed by the Report
What was the size of the energy efficient motor market in 2025?
The market size of the global energy efficient motor market was USD 48.52 billion in 2025.
What are the major drivers for the energy efficient motor market?
The growth of the energy efficient motor market can be attributed to the supportive government regulations pertaining to decarbonization.
Which is the fastest-growing region in the energy efficient motor market during the forecast period?
Asia Pacific is expected to be the largest market region for the global energy efficient motor market between 2021 and 2030, due to the implementation of minimum energy performance standards or labeling programs for electric motors.
Which is the fastest-growing segment, by application, during the forecast period?
By application, the pumps segment is expected to grow as they are commonly used for commercial and industrial applications due to strict energy efficiency standards in developed countries.
Which is the fastest-growing segment, by power rating, in the energy efficient motor market?
By power rating, the >375 segment is projected to exhibit a considerable CAGR during the forecast period. These motors are engineered to withstand heavy loads and function efficiently in challenging environments.
Need a Tailored Report?
Customize this report to your needs
Get 10% FREE Customization
Customize This ReportPersonalize This Research
- Triangulate with your Own Data
- Get Data as per your Format and Definition
- Gain a Deeper Dive on a Specific Application, Geography, Customer or Competitor
- Any level of Personalization
Let Us Help You
- What are the Known and Unknown Adjacencies Impacting the Energy Efficient Motor Market
- What will your New Revenue Sources be?
- Who will be your Top Customer; what will make them switch?
- Defend your Market Share or Win Competitors
- Get a Scorecard for Target Partners

Custom Market Research Services
We Will Customise The Research For You, In Case The Report Listed Above Does Not Meet With Your Requirements
Get 10% Free CustomisationTESTIMONIALS

Kimberly Murphy
GLOBAL MARKETING DIRECTOR
Bently Nevada,
Leading Condition Monitoring & Asset Protectionwww.bakerhughesds.com/bently-nevada

MarketsandMarkets™ showed consistent rigor for success and relentlessly worked with Bently Nevada stakeholders to positively impact go-to-market strategy. Their proactiveness and flexibility has been instrumental in achieving the objectives to grow our sales pipeline in key industrial markets.

DARRICK HUEBER
Business Development Leader
Nexus Controls LLC,
Leading Manufacturer of Automation System & Electrical Panelswww.bakerhughesds.com/nexus-controls

We partnered with MarketsandMarkets to expand our business further by tapping into new industrial segments. It was critical for us to gather crucial business insights about specific markets to achieve this goal. MarketsandMarkets engagement model and client services helped us provide those insights, it was really impressive and valuable for my business. The team was extremely flexible and helpful.

Mike Schoff
Global Industrial Commercial Strategy Leader
Nexus Controls LLC
Leading Manufacturer of Automation System & Electrical Panelswww.bakerhughesds.com/nexus-controls
We consulted MarketsandMarkets for potential Partner Identification. Overall, it was a good experience. The insights provided through interviews conducted by the team helped us put together the questionnaire required for discussion with the selected partners. Their ability to provide insights through interviews with customers in a timely manner was quite impressive.
Growth opportunities and latent adjacency in Energy Efficient Motor Market


User
Sep, 2019
Hello, I hope this finds you well. I am exploring research on two-digit frame size electric motors in the range of less than 1 hp, to 5 hp. As such, I have some follow-up questions related to the Markets and Markets Energy Efficient Motors Market Study: 1. To what level of detail does the research report categorize AC and DC induction and synchronous motors? E.g., how does Markets and Markets disaggregate motor products beyond the following products: (Synchronous (Reluctance, Permanent Magnet), Asynchronous (Squirrel Cage, Wound Rotor), DC Motor (Brushless, Brushed)). 2. Does Markets and Markets publish a related study, just concentrated on the U.S. Market? If not, is it possible to only purchase select chapters related to the U.S. Market? 3, Are market shipments data provided in dollar investment value or in quantity? 4. Does the study include further analyses on each motor product, e.g. pole configuration, enclosure type? 5. What are the major sources that Markets and Markets references to make analyses? Many thanks, Erica.
User
Sep, 2019
Hello, I want to buy a study on technical analysis of kinds of motors with various power loads and what is the market potential of these motors for different power. Also, let me know if you can cover comparative information of performance of these energy efficient motors with v.f.d.s with respect to that with conventional motors..
User
Sep, 2019
We have specific interest of Line Start IE4 Motors as per IEC 60034-30-1 July14. I would like to know who are the manufacturers of these motors and what are its types? I am keen to understand the compliance requirement in APAC region for industrial motors, especially for harsh environment..
User
Nov, 2019
I'd like a sample (and chart) from the report for publishing on our news site - something of interest to energy managers who want to find energy efficient motors. The market opportunity in number, trends, and key player sample data will be helpful for understanding your report structure..
Nimai
May, 2026
Looking to understand global energy efficient market split of industrial motors .
User
Mar, 2019
We are trying to penetrate the industrial market in China with motors specific to manufacturing plants. Will this report help us understand the opportunity in China? But We haven't established the company and have no income from the region. Could we get the partial data from the report as we are low on budget? Thanks for your time. Best regards..