Non-Conductive Ink Market by Substrate (Glass, Ceramic, Acrylic), Application (PCB Panels, PV Panels, Led Packaging), and Region (North America, Europe, APAC, Middle East & Africa, South America) - Global Forecast to 2024


[89 Pages Report] The global non-conductive ink market is estimated to be USD 403 million in 2019 and is projected to reach USD 560 million by 2024, at a CAGR of 7.0% during the same period. The demand for non-conductive inks is driven mainly by its growing demand in printed circuit boards.
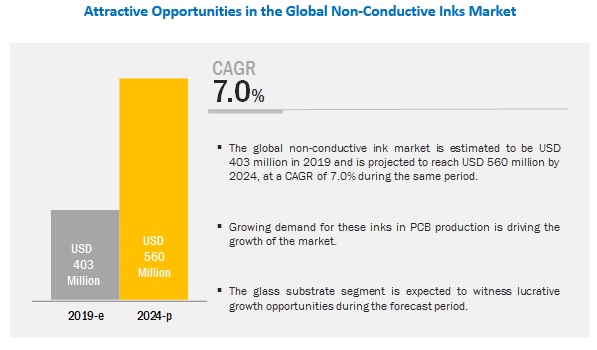
By substrate, glass is expected to be the fastest-growing segment of the market during the forecast period
The growth of the segment is attributed mainly to the increased usage of glass in the electronics industry where these substrates are preferred commonly in displays and photovoltaics. The growing electronic & electrical industry is further expected to drive the demand for non-conductive inks in this segment.
By application, PCB panels application accounted for the largest market share during the forecast period.
The growth of the segment is attributed mainly to the growing production of PCB panels in emerging economies such as China, Taiwan, and India. Furthermore, the increasing usage of PCB panels in medical devices, consumer electronics, automotive, aerospace, and lighting applications. The growth of these industries is expected to drive the non-conductive inks market.
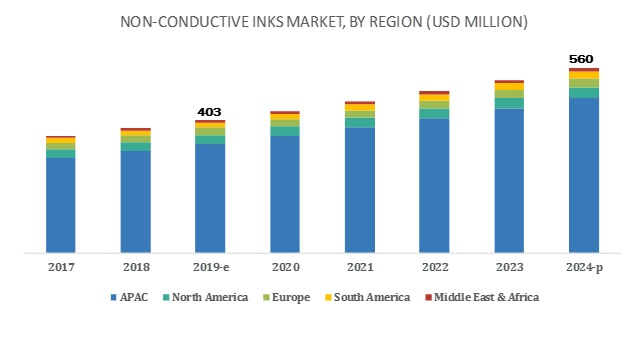
Asia Pacific is expected to be the largest market during the forecast period.
The non-conductive ink market has been studied for Asia Pacific, North America, Europe, South America, and the Middle East & Africa. The Asia Pacific non-conductive ink market is projected to register the highest CAGR during the forecast period, in terms of value. China, India, and Japan are the major consumer of non-conductive ink in APAC.
Key Market Players
DowDuPont (US), Henkel AG & Co. KGaA (Germany), Teikoku Printing Inks Mfg. Co., Ltd (Japan), Applied Cavitation Incorporated (US), Poly-Ink (France), Sun Chemical Corporation (US), NovaCentrix (US), Creative Materials Inc. (US), Applied Ink Solutions (US), and Vorbeck Materials (US), are the leading manufacturers of non-conductive ink globally. Diversified product portfolios, high depth in application reach, and technical assistance to customers are factors responsible for strengthening the position of these companies in the non-conductive ink market.
Scope of the Report:
|
Report Metric |
Details |
|
Market size available for years |
2017�2024 |
|
Base year |
2018 |
|
Forecast period |
2019�2024 |
|
Units considered in the report |
Value (USD Million) |
|
Segments |
Substrate, Application, and Region |
|
Geographies |
North America, APAC, Europe, Middle East & Africa, and South America |
|
Companies |
DowDuPont (US), Henkel AG & Co. KGaA (Germany), Teikoku Printing Inks Mfg. Co., Ltd (Japan), Applied Cavitation Incorporated (US), Poly-Ink (France), Sun Chemical Corporation (US), NovaCentrix (US), Creative Materials Inc. (US), Applied Ink Solutions (US), and Vorbeck Materials (US), |
This report categorizes the non-conductive ink market based on technology and region.
Non-conductive ink Market, by Substrate:
- Glass
- Ceramic
- Acrylic
- Others ( polyamide, polyethylene)
Non-conductive ink Market, by Application:
- PCB Panels
- PV Panels
- LED Packaging
- Others (sensors & transducers, displays, and actuators)
Non-conductive ink Market, by Region:
- APAC
- North America
- Europe
- South America
- Middle East & Africa
Key questions addressed by the report
- Which are the future revenue pockets in the non-conductive ink market?
- Which key developments are expected to have a high impact on the market?
- Which products/technologies are expected to overpower the existing technologies?
- How the regulatory scenario further is expected to impact the market?
- What will be the future product mix in the non-conductive ink market?
- What are the prime strategies of leaders in the market?
To speak to our analyst for a discussion on the above findings, click Speak to Analyst
 Exclusive indicates content/data unique to MarketsandMarkets and not available with any competitors.
Table of Contents
1 Introduction (Page No. - 13)
1.1 Objectives of the Study
1.2 Market Definition
1.3 Market Scope
1.3.1 Market Segmentation
1.3.2 Regions Covered
1.3.3 Years Considered for the Study
1.4 Currency
1.5 Unit Considered
1.6 Stakeholders
2 Research Methodology (Page No. - 16)
2.1 Research Data
2.1.1 Secondary Data
2.1.2 Key Data From Secondary Sources
2.1.3 Primary Data
2.1.4 Key Data From Primary Sources
2.1.4.1 Key Industry Insights
2.1.4.2 Breakdown of Primary Interviews
2.2 Market Size Estimation
2.2.1 Bottom-Up Approach
2.2.2 Top-Down Approach
2.3 Data Triangulation
2.4 Assumptions and Limitations
2.4.1 Assumptions
2.4.2 Limitations
3 Executive Summary (Page No. - 24)
4 Premium Insights (Page No. - 27)
4.1 Significant Opportunities in the Non-Conductive Inks Market
4.2 Non-Conductive Inks Market, By Substrate
4.3 Non-Conductive Inks Market, By Application and Region
4.4 Non-Conductive Inks Market, By Country
5 Market Overview (Page No. - 29)
5.1 Introduction
5.2 Market Dynamics
5.2.1 Drivers
5.2.1.1 Growth in PCBs Production
5.2.2 Restraints
5.2.2.1 Fluctuation in Raw Materials Prices
5.2.3 Opportunities
5.2.3.1 Industrial Growth in APAC
5.2.4 Challenges
5.2.4.1 Dearth of Technical Know-How and Highly Skilled System Integrators
5.3 Porter�s Five Forces Analysis
5.3.1 Threat of New Entrants
5.3.2 Threat of Substitutes
5.3.3 Bargaining Power of Suppliers
5.3.4 Bargaining Power of Buyers
5.3.5 Intensity of Competitive Rivalry
5.4 Macroeconomic Indicators
6 Non-Conductive Inks Market, By Substrate (Page No. - 34)
6.1 Introduction
7 Non-Conductive Inks Market, By Application (Page No. - 36)
7.1 Introduction
7.2 PCB Panels
7.2.1 The Growing Electronics Industry is Increasing the Demand for Non-Conductive Inks
7.3 Pv Panels
7.3.1 Increasing Pv Panel Installations in APAC is Influencing the Non-Conductive Inks Market Growth
7.4 Led Packaging
7.4.1 Growing Demand for Consumer Products is Widening the Use of Non-Conductive Inks in Led Packaging
7.5 Others
8 Non-Conductive Inks Market, By Region (Page No. - 39)
8.1 Introduction
8.2 North America
8.2.1 Us
8.2.1.1 Increased Demand From Various Applications is Expected to Drive the Market of Non-Conductive Inks in the US
8.2.2 Mexico
8.2.2.1 The Growing Electronics Industry Will Propel the Market Growth of Non-Conductive Inks
8.2.3 Canada
8.2.3.1 Improving Manufacturing Sector in Canada is Boosting the Growth of the Non-Conductive Inks Market
8.3 APAC
8.3.1 China
8.3.1.1 PCB Panels and Led Packaging Applications are Driving the Non-Conductive Inks Market
8.3.2 Japan
8.3.2.1 Demand for Non-Conductive Inks in Japan is Driven By PCB and Pv Panels Applications
8.3.3 India
8.3.3.1 Increasing Demand for Non-Conductive Inks From the Electronics and Automotive Industries Will Boost the Market Growth
8.3.4 South Korea
8.3.4.1 PCB Panels Application Will Augment the Growth of the Non-Conductive Inks Market in the Country
8.3.5 Taiwan
8.3.5.1 Increase in Demand From End-Use Applications Will Drive the Growth of Non-Conductive Inks
8.3.6 Rest of APAC
8.4 Europe
8.4.1 Germany
8.4.1.1 Increase in PCB Manufacturing in the Country Will Drive the Demand for Non-Conductive Inks
8.4.2 UK
8.4.2.1 The Non-Conductive Inks Market in the UK is Driven By PCB and Pv Panels Applications
8.4.3 France
8.4.3.1 A Diversified Economy and the Improving Automotive Industry are Contributing Toward the Growth of the Non-Conductive Inks Market
8.4.4 Russia
8.4.4.1 Presence of A Large Number of PCB Manufacturers is Increasing the Demand for Non-Conductive Inks
8.4.5 Turkey
8.4.5.1 Electronics Industry to Drive the Non-Conductive Inks Market
8.4.6 Rest of Europe
8.5 South America
8.5.1 Brazil
8.5.1.1 Improved Economy of the Country Will Drive the Non-Conductive Inks Market
8.5.2 Argentina
8.5.2.1 The Automotive Industry Will Drive the Market for Non-Conductive Inks in Argentina
8.5.3 Rest of South America
8.6 Middle East & Africa
8.6.1 Saudi Arabia
8.6.1.1 Improved Government Spending Boosts the Growth of the Non-Conductive Inks Market
8.6.2 UAE
8.6.2.1 Increased Demand From Various End-Use Applications Will Drive The Market Of Non-Conductive Inks
8.6.3 Rest of the Middle East & Africa
8.6.3.1 Rising Industrial Activities are Expected to Drive the Market of Non-Conductive Inks
9 Competitive Landscape (Page No. - 71)
9.1 Introduction
9.2 Market Ranking of Key Players
9.3 Competitive Scenario
9.3.1 New Product Launch
9.3.2 Collaboration
10 Company Profiles (Page No. - 74)
(Business Overview, Products Offered, Recent Developments, SWOT Analysis, MnM View)*
10.1 Henkel AG & Co. KGAA
10.2 Nagase & Co., Ltd
10.3 Teikoku Printing Inks Mfg. Co., Ltd
10.4 Applied Cavitation Inc.
10.5 Applied Ink Solutions
10.6 Snab Graphix India Private Limited
*Details on Business Overview, Products Offered, Recent Developments, SWOT Analysis, MnM View Might Not Be Captured in Case of Unlisted Companies.
11 Appendix (Page No. - 84)
11.1 Discussion Guide
11.2 Knowledge Store: Marketsandmarkets Subscription Portal
11.3 Available Customizations
11.4 Related Reports
11.5 Author Details
List of Tables (65 Tables)
Table 1 Real Gdp Growth of Major Countries, 2014�2019
Table 2 Non-Conductive Inks Market Size, By Substrate, 2017�2024 (USD Million)
Table 3 Non-Conductive Ink Market Size, By Application, 2017�2024 (USD Million)
Table 4 Non-Conductive Inks Market Size, By Region, 2017�2024 (USD Million)
Table 5 Non-Conductive Ink Market Size, By Substrate, 2017�2024 (USD Million)
Table 6 Non-Conductive Inks Market Size, By Application, 2017�2024 (USD Million)
Table 7 North America: Non-Conductive Ink Market Size, By Country, 2017�2024 (USD Million)
Table 8 North America: Non-Conductive Inks Market Size, By Substrate, 2017�2024 (USD Million)
Table 9 North America: Non-Conductive Ink Market Size, By Application, 2017�2024(USD Million)
Table 10 US: Non-Conductive Inks Market Size, By Substrate, 2017�2024 (USD Million)
Table 11 US: Non-Conductive Ink Market Size, By Application, 2017�2024 (USD Million)
Table 12 Mexico: Non-Conductive Inks Market Size, By Substrate, 2017�2024 (USD Million)
Table 13 Mexico: Non-Conductive Ink Market Size, Application, 2017�2024 (USD Million)
Table 14 Canada: Non-Conductive Inks Market Size, By Substrate, 2017�2024 (USD Million)
Table 15 Canada: Non-Conductive Ink Market Size, By Application, 2017�2024 (USD Million)
Table 16 APAC: Non-Conductive Inks Market Size, By Country, 2017�2024 (USD Million)
Table 17 APAC: Non-Conductive Ink Market Size, By Substrate, 2017�2024 (USD Million)
Table 18 APAC: Non-Conductive Inks Market Size, By Application, 2017�2024 (USD Million)
Table 19 China: Non-Conductive Ink Market Size, By Substrate, 2017�2024 (USD Million)
Table 20 China: Non-Conductive Inks Market Size, By Application, 2017�2024 (USD Million)
Table 21 Japan: Non-Conductive Ink Market Size, By Substrate, 2017�2024 (USD Million)
Table 22 Japan: Non-Conductive Inks Market Size, By Application, 2017�2024 (USD Million)
Table 23 India: Non-Conductive Ink Market Size, By Substrate, 2017�2024 (USD Million)
Table 24 India: Non-Conductive Inks Market Size, By Application, 2017�2024 (USD Million)
Table 25 South Korea : Non-Conductive Ink Market Size, By Substrate, 2017�2024 (USD Million)
Table 26 South Korea: Non-Conductive Inks Market Size, By Application, 2017�2024 (USD Million)
Table 27 Taiwan: Non-Conductive Ink Market Size, By Substrate, 2017�2024 (USD Million)
Table 28 Taiwan: Non-Conductive Inks Market Size, By Application, 2017�2024 (USD Million)
Table 29 Rest of APAC: Non-Conductive Ink Market Size, By Substrate, 2017�2024 (USD Million)
Table 30 Rest of APAC: Non-Conductive Inks Market Size, By Application, 2017�2024 (USD Million)
Table 31 Europe: Non-Conductive Ink Market Size, By Country, 2017�2024 (USD Million)
Table 32 Europe: Non-Conductive Inks Market Size, By Substrate, 2017�2024 (USD Million)
Table 33 Europe: Non-Conductive Ink Market Size, By Application, 2017�2024 (USD Million)
Table 34 Germany: Non-Conductive Inks Market Size, By Substrate, 2017�2024 (USD Million)
Table 35 Germany: Non-Conductive Ink Market Size, By Application, 2017�2024 (USD Million)
Table 36 UK: Non-Conductive Inks Market Size, By Substrate, 2017�2024 (USD Million)
Table 37 UK: Non-Conductive Ink Market Size, By Application, 2017�2024 (USD Million)
Table 38 France: Non-Conductive Inks Market Size, By Substrate, 2017�2024 (USD Million)
Table 39 France: Non-Conductive Ink Market Size, Application, 2017�2024 (USD Million)
Table 40 Russia: Non-Conductive Inks Market Size, By Substrate, 2017�2024 (USD Million)
Table 41 Russia: Non-Conductive Ink Market Size, By Application, 2017�2024 (USD Million)
Table 42 Turkey: Non-Conductive Inks Market Size, By Substrate, 2017�2024 (USD Million)
Table 43 Turkey : Non-Conductive Ink Market Size, By Application, 2017�2024 (USD Million)
Table 44 Rest of Europe: Non-Conductive Inks Market Size, By Substrate, 2017�2024 (USD Million)
Table 45 Rest of Europe: Non-Conductive Ink Market Size, Application, 2017�2024(USD Million)
Table 46 South America: Non-Conductive Inks Market Size, By Country, 2017�2024 (USD Million)
Table 47 South America: Non-Conductive Ink Market Size, By Substrate, 2017�2024 (USD Million)
Table 48 South America: Non-Conductive Inks Market Size, By Application, 2017�2024 (USD Million)
Table 49 Brazil: Non-Conductive Ink Market Size, By Substrate, 2017�2024 (USD Million)
Table 50 Brazil: Non-Conductive Inks market Size, By Application,2017�2024 (USD Million)
Table 51 Argentina: Non-Conductive Ink market Size, By Substrate, 2017�2024 (USD Million)
Table 52 Argentina: Non-Conductive Inks market Size, By Application, 2017�2024 (USD Million)
Table 53 Rest of South America: Non-Conductive Ink Market Size, By Substrate, 2017�2024 (USD Million)
Table 54 Rest of South America: Non-Conductive Inks Market Size, By Application, 2017�2024(USD Million)
Table 55 Middle East & Africa: Non-Conductive Ink Market Size, By Country, 2017�2024 (USD Million)
Table 56 Middle East & Africa: Non-Conductive Inks Market Size, By Substrate, 2017�2024 (USD Million)
Table 57 Middle East and Africa: Non-Conductive Ink Market Size, By Application, 2017�2024 (USD Million)
Table 58 Saudi Arabia: Non-Conductive Inks Market Size, By Substrate, 2017�2024 (USD Million)
Table 59 Saudi Arabia: Non-Conductive Ink Market Size, By Application, 2017�2024 (USD Million)
Table 60 UAE: Non-Conductive Inks Market Size, By Substrate, 2017�2024 (USD Million)
Table 61 UAE: Non-Conductive Ink market Size, By Application, 2017�2024 (USD Million)
Table 62 Rest of the Middle East & Africa: Non-Conductive Inks Market Size, By Substrate, 2017�2024 (USD Million)
Table 63 Rest of the Middle East & Africa: Non-Conductive Ink Market Size, Application, 2017�2024(USD Million)
Table 64 New Product Launch, 2015�2018
Table 65 Collaboration, 2015�2018
List of Figures (29 Figures)
Figure 1 Non-Conductive Inks: Market Segmentation
Figure 2 Non-Conductive Ink Market: By Region
Figure 3 Non-Conductive Inks Market: Research Design
Figure 4 Non-Conductive Ink Market: Bottom-Up Approach
Figure 5 Non-Conductive Inks Market: Top-Down Approach
Figure 6 Non-Conductive Ink Market: Data Triangulation
Figure 7 Glass Substrate Segment Accounted for the Largest Share in the Non-Conductive Inks Market in 2018
Figure 8 PCB Panels Will Be the Largest and the Fastest-Growing Application for Non-Conductive Inks
Figure 9 APAC Led the Non-Conductive Ink Market in 2018
Figure 10 Growth in PCB Production is Driving the Non-Conductive Inks Market
Figure 11 Glass Substrate Segment Will Account for the Largest Share of the Overall Market
Figure 12 PCB Panels Segment and APAC Led the Market in 2018
Figure 13 China Will Register the Highest Growth Rate in the Non-Conductive Ink Market
Figure 14 Overview of Factors Governing the Non-Conductive Inks Market
Figure 15 Porter�s Five Forces Analysis: Non-Conductive Ink Market
Figure 16 Glass Substrate Will Be the Largest Segment of the Non-Conductive Inks Market
Figure 17 PCB Panels Will Be the Largest and Fastest-Growing Application of Non-Conductive Inks
Figure 18 APAC is Likely to Grow at the Highest Rate During the Forecast Period
Figure 19 North America: Non-Conductive Inks Market Snapshot
Figure 20 APAC: Non-Conductive Inks Market Snapshot
Figure 21 Europe: Non-Conductive Inks Market Snapshot
Figure 22 Key Developments in the Non-Conductive Ink Market (2015�2018)
Figure 23 Ranking of Non-Conductive Ink Manufacturers in 2018
Figure 24 Henkel AG & Co. KGAA: Company Snapshot
Figure 25 Henkel AG & Co. KGAA: SWOT Analysis
Figure 26 Nagase & Co., Ltd: Company Snapshot
Figure 27 Nagase & Co., Ltd: SWOT Analysis
Figure 28 Teikoku Printing Inks Mfg. Co., Ltd: SWOT Analysis
Figure 29 Applied Cavitation Inc.: SWOT Analysis
The study involved four major activities in estimating the current market size for non-conductive ink. Exhaustive secondary research was done to collect information on the market, the peer market, and the parent market. The next step was to validate these findings, assumptions, with industry experts across the value chain through primary research. Both top-down and bottom-up approaches were employed to estimate the complete market size. Thereafter, market breakdown and data triangulation were used to estimate the market size of segments and sub-segments.
Secondary Research
In the secondary research process, various secondary sources such as Hoovers, Bloomberg BusinessWeek, and Dun & Bradstreet have been referred to, to identify and collect information for this study. These secondary sources include annual reports, press releases & investor presentations of companies, whitepapers, certified publications, articles by recognized authors, gold standard & silver standard websites, associations, regulatory bodies, trade directories, and databases.
Primary Research
The non-conductive ink market comprises several stakeholders, such as raw material suppliers, end-product manufacturers, and regulatory organizations in the supply chain. The demand side is characterized by the developments in the non-conductive ink market. The supply side is characterized by market consolidation activities undertaken by the manufacturers. Various primary sources from both the supply and demand sides of the market were interviewed to obtain qualitative and quantitative information. Following is the breakdown of primary respondents:
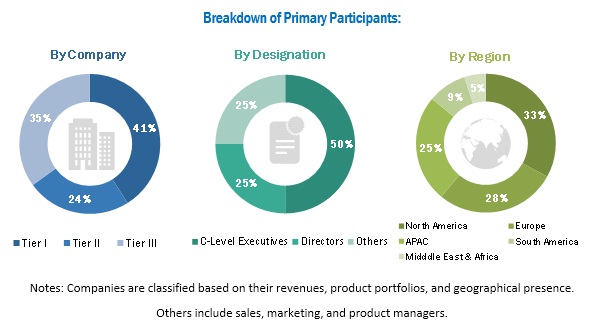
To know about the assumptions considered for the study, download the pdf brochure
Market Size Estimation:
Both top-down and bottom-up approaches were used to estimate and validate the total size of the non-conductive ink market. These methods were also used extensively to estimate the size of various sub-segments in the market. The research methodology used to estimate the market size includes the following:
- The key players in the industry and markets have been identified through extensive secondary research.
- All percentage shares, splits, and breakdowns have been determined using secondary sources and verified through primary sources.
Data Triangulation:
After arriving at the overall market size-using the market size estimation processes as explained above-the market was split into several segments and sub-segments. To complete the overall market engineering process and arrive at the exact statistics of each market segment and sub-segment, the data triangulation, and market breakdown procedures were employed, wherever applicable. The data was triangulated by studying various factors and trends from both the demand and supply sides in the non-conductive ink market.
Report Objectives:
- To define, describe, and forecast the non-conductive ink market size, in terms of volume and value
- To provide information about the major factors (drivers, restraints, opportunities, and challenges) influencing the market growth
- To analyze and forecast the non-conductive ink market size based on application, substrate, and region
- To forecast the market size with respect to key regions, namely, North America, Asia Pacific (APAC), Europe, the Middle East & Africa, and South America
- To strategically analyze the market with respect to individual growth trends, prospects, and their contribution to the overall market
- To analyze the opportunities in the market for stakeholders by identifying high-growth segments and to examine opportunities in the market for stakeholders and provide a competitive landscape for the market leaders
- To analyze the competitive developments, such as expansion, acquisition, and new product development, in the market
Available Customizations:
With the given market data, MarketsandMarkets offers customizations according to the specific needs of companies. The following customization options are available for the report:
Regional Analysis
- A further breakdown of the regional non-conductive ink market to the country level with technology
Country Information
- Additional country information (up to 3)
Company Information
- Detailed analysis and profiles of additional market players (up to 5)


Growth opportunities and latent adjacency in Non-Conductive Ink Market