[118 Pages Report] The low speed vehicle market in North America is projected to grow at a CAGR of 3.1%, reaching USD 4.2 billion by 2022 from USD 3.6 billion in 2017. The rising trend of using low speed vehicles in gated communities, resorts, industrial, & college campuses is projected to fuel the demand for these vehicles. Also, possible advancements in ride-hailing and integrated mobility solutions, the market for low speed vehicles is expected to showcase a steady growth rate over the forecast period.
The study segments the low speed vehicle market by vehicle type into commercial turf utility vehicles, golf carts, industrial utility vehicles, and personnel carriers. In terms of volume, golf carts accounted for the largest market share, whereas, personnel carriers are estimated to be the fastest growing segment. Increase in golf communities and golfing activities resulted in the high demand for golf carts. The personnel carriers are expected to grow with the increase in gated communities, resorts, and its uses in such locations.
The low speed vehicles in North America are also segmented, by their power output range as <8 kW, 8 kW 15 kW, and >15kW. Based on the use and the terrain, the power output, or the vehicle type of low speed vehicle is considered. The market for the high-power output (>15 kW) segment is expected to showcase the highest growth during the forecast period. High power output vehicles are found in all types of low speed vehicles, such as commercial turf utility vehicles, industrial utility vehicles, and personnel carriers. The demand for high-speed, low speed vehicles is growing with the increase in the speed limit, and government permission to ride it on selected roads and high-speed capability requires high power output.
The low speed vehicle market for North America is segmented by propulsion into diesel, electric, and gasoline. Electric vehicles are estimated to have the largest and fastest market during the forecast period. The growth can be attributed due to the increase in vehicle electrification trend. Also, the electric vehicles are better suitable options as these vehicles are required to cover the short distances and need less power output.
The US is estimated to be the largest and fastest growing low speed vehicle market during the forecast period. The growth in the region can be attributed to the presence of established manufacturers such as Polaris, Textron, and Club car. The increase can also be observed as the average age of the population is above 55 years of age, and this age group prefers low speed vehicles as their second vehicle to commute in local areas or same vicinity. Thus, the overall market for low speed vehicles is quite high in the US in comparison to other countries.
The low speed vehicle market for North America consists of suppliers such as Polaris (US), Deere (US), Kubota (US), Textron (Us), and Yamaha (US). The study includes an in-depth competitive analysis of these key players in the low speed vehicle market, with their company profiles, SWOT analysis of the top 5 companies, recent developments, and key market strategies.
The key strategies adopted by the players in the low speed vehicle market in North America are new product developments, supply contracts, and expansions. Polaris and Textron are some of the leading market players that have adopted these strategies to expand their businesses. For instance, in October 2017, Polaris introduced the intelligent off-road suspension, named as, DYNAMIX Active Suspension, for its low speed vehicles, whereas, in September 2017, Textron had a supply contract with the Real Club Valderrama, a golf club in Spain to supply 40 units of E-Z-GO RXV ELiTE golf carts.
The major factor hindering the growth of the low speed vehicle market in North America is the minimal safety features with which the vehicles are equipped. As the authorities have not specified the safety standards for these vehicles, they are not designed considering the safety aspect. Thus, consumers do not prefer a low speed vehicle.
Report Metric |
Details |
Market size available for years |
2015-2025 |
Market Size Available for Years |
20152022 |
Base Year Considered |
2016 |
Forecast Period |
20172022 |
Forecast Units |
Value (USD) and Volume (Units) |
Segments Covered |
Product Type, 48V, Vehicle Type, Degree of Hybridization, Region |
Countries Covered |
US, Canada, Mexico |
Companies Covered |
Polaris (US), Textron (US), Deere (US), Kubota (US), and Ontario (Canda) |
Note: The chapter is segmented further at country level (US, Canada, Mexico) and LSV type (Commercial Turf Utility Vehicles, Golf Carts, Industrial Utility Vehicles, Personnel Carriers)
Note: The chapter is segmented further at country level (US, Canada, Mexico)
To speak to our analyst for a discussion on the above findings, click Speak to Analyst
Table of Contents
1 Introduction (Page No. - 13)
1.1 Objectives of the Study
1.2 Market Definition
1.3 Market Scope
1.3.1 Years Considered for the Study
1.4 Currency
1.5 Package Size
1.6 Limitations
1.7 Stakeholders
2 Research Methodology (Page No. - 17)
2.1 Research Data
2.1.1 Secondary Data
2.1.1.1 Key Secondary Sources
2.1.2 Key Data From Secondary Sources
2.1.3 Primary Data
2.1.4 Sampling Techniques & Data Collection Methods
2.1.5 Primary Participants
2.2 Factor Analysis
2.2.1 Introduction
2.2.2 Demand-Side Analysis
2.2.2.1 Increasing Demand for Electric Low Speed Vehicle Applications
2.2.3 Supply-Side Analysis
2.2.3.1 Technological Advancements and Diversification in Automotive Industry
2.3 Market Size Estimation
2.3.1 Bottom-Up Approach
2.4 Data Triangulation
2.5 Assumptions
3 Executive Summary (Page No. - 27)
4 Premium Insights (Page No. - 32)
4.1 Attractive Opportunities in North America for Electric Low Speed Vehicles
4.2 Low Speed Vehicles Market for North America, By Manufacturer
4.3 Low Speed Vehicles Market for North America, By Power Output
4.4 Low Speed Vehicles Market for North America, By Propulsion
4.5 Low Speed Vehicles Market for North America, By Vehicle Type
4.6 Low Speed Vehicles Market for North America, By Country
5 Market Overview (Page No. - 36)
5.1 Introduction
5.2 Market Dynamics
5.2.1 Drivers
5.2.1.1 Aging Population to Drive the Demand for Lsvs
5.2.1.2 Stringent Emission Regulations in the US Might Boost the Demand for Low Speed Electric Vehicles
5.2.2 Restraints
5.2.2.1 Lsv Segment is Equipped With Minimal Safety Standards/Equipment
5.2.3 Opportunities
5.2.3.1 Future of Mobility
5.2.3.1.1 Ride Hailing Services (Electric Mobility)
5.2.3.1.2 Integrated Mobility Solution
5.2.4 Challenges
5.2.4.1 Developing Fail-Safe Electronic and Electrical Components
5.2.4.2 Cost Reduction & Improved Energy Density of Ev Batteries
5.3 Macro Indicator Analysis
5.3.1 Introduction
5.3.1.1 Full Electric Vehicle Sales as A Percentage of Total Electric Vehicle Sales
5.3.1.2 GDP (USD Billion)
5.3.1.3 Gnp Per Capita, Atlas Method (USD)
5.3.1.4 GDP Per Capita Ppp (USD)
5.3.2 Macro Indicators Influencing the Low Speed Vehicles Market for Us
5.3.2.1 US
5.4 Supply Chain Analysis
5.5 Low Speed Vehicles: US State-Wise Regulations on Permitted Usage & Speed Limit
6 Low Speed Vehicles Market for North America, By Manufacturer (Page No. - 47)
Note: The Chapter is Further Segmented at Country Level (US, Canada, Mexico) and Lsv Type (Commercial Turf Utility Vehicles, Golf Carts, Industrial Utility Vehicles, Personnel Carriers)
6.1 Introduction
6.2 Polaris
6.3 Deere
6.4 Kubota
6.5 Club Car/Ingersoll Rand
6.6 Textron
6.7 Yamaha
6.8 Kawasaki
6.9 Ontario
6.1 American Sportworks
6.11 Bad Boy/Intimidator
6.12 Others
7 Low Speed Vehicles Market for North America, By Power Output (Page No. - 67)
Note: the Chapter is Further Segmented at Country Level (US, Canada, Mexico)
7.1 Introduction
7.2 <8 kW
7.3 8 kW15 kW
7.4 >15 kW
8 Low Speed Vehicles Market for North America, By Propulsion (Page No. - 73)
Note: The Chapter is Further Segmented at Country Level (US, Canada, Mexico)
8.1 Introduction
8.2 Diesel
8.3 Electric
8.4 Gasoline
9 Low Speed Vehicles Market for North America, By Lsv Type (Page No. - 78)
Note: The Chapter is Further Segmented at Country Level (US, Canada, Mexico)
9.1 Introduction
9.2 Commercial Turf Utility Vehicles
9.3 Golf Carts
9.4 Industrial Utility Vehicles
9.5 Personnel Carriers
10 Competitive Landscape (Page No. - 85)
10.1 Overview
10.2 Market Share Analysis: Low Speed Vehicle Market, 2016
10.3 Recent Developments
11 Company Profiles (Page No. - 88)
(Business Overview, Products & Services, Key Insights, Recent Developments, SWOT Analysis, Ratio Analysis, MnM View)*
11.1 Polaris
11.2 Textron
11.3 Deere
11.4 Toro
11.5 Kubota
11.6 Yamaha
11.7 Club Car
11.8 Taylor Dunn
11.9 Columbia Parcar
11.10 American Landmaster
*Details on Business Overview, Products & Services, Key Insights, Recent Developments, SWOT Analysis, MnM View Might Not Be Captured in Case of Unlisted Companies.
12 Appendix (Page No. - 111)
12.1 Primary Insights
12.2 Discussion Guide
12.3 Knowledge Store: Marketsandmarkets Subscription Portal
12.4 Available Customizations
12.4.1 Low Speed Vehicle Market for North America, By Manufacturer & Power Output
12.4.1.1 Polaris Industries
12.4.1.2 Deere & Co.
12.4.1.3 Kubota
12.4.1.4 Club Car/Ingersoll Rand
12.4.1.5 Textron Specialized Vehicles
12.4.1.6 Yamaha Motor
12.4.1.7 Kawasaki Motors
12.4.1.8 Ontario Drive & Gear Ltd.
12.4.1.9 American Sportworks
12.4.2 Low Speed Vehicle Market for North America, By Manufacturer & Models
12.4.2.1 Polaris Industries
12.4.2.2 Deere & Co.
12.4.2.3 Kubota
12.4.2.4 Club Car/Ingersoll Rand
12.4.2.5 Textron Specialized Vehicles
12.4.2.6 Yamaha Motor
12.4.2.7 Kawasaki Motors
12.4.2.8 Ontario Drive & Gear Ltd.
12.4.2.9 American Sportworks
12.4.2.10 Bad Boy Inc./Intimidator, Inc.
12.5 Related Reports
12.6 Author Details
List of Tables (79 Tables)
Table 1 Currency Exchange Rates (W.R.T. USD)
Table 2 Technical Performance of Different Ev Batteries
Table 3 US: Rising Gni Per Capita Expected to Drive the Sales of Luxury Vehicles During the Forecast Period
Table 4 Low Speed Vehicles Market for North America, By Manufacturer, 20152022 (Units)
Table 5 Low Speed Vehicles Market for North America, By Manufacturer, 20152022 (USD Billion)
Table 6 Low Speed Vehicles Market for Polaris, By Country, 20152022 (Units)
Table 7 Low Speed Vehicles Market for Polaris, By Country, 20152022 (USD Billion)
Table 8 Low Speed Vehicles Market for Polaris, By Vehicle Type, 20152022 (Units)
Table 9 Low Speed Vehicles Market for Polaris, By Vehicle Type, 20152022 (USD Billion)
Table 10 Low Speed Vehicles Market for Deere, By Country, 20152022 (Units)
Table 11 Low Speed Vehicles Market for Deere, By Country, 20152022 (USD Billion)
Table 12 Low Speed Vehicles Market for Deere, By Vehicle Type, 20152022 (Units)
Table 13 Low Speed Vehicles Market for Deere, By Vehicle Type, 20152022 (USD Billion)
Table 14 Low Speed Vehicles Market for Kubota, By Country, 20152022 (Units)
Table 15 Low Speed Vehicles Market for Kubota, By Country, 20152022 (USD Billion)
Table 16 Low Speed Vehicles Market for Kubota, By Vehicle Type, 20152022 (Units)
Table 17 Low Speed Vehicles Market for Kubota, By Vehicle Type, 20152022 (USD Billion)
Table 18 Low Speed Vehicles Market for Club Car/Ingersoll Rand, By Country, 20152022 (Units)
Table 19 Low Speed Vehicles Market for Club Car/Ingersoll Rand, By Country, 20152022 (USD Billion)
Table 20 Low Speed Vehicles Market for Club Car/Ingersoll Rand, By Vehicle Type, 20152022 (Units)
Table 21 Low Speed Vehicles Market for Club Car/Ingersoll Rand, By Vehicle Type, 20152022 (USD Billion)
Table 22 Low Speed Vehicles Market for Textron, By Country, 20152022 (Units)
Table 23 Low Speed Vehicles Market for Textron, By Country, 20152022 (USD Billion)
Table 24 Low Speed Vehicles Market for Textron, By Vehicle Type, 20152022 (Units)
Table 25 Low Speed Vehicles Market for Textron, By Vehicle Type, 20152022 (USD Billion)
Table 26 Low Speed Vehicles Market for Yamaha, By Country, 20152022 (Units)
Table 27 Low Speed Vehicles Market for Yamaha, By Country, 20152022 (USD Billion)
Table 28 Low Speed Vehicles Market for Yamaha, By Vehicle Type, 20152022 (Units)
Table 29 Low Speed Vehicles Market for Yamaha, By Vehicle Type,20152022 (USD Billion)
Table 30 Low Speed Vehicles Market for Kawasaki, By Country, 20152022 (Units)
Table 31 Low Speed Vehicles Market for Kawasaki, By Country, 20152022 (USD Billion)
Table 32 Low Speed Vehicles Market for Kawasaki, By Vehicle Type, 20152022 (Units)
Table 33 Low Speed Vehicles Market for Kawasaki, By Vehicle Type, 20152022 (USD Billion)
Table 34 Low Speed Vehicles Market for Ontario, By Country, 20152022 (Units)
Table 35 Low Speed Vehicles Market for Ontario, By Country, 20152022 (USD Billion)
Table 36 Low Speed Vehicles Market for Ontario, By Vehicle Type,20152022 (Units)
Table 37 Low Speed Vehicles Market for Ontario, By Vehicle Type, 20152022 (USD Billion)
Table 38 Low Speed Vehicles Market for American Sportworks, By Country, 20152022 (Units)
Table 39 Low Speed Vehicles Market for American Sportworks, By Country, 20152022 (USD Billion)
Table 40 Low Speed Vehicles Market for American Sportworks, By Vehicle Type, 20152022 (Units)
Table 41 Low Speed Vehicles Market for American Sportworks, By Vehicle Type, 20152022 (USD Billion)
Table 42 Low Speed Vehicles Market for Bad Boy/Intimidator, By Country, 20152022 (Units)
Table 43 Low Speed Vehicles Market for Bad Boy/Intimidator, By Country, 20152022 (USD Billion)
Table 44 Low Speed Vehicles Market for Bad Boy/Intimidator, By Vehicle Type, 20152022 (Units)
Table 45 Low Speed Vehicles Market for Bad Boy/Intimidator, By Vehicle Type, 20152022 (USD Billion)
Table 46 Low Speed Vehicles Market for Others, By Country, 20152022 (Units)
Table 47 Low Speed Vehicles Market for Others, By Country, 20152022 (USD Billion)
Table 48 Low Speed Vehicles Market for Others, By Vehicle Type, 20152022 (Units)
Table 49 Low Speed Vehicles Market for Others, By Vehicle Type, 20152022 (USD Billion)
Table 50 Low Speed Vehicles Market for North America, By Power Output, 20152022 (Units)
Table 51 Low Speed Vehicles Market for North America, By Power Output, 20152022 (USD Billion)
Table 52 North America: Low Speed Vehicles Market for <8 kW Power Output, By Country, 20152022 (Units)
Table 53 North America: Low Speed Vehicles Market for <8 kW Power Output, By Country, 20152022 (USD Billion)
Table 54 North America: Low Speed Vehicles Market for 8 kW15 kW Power Output, By Country, 20152022 (Units)
Table 55 North America: Low Speed Vehicles Market for 8 kW15 kW Power Output, By Country, 20152022 (USD Billion)
Table 56 North America: Low Speed Vehicles Market for >15 kW Power Output, By Country, 20152022 (Units)
Table 57 North America: Low Speed Vehicles Market for >15 kW Power Output, By Country, 20152022 (USD Billion)
Table 58 Low Speed Vehicles Market for North America, By Propulsion, 20152022 (Units)
Table 59 Low Speed Vehicles Market for North America, By Propulsion, 20152022 (USD Billion)
Table 60 North America: Low Speed Vehicles Market for Diesel Propulsion,By Country, 20152022 (Units)
Table 61 North America: Low Speed Vehicles Market for Diesel Propulsion, By Country, 20152022 (USD Billion)
Table 62 North America: Low Speed Vehicles Market for Electric Propulsion, By Country, 20152022 (Units)
Table 63 North America: Low Speed Vehicles Market for Electric Propulsion, By Country, 20152022 (USD Billion)
Table 64 North America: Low Speed Vehicles Market for Gasoline Propulsion,By Country, 20152022 (Units)
Table 65 North America: Low Speed Vehicles Market for Gasoline Propulsion, By Country, 20152022 (USD Billion)
Table 66 Low Speed Vehicles Market for North America, By Vehicle Type, 20152022 (Units)
Table 67 Low Speed Vehicles Market for North America, By Vehicle Type, 20152022 (USD Billion)
Table 68 Low Speed Vehicles Market for North America, By Country, 20152022 (Units)
Table 69 Low Speed Vehicles Market for North America, By Country, 20152022 (USD Billion)
Table 70 North America: Low Speed Vehicles Market for Commercial Turf Utility Vehicles, By Country, 20152022 (Units)
Table 71 North America: Low Speed Vehicles Market for Commercial Turf Utility Vehicles, By Country, 20152022 (USD Billion)
Table 72 North America: Low Speed Vehicles Market for Golf Carts, By Country, 20152022 (Units)
Table 73 North America: Low Speed Vehicles Market for Golf Carts, By Country, 20152022 (USD Billion)
Table 74 North America: Low Speed Vehicles Market for Industrial Utility Vehicles, By Country, 20152022 (Units)
Table 75 North America: Low Speed Vehicles Market for Industrial Utility Vehicles, By Country, 20152022 (USD Billion)
Table 76 North America: Low Speed Vehicles Market for Personnel Carriers, By Country, 20152022 (Units)
Table 77 North America: Low Speed Vehicles Market for Personnel Carriers, By Country, 20152022 (USD Billion)
Table 78 Low Speed Vehicle Suppliers: Market Ranking
Table 79 Recent Developments, 2017
List of Figures (42 Figures)
Figure 1 Market Segmentation: Low Speed Vehicles Market for North America
Figure 2 Low Speed Vehicles Market for North America: Research Design
Figure 3 Research Methodology Model
Figure 4 Breakdown of Primary Interviews: By Company Type, Designation, & Country
Figure 5 Market Size Estimation Methodology of Low Speed Vehicles Market for North America: Bottom-Up Approach
Figure 6 Parameters & Assumptions Followed for Low Speed Vehicles Market Analysis
Figure 7 Parameters & Limitations for Low Speed Vehicles Market Analysis
Figure 8 Club Car, Textron, and Yamaha are Expected to Lead the North American Low Speed Vehicles Market, 2017 vs. 2022 (USD Billion)
Figure 9 8 kW15 kW Power Output Vehicles are Estimated to Have the Largest Share in the Low Speed Vehicles Market, 2017 vs. 2022 (USD Billion)
Figure 10 Advancement in the Electric Vehicle Technology to Drive the Low Speed Vehicles Market for North America, 2017 vs. 2022 (USD Billion)
Figure 11 Utility Vehicles & Golf Carts are Expected to Drive the North American Low Speed Vehicles Market, 20152022 (USD Billion)
Figure 12 US is Estimated to Showcase the Fastest Growth in the North American Low Speed Vehicles Market, 20172022 (USD Billion)
Figure 13 Advancements in Electric Vehicle Technology & Possible Improvisation in Speed Limits to Drive the North American Low Speed Vehicles Market During the Forecast Period
Figure 14 Club Car to Lead the North American Low Speed Vehicles Market,2017 vs. 2022 (USD Billion)
Figure 15 >15 kW Segment to Have the Fastest Growth in the North American Low Speed Vehicles Market, 20172022 (USD Billion)
Figure 16 Electric Low Speed Vehicles Market are Projected to Grow at the Highest Cagr From 2017 to 2022 (USD Billion)
Figure 17 Commercial Turf Utility Vehicles to Have the Largest Market Size in the North American Low Speed Vehicles Market, 20172022 (USD Billion)
Figure 18 US is Estimated to Showcase the Largest Market Size in the North American Low Speed Vehicles Market, 20172022 (USD Billion)
Figure 19 Low Speed Vehicles Market Dynamics for North America
Figure 20 US New Vehicle Purchase By Age Category, 19902012
Figure 21 Licensed Drivers as A Percentage of Age Category
Figure 22 Electric Vehicle Ride Hailing Market, By Country, 20152025 (USD Billion)
Figure 23 Projected Cost of Lithium-Ion Battery, 20152030 (USD Per kWh)
Figure 24 Low Speed Vehicle: Supply Chain & Key Players
Figure 25 Low Speed Vehicles Market for North America, By Manufacturer, 2015 vs. 2022 (Units)
Figure 26 Low Speed Vehicles Market Share for North America, By Power Output, 2015 vs 2022 (Units)
Figure 27 Low Speed Vehicles Market for North America, By Propulsion, 20152022 (Units)
Figure 28 Low Speed Vehicles Market for North America, By Vehicle Type, 20152022 (Units)
Figure 29 Low Speed Vehicles Market for North America, By Country,20152022 (USD Billion)
Figure 30 Companies Adopted New Product Development as A KeyGrowth Strategy
Figure 31 Low Speed Vehicles Suppliers: Market Share, 2016
Figure 32 Polaris: Company Snapshot
Figure 33 Polaris: SWOT Analysis
Figure 34 Textron: Company Snapshot
Figure 35 Textron: SWOT Analysis
Figure 36 Deere: Company Snapshot
Figure 37 Deere: SWOT Analysis
Figure 38 Toro: Company Snapshot
Figure 39 Toro: SWOT Analysis
Figure 40 Kubota: Company Snapshot
Figure 41 Kubota: SWOT Analysis
Figure 42 Yamaha: Company Snapshot
The low speed vehicle market in North America is projected to grow at a CAGR of 3.1%, from the estimated market size of USD 3.6 billion in 2017 to USD 4.2 billion in 2022. The growth is observed owing to key reasons such as increasing preference for low speed vehicles at the golf course and in gated communities. Also, with the advancements in the transportation industry to the ride-hailing services and integrated mobility solutions, the market for low speed vehicles is projected to showcase a steady growth.
The secondary sources referred for this research study include annual reports, press releases and investor presentations of companies, white papers, certified publications, articles from recognized authors, directories, databases, and articles from recognized associations and government publishing sources. Various data points have been collected through secondary research such as key companys revenues, gross booking.
Extensive primary research has been conducted after acquiring an understanding of the low speed vehicle market scenario through secondary research. Several primary interviews have been conducted with market experts from both the demand- and supply-side players across three major countries, namely US, Canada, and Mexico. Primary data has been collected through questionnaires, emails, and telephonic interviews. In the canvassing of primaries, we have strived to cover various departments within organizations, such as sales, operations, and administration, to provide a holistic viewpoint in our report. The primary validations include the base market size, forecasted market size, CAGR, segment level data, and trends of each segment.
After interacting with industry experts, we have also conducted brief sessions with highly experienced independent consultants to reinforce the findings from our primaries. This, along with the in-house subject-matter experts opinions, has led us to the findings as described in the remainder of this report.
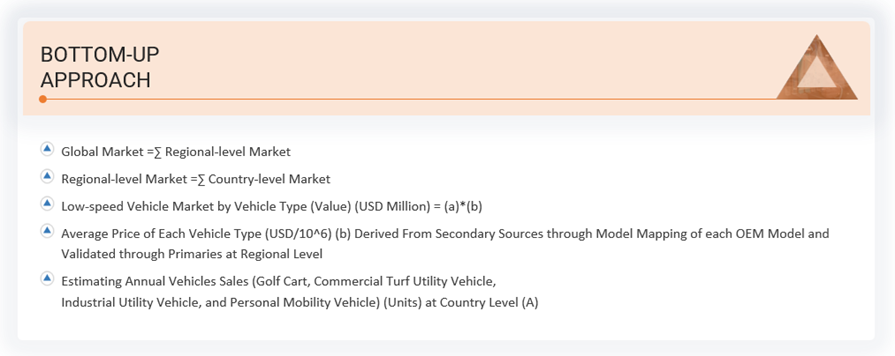
The bottom-up approach has been used to estimate and validate the size of the low speed vehicles market for North America. The market size, by volume, has been derived by identifying the country-wise production of low speed vehicles.
To derive the market size in terms of volume, the production of LSVs by major manufacturers are mapped. The market size, by value, has been arrived at by multiplying the average selling price of each model with the number of units. The total value of each component has been summed up to obtain the total revenue of the market.
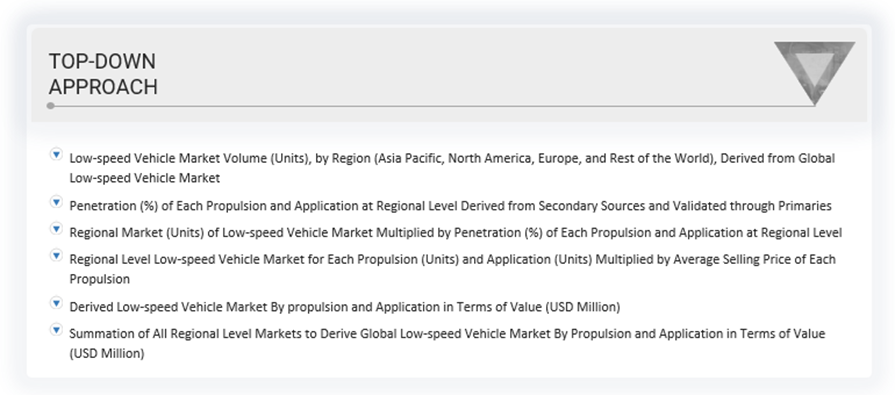
All percentage shares, splits, and breakdowns have been determined using secondary sources and verified through primary sources. All parameters that are said to affect the markets covered in this research study have been accounted for, viewed in extensive detail, verified through primary research, and analyzed to gain the final quantitative and qualitative data. The data has been consolidated, enhanced with detailed inputs and analysis from MarketsandMarkets, and presented in this report. The following figure is an illustrative representation of the overall market size estimation process employed in this study.
All percentage shares, splits, and breakdowns have been determined using secondary sources and verified through primary sources. All parameters that are said to affect the markets covered in this research study have been accounted for, viewed in extensive detail, verified through primary research, and analyzed to get the final quantitative and qualitative data. The data has been consolidated, enhanced with detailed inputs and analysis from MarketsandMarkets, and presented in this report.
The research methodology used in the report involves various secondary sources, including paid databases and directories. Experts from related industries and suppliers have been interviewed to understand the future trends of the low speed vehicle market in North America. The bottom-up approach has been used to estimate the market size by volume. The market size, by volume, is multiplied by the average OE price (AOP) of low speed vehicle by the vehicle type to calculate the market size in terms of value. The summation of the country-wise market gives the regional market. Low speed vehicle manufacturer associations referred are Electric Auto Association, World Electric Vehicle Association, Plug-in America, National Mobility Equipment Dealers Associations, National Golfcart Association, and International Light Transportation Vehicle Association, Inc.
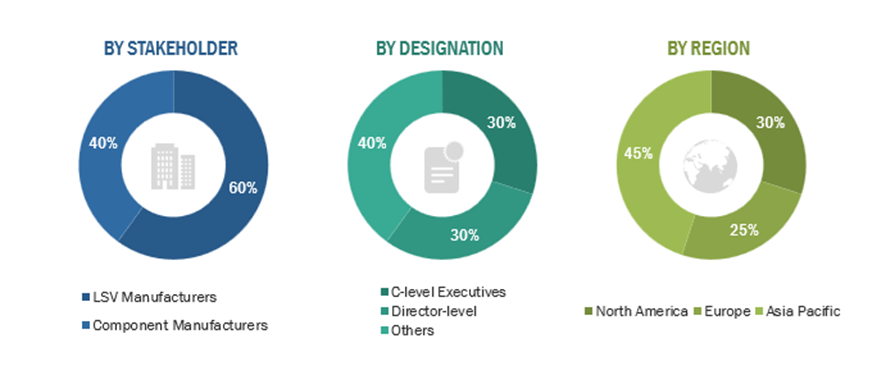
The figure given below shows the break-up of the profile of industry experts who participated in primary discussions.
To know about the assumptions considered for the study, download the pdf brochure
The ecosystem of the Low Speed Vehicles market for automotive consists of manufacturers and Tier 1 suppliers such as Polaris (US), Textron (US), Deere (US), Toro (US), Kubota (Japan), Yamaha (Japan), Club Car (US), Taylor-Dunn (US), Columbia Parcar (US), and American Landmaster (US).
The study answers several questions for the stakeholders, primarily which market segments to focus in the next two to five years (depends on a range of forecast period) for prioritizing their efforts and investments.
With the given market data, MarketsandMarkets can provide market data for the below categories:
Bad Boy/Intimidator Note: The chapter would be further segment by <8 kW, 815 kW and >15 kW
Note: The chapter would be further segment by vehicle type and model
Growth opportunities and latent adjacency in Low Speed Vehicle Market