All-terrain Vehicle Market

All-terrain Vehicle Market by Type & Application (Sport, Entertainment, Agri, Military & Defense), Drive (2wd, 4wd, AWD), Engine (<400, 400-800, >800cc), Fuel Type, Wheel Number, Seating Capacity, Side-By-Side Vehicle and Region - Global Forecast to 2028

Report Code: AT 7165 Jul, 2023, by marketsandmarkets.com

[294 Pages Report] The all-terrain vehicle market value is projected to grow to USD 3.7 billion by 2028 from USD 3.2 billion in 2023, at a CAGR of 3.0% during the forecast period. ATVs are used in multiple applications such as sports, agriculture, military & defense, construction, etc. Key driving factors for the market include increasing recreational activities, growing usage of ATVs in agriculture and defense, and increased purchasing power and spending capacity of individuals. Product launches and increasing players' market share, such as Polaris Inc. (US), Textron Inc. (US) Honda (Japan) etc., are expected to drive the ATV market. Thus, looking at the abovementioned factors, the ATV market is expected to boost globally during the forecast period.

All-terrain Vehicle Market

To know about the assumptions considered for the study, Request for Free Sample Report

All-terrain Vehicle Market

To know about the assumptions considered for the study, download the pdf brochure

Market Dynamics

DRIVER: Increased demand for recreational activities, agriculture, and military operations.

ATVs were earlier endorsed and traded as leisure vehicles designed to deliver thrilling experiences to the rider. However, it was soon realized that ATVs are useful machines to travel through zones inaccessible by trucks, four-wheel drives, or other vehicles. Gradually, ATVs became popular with their many applications in agriculture, such as inspecting crops and livestock, applying fertilizers and chemicals, repairing irrigation systems and pipelines, supervising field crews, and transporting materials. Today, ATVs are found in all types of farms, orchards, nurseries, and forests.

John Deere, a major agricultural and farm equipment manufacturer, recently launched UTV models for farming applications. The company plans to update its various utility vehicles for farming purposes owing to the higher demand for such vehicles by customers working in the agriculture sector for multiple applications. In July 2022, John Deere introduced its AutoTrac-assisted steering system for its Gator Utility Vehicles. The AutoTrac-assisted steering system was created to help operators be more productive and less tired. This system ensures that the vehicle maintains consistency and precise accuracy while moving through the field, allowing for efficient and reliable performance. This AutoTrack Steering system comes in models such as XUV835M HVAC, XUV835R, XUV835R Signature Edition, XUV865M HVAC, XUV865R, and the XUV865R Signature Edition. Other players like BRP’s Outlander, Outlander Pro, Commander, Suzuki KingQuad, Polaris Sportsman Series, Honda TRX420 Fourtrax, etc., also have an extensive portfolio of ATVs for farming use worldwide.

RESTRAINTS: High accident rates and subsequent regulations may hamper the ATV demand.

Ensuring the safety of passengers and vehicles is a top priority for both buyers and original equipment manufacturers (OEMs). Worldwide regulatory authorities are actively working towards enhancing vehicle safety. It is crucial for drivers to remain attentive to the speed, navigation, and other ATV-related data. Failure to do so can result in significant accidents. One common type of accident occurs when the ATV flips or rolls over, which can cause the driver and passenger to be thrown from the vehicle or trapped underneath it. Despite a widespread misconception, ATVs are generally not designed to carry passengers at the rear. Doing so significantly increases the risk of accidents for both the passengers and the vehicle operator.

ATVs do not require much balancing, but these vehicles do not have safety features such as seat belts. Therefore, when brakes are applied at high speed, the chances of the rider falling or getting thrown out of the vehicle are high. These accidents can cause major head and spinal cord injuries that may lead to death.

According to the Canadian Association of Road Safety Professionals, an average of 100 Canadians lose their lives every year, and over 2,000 individuals require hospitalization due to injuries caused by all-terrain vehicles (ATVs). In these recent deaths and many quad fatalities in Canada, the common theme is death due to vehicle rollover. Considering the high number of injuries and fatal incidents has raised regional authorities' attention toward an emphasis on enforcing laws related to ATV safety. Thus, governments worldwide may impose strict safety and security regulations to avoid fatal accidents, which may hamper the demand for ATVs.

OPPORTUNITIES: Positive outlook toward electric ATVs will create new opportunities.

The ‘UN-Habitat’ global report claims that cities account for 70% of greenhouse emissions and energy consumption worldwide. With such alarming environmental threats, most automotive manufacturers have been looking to introduce fuel-efficient and emission-free models in the coming years. The adoption of technologies related to electric ATVs has been increasing among manufacturers. Leading markets for electric ATVs, such as China, the US, and Germany, are investing heavily in R&D infrastructure for off-road vehicles. Since there is a lot of pressure on OEMs, mainly due to new regulations implemented by countries worldwide to reduce their greenhouse gas emissions, most of the investments are likely to go towards developing electric-powered vehicles. The same applies to the ATV market as well.

In 2021, Polaris launched its EV ATV, a Ranger XP Kinetic model developed in collaboration with Zero Motorcycles. It has a 14.9kWH battery and can travel 45 miles on a single full charge. Polaris also partnered with Qmerit, a provider of residential EV charging infrastructure. Further, companies such as Ecocharger, Powerland, evoletIndia, and DRR USA focus on developing ATVs and Side-by-side vehicles for applications such as agriculture, sports, and recreational activities.

In the UK, Ecocharger, an all-electric ATV manufacturer, offers models primarily driven by lead-acid or lithium-ion batteries. With a strong presence in Europe, the company plans to expand its dealerships across southern and central Europe. This indicates customers are demanding more electric ATVs due to climate consciousness or to comply with regulations. Electric ATVs are set to have a growing market share in the future. Few other manufacturers are also starting to produce electric ATVs. Components such as batteries becoming cheaper would also make these ATVs more accessible. Planet-conscious customers and increased GHG regulations across the globe will drive the adoption of electrification in the ATV industry. It is not only an opportunity but also imperative for OEMs to become early movers and capture the EV ATV market share in the near future.

CHALLENGES: Trade barriers across different regions & high cost of ATVs.

The trade barriers between the US and China have had a negative impact on the economies of both countries, causing a slowdown. China has imposed various export restrictions on the US for key raw materials, utilizing its position as a major producer. This situation affects the cost of ATVs, as the US, China, and the EU are the largest markets for ATV exports globally. High tariffs and currency exchange rate differences between these regions contribute to increased costs. Furthermore, the emergence of electric ATVs has compelled OEMs to invest more in their development, leading to higher prices as they aim to recover their investments. The prices of ATV models vary based on desired features, with more features increasing manufacturing costs and ultimately affecting consumer buying behavior.

All-Terrain Vehicle Market Ecosystem:

The ecosystem analysis highlights various players in the all-terrain vehicle market ecosystem, which is primarily represented by ATV OEMs, component manufacturers (tier I), tier I tire manufacturers, and dealers and distributors.

All-terrain Vehicle Market

All-Terrain Vehicle manufacturers

  • ATV manufacturers are responsible for creating, designing, and manufacturing ATVs. They dedicate resources to research and development in order to enhance ATV performance, safety features, and fuel efficiency. Some well-known ATV manufacturers include Polaris Inc., Yamaha Motor Corporation, Honda Motor Co., Ltd., Arctic Cat Inc., and CF Moto.

Raw Material/Component Suppliers:

  • Raw material suppliers are responsible for providing the necessary components, parts, and raw materials needed for manufacturing ATVs. Their role is vital in ensuring that manufacturers have access to high-quality components to meet their production requirements.

Government and Regulatory Authorities:

  • Government bodies and regulatory authorities create and enforce rules regarding the manufacturing of ATVs, safety standards, emissions control, and registration procedures. These regulations aim to promote the safe and responsible usage of ATVs while also safeguarding the environment.

DealerS and Distributors:

  • Dealers and distributors serve as middlemen between ATV manufacturers and customers. They buy ATVs from manufacturers and then sell them either to retail stores or directly to consumers. Additionally, dealers offer post-purchase services like maintenance and repair.

Service and Repair Centers:

  • Service and repair centers focus on the upkeep, servicing, and fixing of ATVs. Their primary role is to ensure that ATVs have a long lifespan and perform at their best. These centers can either be authorized by ATV manufacturers or operate as independent businesses.

End USers

  • End users are key participants in the ATV market ecosystem. They are the individuals who buy and use ATVs for a wide range of purposes, including recreation, utility work, sports, or transportation.

4WD ATVs are estimated to be the largest market during the forecast period.

By Drive type, 4WD drive holds the largest market share in the global all-terrain vehicle market trends, whereas AWD ATV is expected to grow fastest during the forecast period. The key growth factor for AWD ATVs is the growing deployment of advanced technologies to make ATVs more practical for sports, agriculture, and military applications. AWD provides benefits such as a continuous power supply to all four wheels, so the rider doesn't have to switch on or off the 4WD mode. It offers better holdback when driving downhill, is less likely to flip while uphill, and has better traction in slippery riding conditions. This is especially advantageous when rapid and smooth power transfer to all wheels is essential, like when the traction suddenly changes or when navigating unpredictable off-road terrain.

Further, 4WD ATVs are also helpful for utility activities such as farming due to their superior control capability and performance in various terrains. These ATVs are specifically designed to provide efficient pulling power, making them ideal for tasks like crop and livestock inspections, application of fertilizers and chemicals, timber marking, dirt moving, and material transportation. Their capabilities in these utility activities stem from their enhanced traction and stability, allowing farmers to navigate challenging terrains easily. With all of these advantages offered by ATVs with 4WD, this market is anticipated to remain predominant in the global market during the forecast period.

Military & Defense application is projected to grow at the fastest-growing segment in the all-terrain vehicles market.

ATVs have been growing in popularity in military and defense applications across different parts of the world in recent years. Distinct benefits such as sheer enhanced mobility, versatility, responsiveness, and capability needed in various military operations, from tactical missions to base support, have widened its scope of use in different military operations and applications. Defense and military bodies of several countries are planning to procure ATVs to extend their vehicle portfolio. For instance, in January 2023, Indian Army procured an extremely mobile and versatile Polaris MRZR 4 all-terrain vehicle. These ATVs can be used for various operations and even in challenging terrain. Earlier in 2022, The Ministry of Defense of India intended plans to acquire 250 All-Terrain Vehicles (ATVs) through the Fast Track Procedure (FTP) under the Buy (Indian) category.

Additionally,  in September 2021, The US Army procured the light combat tactical all-terrain vehicle (L-ATV), which Oshkosh Defense designed as part of the Joint Light Tactical Vehicle (JLTV) program. Also, multiple NATO countries are operating all-terrain vehicles that can stand on cold and icy surfaces, which can be helpful during the present Russia-Ukraine war situation in the European region. Thus, demand for ATVs is anticipated to grow in military operations due to increased government spending on mobility solutions for rugged and difficult terrains.

“North America to be the largest market for all-terrain vehicles during the forecast period.”

North America will lead the all-terrain vehicle market during the forecast period. The North American all-terrain vehicle industry is one of the most advanced industries globally, contributing more than 50% of global demand. The US is the leading market in the region due to the increasing usage of ATVs in sports and outdoor events as well as growing use in agriculture and military & defense applications. According to Yamaha Factbook 2022, the US market accounts for over 50% of the global ATV demand. Further, the US and Canada together accounted for around 75% of the total all-terrain vehicle production in the region in 2022. The demand for ATVs has witnessed a significant rise in this region. The market growth is attributed to consumers' higher inclination towards outdoor recreational activities in the US and Canada. North American countries have long unpaved terrains of mountain trails, flat surfaces, and sandy locations. These vehicles are used for recreational and sports activities and utility purposes in agriculture, farmlands, and hunting & forestry. Polaris dominates the North American ATV market along with other established players such as Textron, BRP, Honda, Yamaha, and John Deere.

All-terrain Vehicle Market  Size, and Share

Key Market Players & Startups

The all-terrain vehicle market is dominated by players such as Polaris Inc. (US), BRP (Canada), Honda Motor Co., Ltd (Japan), Textron Inc. (US), Yamaha Motor Corporation (Japan), Kawasaki Heavy Industries Ltd (Japan), Suzuki Motor Corporation (Japan), CFMoto (China), and Kymco (Taiwan). These companies offer advanced ATVs and have strong distribution networks at the global level. These companies have adopted comprehensive expansion strategies; and undertaken collaborations, partnerships, and mergers & acquisitions to gain traction in the growing market for all-terrain vehicle market forecast.

Get online access to the report on the World's First Market Intelligence Cloud

  • Easy to Download Historical Data & Forecast Numbers
  • Company Analysis Dashboard for high growth potential opportunities
  • Research Analyst Access for customization & queries
  • Competitor Analysis with Interactive dashboard
  • Latest News, Updates & Trend analysis
Request Sample

Scope of the Report

Report Metric

Details

Market size available for years

2018–2028

Base year considered

2022

Forecast period

2023–2028

Forecast volume

Units

Forecast value

USD Million/Billion

Segments Covered

By Type, Drive Type, Application, Seating Capacity, By Engine Capacity, By Number of Wheels, By Fuel Type, Side-by-side vehicle by region, and by Region

Geographies Covered

Asia Oceania, Europe, North America, and the Rest of the World

Companies Covered

Polaris Inc. (US), Honda Motor Co., Ltd (Japan), BRP (Canada), Yamaha Motor Corporation (Japan), Kawasaki Heavy Industries Ltd (Japan), Suzuki Motor Corporation (Japan), Hisun Motors (US), CFMOTO (China), and John Deere (US). (Total of 20 companies)

The study categorizes the all-terrain vehicle market based on By type, drive type, Application, seating capacity, engine capacity, number of wheels, fuel type, side-by-side vehicle by region, and region.

By Type
  • Sports
  • Utility
By Drive Type
  • 2WD
  • 4WD
  • AWD
By Application
  • Sports
  • Agricultutre
  • Entertainment
  • Military and Defense
  • Others
By Seating Capacity
  • One Seat
  • ≥Two Seat
By Engine Capacity
  • <400 cc
  • 400-800 cc
  • >800 cc
By Number of Wheels
  • Four Wheel
  • >Four Wheel
By Fuel Type
  • Gasoline
  • Electric
Side-by-side vehicle, by region
  • Asia Oceania
  • Europe
  • North America
By Region
  • Asia Oceania
  • Europe
  • North America
  • Rest of the World

Recent Developments

  • In May 2023, Polaris Inc. introduced the 2024 XPEDITION XP and ADV models, establishing a brand-new category known as"Adventure side-by-sides." These innovative vehicles blend the off-road prowess of traditional side-by-sides with the comfort and cargo capacity typically associated with top-tier overlanding experiences.
  • In March 2023, Polaris Inc. introduced the RZR Pro R Factory, a UTV designed exclusively for competitive racing. This purpose-built vehicle has been meticulously engineered to excel in the challenging conditions of open desert racing.
  • In March 2023, Polaris Inc. launched the latest iteration of their highly popular sport side-by-side, the RZR XP, marking a significant leap forward in the industry. The 2024 RZR XP has been completely redesigned, aiming to set a new benchmark for sport side-by-side by offering unparalleled durability, comfort, and performance. This next-generation model raises the bar, elevating the standards for the entire industry.
  • In August 2022, Yamaha Motor Corporation introduced its off-road ATVs and Side-by-Side (SxS) vehicles for the 2023 model year. These vehicles are precisely designed, rigorously tested, and expertly crafted to offer all off-road enthusiasts’ exceptional capability, comfort, and confidence. Whether tackling tough ranch work or embarking on thrilling expeditions across challenging terrains, Yamaha surpasses customer expectations by delivering products that meet and exceed industry standards.
  • In January 2022, John Deere unveiled the XUV835R Signature Edition Gator Utility Vehicle and the XUV865R Signature Edition Gator Utility Vehicle, both equipped with premium, automotive-inspired features. These additions elevate John Deere's lineup of utility vehicles, offering enhanced features and capabilities to meet the needs of its customers.
  • In September 2021, Suzuki Motor Corporation introduced its KingQuad ATV product line. These KingQuad ATVs are known for their exceptional engineering and sturdy construction. Suzuki’s KingQuad ATVs have a 722 CC engine capacity with power steering. The 2023 KingQuad 750AXi Power Steering SE+ helps tackle challenging terrain with the capabilities that only a KingQuad possesses.
  • In October 2021, Polaris acquired a manufacturing facility in Monticello, which has enhanced its capabilities by adding in-house die-casting capabilities. This acquisition has made the facility vertically integrated, resulting in improved product quality and production efficiency.
  • In August 2021, Textron has unveiled the Alterra EPS 600, a new ATV model featuring a redesigned chassis and electronic power steering (EPS). The ATV's dashboard includes a Garmin GPS screen for easy tracking of location, music, and other group members. Additionally, the innovative design of the ATV helps to keep the rider protected from engine heat.
  • In July 2021, Polaris has unveiled its inaugural electric drive train series, which is equipped with a 110HP electric motor delivering 1401b-ft of torque. The lineup offers customers three different drive modes and boasts an impressive 80-mile range on a single charge. Additionally, the vehicle is designed to support fast charging for its battery pack.
  • In June 2021, Kawasaki has introduced the BRUTE FORCE 750 4x4i, a powerful off-road vehicle equipped with a fuel-injected 749cc V-twin engine, ensuring exceptional performance during outdoor expeditions. It offers features such as front differential lock, selectable drive modes, and continuous variable transmission (CVT) to enhance traction and overall performance. With a towing capacity of 1,250 pounds, independent suspension, and a double-cradle steel-tube frame, the vehicle delivers excellent straight-line tracking and responsive handling.
  • In September 2021, Yamaha has developed the Grizzly 90 specifically for young ATV riders aged ten and above. This sports model is equipped with a low-maintenance 90cc engine that utilizes air-cooling and wet-sump lubrication. The vehicle also features a CVT (continuously variable transmission) for improved transmission efficiency.
  • In March 2021, Honda has launched a new model with an overhead valve (OHV) longitudinally mounted engine that enhances power transfer efficiency. The vehicle offers manual clutch actuation, allowing riders to have a more interactive experience. With an air-cooled 229cc engine and independent double-wishbone front suspension, it provides a smooth and comfortable ride. Additionally, the vehicle is equipped with the innovative Honda SportClutch technology.

Frequently Asked Questions (FAQ):

To speak to our analyst for a discussion on the above findings, click Speak to Analyst

TABLE OF CONTENTS
 
1 INTRODUCTION (Page No. - 36)
    1.1 STUDY OBJECTIVES 
    1.2 MARKET DEFINITION 
           1.2.1 DEFINITION, BY DRIVE TYPE
                    TABLE 1 ALL-TERRAIN VEHICLE MARKET DEFINITION, BY DRIVE TYPE
           1.2.2 DEFINITION, BY TYPE
                    TABLE 2 ALL-TERRAIN VEHICLE MARKET DEFINITION, BY TYPE
    1.3 INCLUSIONS AND EXCLUSIONS 
           TABLE 3 INCLUSIONS AND EXCLUSIONS
    1.4 MARKET SCOPE 
           FIGURE 1 MARKETS COVERED
           1.4.1 REGIONS CONSIDERED
           1.4.2 YEARS CONSIDERED
    1.5 CURRENCY CONSIDERED 
           TABLE 4 CURRENCY EXCHANGE RATES
    1.6 STAKEHOLDERS 
    1.7 SUMMARY OF CHANGES 
 
2 RESEARCH METHODOLOGY (Page No. - 42)
    2.1 RESEARCH DATA 
           FIGURE 2 ALL-TERRAIN VEHICLE MARKET: RESEARCH DESIGN
           FIGURE 3 RESEARCH METHODOLOGY MODEL
           2.1.1 SECONDARY DATA
                    2.1.1.1 List of key secondary sources to estimate base numbers
                    2.1.1.2 Key data from secondary sources
           2.1.2 PRIMARY DATA
                    FIGURE 4 BREAKDOWN OF PRIMARY INTERVIEWS
                    2.1.2.1 Sampling techniques and data collection methods
    2.2 MARKET SIZE ESTIMATION 
           FIGURE 5 RESEARCH METHODOLOGY: HYPOTHESIS BUILDING
           2.2.1 BOTTOM-UP APPROACH: ALL-TERRAIN VEHICLE MARKET
                    FIGURE 6 BOTTOM-UP APPROACH: ALL-TERRAIN VEHICLE MARKET, BY TYPE
           2.2.2 TOP-DOWN APPROACH: ALL-TERRAIN VEHICLE MARKET
                    FIGURE 7 TOP-DOWN APPROACH: ALL-TERRAIN VEHICLE MARKET, BY ENGINE CAPACITY
    2.3 FACTOR ANALYSIS FOR MARKET SIZING: DEMAND AND SUPPLY SIDES 
    2.4 FACTORS IMPACTING ALL-TERRAIN VEHICLE MARKET 
    2.5 RECESSION IMPACT ON ALL-TERRAIN VEHICLE MARKET 
    2.6 MARKET BREAKDOWN AND DATA TRIANGULATION 
           FIGURE 8 DATA TRIANGULATION
    2.7 RECESSION IMPACT 
           2.7.1 INTRODUCTION
           2.7.2 REGIONAL MACROECONOMIC OVERVIEW
           2.7.3 ANALYSIS OF KEY ECONOMIC INDICATORS
                    TABLE 5 KEY ECONOMIC INDICATORS FOR SELECT COUNTRIES, 2021–2022
           2.7.4 ECONOMIC STAGFLATION (SLOWDOWN) VS. ECONOMIC RECESSION
                    2.7.4.1 Europe
                               TABLE 6 EUROPE: KEY ECONOMIC INDICATORS, 2021–2023
                    2.7.4.2 Asia Oceania
                               TABLE 7 ASIA OCEANIA: KEY ECONOMIC INDICATORS, 2021–2023
                    2.7.4.3 Americas
                               TABLE 8 AMERICAS: KEY ECONOMIC INDICATORS, 2021–2023
           2.7.5 ECONOMIC OUTLOOK/PROJECTIONS
                               TABLE 9 GDP GROWTH PROJECTIONS FOR KEY COUNTRIES, 2024–2027 (% GROWTH)
    2.8 ASSUMPTIONS AND ASSOCIATED RISKS 
           2.8.1 RESEARCH ASSUMPTIONS
           2.8.2 MARKET ASSUMPTIONS
                    TABLE 10 ASSUMPTIONS, ASSOCIATED RISKS, AND IMPACT
    2.9 RESEARCH LIMITATIONS 
 
3 EXECUTIVE SUMMARY (Page No. - 60)
    3.1 REPORT SUMMARY 
           FIGURE 9 ALL-TERRAIN VEHICLE MARKET OUTLOOK
           FIGURE 10 ALL-TERRAIN VEHICLE MARKET, BY REGION, 2023 VS. 2028 (USD MILLION)
 
4 PREMIUM INSIGHTS (Page No. - 63)
    4.1 ATTRACTIVE OPPORTUNITIES FOR PLAYERS IN ALL-TERRAIN VEHICLE MARKET 
           FIGURE 11 INCREASING PENETRATION OF UTILITY ATVS IN AGRICULTURE AND MILITARY & DEFENSE AND GROWING POPULARITY OF SPORTS AND RECREATIONAL ACTIVITIES TO DRIVE MARKET
    4.2 ALL-TERRAIN VEHICLE MARKET, BY TYPE 
           FIGURE 12 UTILITY ATV SEGMENT TO HOLD LARGER MARKET SHARE DURING FORECAST PERIOD
    4.3 ALL-TERRAIN VEHICLE MARKET, BY APPLICATION 
           FIGURE 13 SPORTS SEGMENT TO LEAD MARKET DURING FORECAST PERIOD
    4.4 ALL-TERRAIN VEHICLE MARKET, BY DRIVE TYPE 
           FIGURE 14 AWD SEGMENT TO WITNESS FASTEST CAGR DURING FORECAST PERIOD
    4.5 ALL-TERRAIN VEHICLE MARKET, BY FUEL TYPE 
           FIGURE 15 ELECTRIC SEGMENT TO REGISTER HIGHER CAGR DURING FORECAST PERIOD
    4.6 ALL-TERRAIN VEHICLE MARKET, BY ENGINE CAPACITY 
           FIGURE 16 400–800 CC SEGMENT TO LEAD MARKET DURING FORECAST PERIOD
    4.7 ALL-TERRAIN VEHICLE MARKET, BY NUMBER OF WHEELS 
           FIGURE 17 FOUR WHEELS SEGMENT TO LEAD ALL-TERRAIN VEHICLE MARKET DURING FORECAST PERIOD
    4.8 ALL-TERRAIN VEHICLE MARKET, BY SEATING CAPACITY 
           FIGURE 18 ONE-SEATER SEGMENT TO HOLD LARGER MARKET SHARE DURING FORECAST PERIOD
    4.9 SIDE-BY-SIDE MARKET, BY REGION 
           FIGURE 19 NORTH AMERICA TO LEAD MARKET DURING FORECAST PERIOD
    4.10 ALL-TERRAIN VEHICLE MARKET, BY REGION 
           FIGURE 20 ASIA OCEANIA TO BE FASTEST-GROWING MARKET DURING FORECAST PERIOD
 
5 MARKET OVERVIEW (Page No. - 69)
    5.1 INTRODUCTION 
    5.2 MARKET DYNAMICS 
           FIGURE 21 ALL-TERRAIN VEHICLE MARKET: MARKET DYNAMICS
           5.2.1 DRIVERS
                    5.2.1.1 Increasing off-road recreational activities
                    5.2.1.2 Increasing demand for ATVs in agriculture and military & defense
                    5.2.1.3 Rising purchasing power and spending capacity of individuals
                               FIGURE 22 GDP-BASED PURCHASING POWER PARITY FOR SELECTED COUNTRIES, 2019 VS. 2021 VS. 2023 VS. 2028
           5.2.2 RESTRAINTS
                    5.2.2.1 High accident rates
                               TABLE 11 GLOBAL FATAL INCIDENTS OF ATV RIDERS ON PUBLIC ROADS, BY AGE (2018–2021)
                    5.2.2.2 Restriction on ATV usage in wildlife zones
           5.2.3 OPPORTUNITIES
                    5.2.3.1 Increased use of technology in ATVs
                    5.2.3.2 Positive outlook toward electric ATVs
           5.2.4 CHALLENGES
                    5.2.4.1 Trade barriers between different regions
                    5.2.4.2 High cost of ATVs
                               TABLE 12 COST OF FAST-MOVING GASOLINE ALL-TERRAIN VEHICLES BY KEY OEMS (2022)
    5.3 TRENDS/DISRUPTIONS IMPACTING BUYERS 
    5.4 ALL-TERRAIN VEHICLE MARKET ECOSYSTEM 
           FIGURE 23 ALL-TERRAIN VEHICLE MARKET ECOSYSTEM
           5.4.1 ALL-TERRAIN VEHICLE MANUFACTURERS
           5.4.2 RAW MATERIAL/COMPONENT SUPPLIERS
           5.4.3 GOVERNMENT AND REGULATORY AUTHORITIES
           5.4.4 DEALERS AND DISTRIBUTORS
           5.4.5 SERVICE AND REPAIR CENTERS
           5.4.6 END USERS
                    TABLE 13 ALL-TERRAIN VEHICLE MARKET: ROLE OF COMPANIES IN ECOSYSTEM
    5.5 SUPPLY CHAIN ANALYSIS 
           FIGURE 24 ALL-TERRAIN VEHICLE MARKET: SUPPLY CHAIN ANALYSIS
    5.6 PRICING ANALYSIS 
           5.6.1 ALL-TERRAIN VEHICLE AVERAGE REGIONAL PRICE TREND, 2020 VS. 2022
           5.6.2 ALL-TERRAIN VEHICLE AVERAGE PRICE TREND, BY TYPE, 2020 VS. 2022
           5.6.3 TOP OEMS AND THEIR KEY MODELS PRICE RANGE, 2022
    5.7 CASE STUDY ANALYSIS 
           5.7.1 USE CASE 1: JOHN DEERE AND APPLIED MARKETING SCIENCE CASE STUDY
           5.7.2 USE CASE 2: POLARIS INC. AND COMTECH CASE STUDY
           5.7.3 USE CASE 3: KAWASAKI ARC WELDING SOLUTIONS FOR ALL-TERRAIN VEHICLES
    5.8 TRADE ANALYSIS 
           5.8.1 IMPORT DATA
                    5.8.1.1 US
                               TABLE 14 US: IMPORT SHARE OF SPECIALLY DESIGNED SNOWMOBILES, GOLF CARTS, AND OTHER ATVS, BY COUNTRY (VALUE %)
                    5.8.1.2 Mexico
                               TABLE 15 MEXICO: IMPORT SHARE OF SPECIALLY DESIGNED SNOWMOBILES, GOLF CARTS, AND OTHER ATVS, BY COUNTRY (VALUE %)
                    5.8.1.3 China
                               TABLE 16 CHINA: IMPORT SHARE OF SPECIALLY DESIGNED SNOWMOBILES, GOLF CARTS, AND OTHER ATVS, BY COUNTRY (VALUE %)
                    5.8.1.4 Japan
                               TABLE 17 JAPAN: IMPORT SHARE OF SPECIALLY DESIGNED SNOWMOBILES, GOLF CARTS, AND OTHER ATVS, BY COUNTRY (VALUE %)
                    5.8.1.5 India
                               TABLE 18 INDIA: IMPORT SHARE OF SPECIALLY DESIGNED SNOWMOBILES, GOLF CARTS, AND OTHER ATVS, BY COUNTRY (VALUE %)
                    5.8.1.6 Germany
                               TABLE 19 GERMANY: IMPORT SHARE OF SPECIALLY DESIGNED SNOWMOBILES, GOLF CARTS, AND OTHER ATVS, BY COUNTRY (VALUE %)
                    5.8.1.7 France
                               TABLE 20 FRANCE: IMPORT SHARE OF SPECIALLY DESIGNED SNOWMOBILES, GOLF CARTS, AND OTHER ATVS, BY COUNTRY (VALUE %)
                    5.8.1.8 Spain
                               TABLE 21 SPAIN: IMPORT SHARE OF SPECIALLY DESIGNED SNOWMOBILES, GOLF CARTS, AND OTHER ATVS, BY COUNTRY (VALUE %)
           5.8.2 EXPORT DATA
                    5.8.2.1 US
                               TABLE 22 US: EXPORT SHARE OF SPECIALLY DESIGNED SNOWMOBILES, GOLF CARTS, AND OTHER ATVS, BY COUNTRY (VALUE %)
                    5.8.2.2 China
                               TABLE 23 CHINA: EXPORT SHARE OF SPECIALLY DESIGNED SNOWMOBILES, GOLF CARTS, AND OTHER ATVS, BY COUNTRY (VALUE %)
                    5.8.2.3 Japan
                               TABLE 24 JAPAN: EXPORT SHARE OF SPECIALLY DESIGNED SNOWMOBILES, GOLF CARTS, AND OTHER ATVS, BY COUNTRY (VALUE %)
                    5.8.2.4 India
                               TABLE 25 INDIA: EXPORT SHARE OF SPECIALLY DESIGNED SNOWMOBILES, GOLF CARTS, AND OTHER ATVS, BY COUNTRY (VALUE %)
                    5.8.2.5 Germany
                               TABLE 26 GERMANY: EXPORT SHARE OF SPECIALLY DESIGNED SNOWMOBILES, GOLF CARTS, AND OTHER ATVS, BY COUNTRY (VALUE %)
                    5.8.2.6 France
                               TABLE 27 FRANCE: EXPORT SHARE OF SPECIALLY DESIGNED SNOWMOBILES, GOLF CARTS, AND OTHER ATVS, BY COUNTRY (VALUE %)
                    5.8.2.7 Spain
                               TABLE 28 SPAIN: EXPORT SHARE OF SPECIALLY DESIGNED SNOWMOBILES, GOLF CARTS, AND OTHER ATVS, BY COUNTRY (VALUE %)
    5.9 KEY CONFERENCES AND EVENTS IN 2023–2024 
           5.9.1 ALL-TERRAIN VEHICLE MARKET: UPCOMING CONFERENCES AND EVENTS
    5.10 PATENT ANALYSIS 
           5.10.1 APPLICATIONS AND PATENTS, 2019–2022
    5.11 BUYING CRITERIA 
                    FIGURE 25 KEY BUYING CRITERIA FOR ELECTRIC AND GASOLINE ATVS
                    TABLE 29 KEY BUYING CRITERIA FOR ELECTRIC AND GASOLINE ATVS
    5.12 REGULATORY LANDSCAPE 
           5.12.1 US: ALL-TERRAIN VEHICLE REGULATIONS
                    TABLE 30 US: ALL-TERRAIN VEHICLE REGULATIONS
           5.12.2 CANADA: ALL-TERRAIN VEHICLE REGULATIONS
                    TABLE 31 CANADA: ALL-TERRAIN VEHICLE REGULATIONS
           5.12.3 AUSTRALIA: ALL-TERRAIN VEHICLE REGULATIONS
                    TABLE 32 AUSTRALIA: ALL-TERRAIN VEHICLE REGULATIONS
           5.12.4 EUROPE: ALL-TERRAIN VEHICLE REGULATIONS
                    TABLE 33 EUROPE: ALL-TERRAIN VEHICLE REGULATIONS
           5.12.5 LIST OF REGULATORY BODIES, GOVERNMENT AGENCIES, AND OTHER ORGANIZATIONS
                    TABLE 34 LIST OF REGULATORY BODIES
    5.13 TECHNOLOGY TRENDS 
           5.13.1 HONDA TESTS PROTOTYPE AUTONOMOUS WORK VEHICLE AT SOLAR CONSTRUCTION SITE WITH BLACK & VEATCH
           5.13.2 ADVANCEMENTS IN BATTERY PACKS AND DEVELOPMENT OF WIRELESS AND AUTOMATED CHARGING FOR ELECTRIC ALL-TERRAIN VEHICLES
 
6 ALL-TERRAIN VEHICLE MARKET, BY DRIVE TYPE (Page No. - 104)
    6.1 INTRODUCTION 
           6.1.1 INDUSTRY INSIGHTS
                    FIGURE 26 ALL-TERRAIN VEHICLE MARKET, BY DRIVE TYPE, 2023 VS. 2028 (USD MILLION)
                    TABLE 35 ALL-TERRAIN VEHICLE MARKET, BY DRIVE TYPE, 2018–2022 (UNITS)
                    TABLE 36 ALL-TERRAIN VEHICLE MARKET, BY DRIVE TYPE, 2023–2028 (UNITS)
                    TABLE 37 ALL-TERRAIN VEHICLE MARKET, BY DRIVE TYPE, 2018–2022 (USD MILLION)
                    TABLE 38 ALL-TERRAIN VEHICLE MARKET, BY DRIVE TYPE, 2023–2028 (USD MILLION)
    6.2 2WD 
           6.2.1 TECHNICAL CHALLENGES AND GROWING POPULARITY OF 4WD TO IMPACT 2WD MARKET
                    TABLE 39 2WD: ALL-TERRAIN VEHICLE MARKET, BY REGION, 2018–2022 (UNITS)
                    TABLE 40 2WD: ALL-TERRAIN VEHICLE MARKET, BY REGION, 2023–2028 (UNITS)
                    TABLE 41 2WD: ALL-TERRAIN VEHICLE MARKET, BY REGION, 2018–2022 (USD MILLION)
                    TABLE 42 2WD: ALL-TERRAIN VEHICLE MARKET, BY REGION, 2023–2028 (USD MILLION)
    6.3 4WD 
           6.3.1 TECHNICAL ADVANTAGES LIKE BETTER TRACTION AND ABILITY TO SWITCH TO 2WD TO DRIVE 4WD MARKET
                    TABLE 43 4WD: ALL-TERRAIN VEHICLE MARKET, BY REGION, 2018–2022 (UNITS)
                    TABLE 44 4WD: ALL-TERRAIN VEHICLE MARKET, BY REGION, 2023–2028 (UNITS)
                    TABLE 45 4WD: ALL-TERRAIN VEHICLE MARKET, BY REGION, 2018–2022 (USD MILLION)
                    TABLE 46 4WD: ALL-TERRAIN VEHICLE MARKET, BY REGION, 2023–2028 (USD MILLION)
    6.4 AWD 
           6.4.1 GROWING TREND OF ELECTRIFICATION IN ATVS TO DRIVE AWD ATV MARKET
                    TABLE 47 AWD: ALL-TERRAIN VEHICLE MARKET, BY REGION, 2018–2022 (UNITS)
                    TABLE 48 AWD: ALL-TERRAIN VEHICLE MARKET, BY REGION, 2023–2028 (UNITS)
                    TABLE 49 AWD: ALL-TERRAIN VEHICLE MARKET, BY REGION, 2018–2022 (USD MILLION)
                    TABLE 50 AWD: ALL-TERRAIN VEHICLE MARKET, BY REGION, 2023–2028 (USD MILLION)
 
7 ALL-TERRAIN VEHICLE MARKET, BY FUEL TYPE (Page No. - 112)
    7.1 INTRODUCTION 
           7.1.1 INDUSTRY INSIGHTS
                    FIGURE 27 ALL-TERRAIN VEHICLE MARKET, BY FUEL TYPE, 2023 VS. 2028 (USD MILLION)
                    TABLE 51 ALL-TERRAIN VEHICLE MARKET, BY FUEL TYPE, 2018–2022 (UNITS)
                    TABLE 52 ALL-TERRAIN VEHICLE MARKET, BY FUEL TYPE, 2023–2028 (UNITS)
                    TABLE 53 ALL-TERRAIN VEHICLE MARKET, BY FUEL TYPE, 2018–2022 (USD MILLION)
                    TABLE 54 ALL-TERRAIN VEHICLE MARKET, BY FUEL TYPE, 2023–2028 (USD MILLION)
    7.2 ELECTRIC 
           7.2.1 DEVELOPMENTS IN BATTERY TECHNOLOGY AND LAUNCH OF VARIOUS MODELS FOR DIFFERENT APPLICATIONS TO DRIVE DEMAND
                    TABLE 55 ELECTRIC ALL-TERRAIN VEHICLE MARKET, BY REGION, 2018–2022 (UNITS)
                    TABLE 56 ELECTRIC ALL-TERRAIN VEHICLE MARKET, BY REGION, 2023–2028 (UNITS)
                    TABLE 57 ELECTRIC ALL-TERRAIN VEHICLE MARKET, BY REGION, 2018–2022 (USD MILLION)
                    TABLE 58 ELECTRIC ALL-TERRAIN VEHICLE MARKET, BY REGION, 2023–2028 (USD MILLION)
    7.3 GASOLINE 
           7.3.1 HIGHER POWER, EFFICIENCY, AND WIDER APPLICATION AREA TO BOOST DEMAND
                    TABLE 59 GASOLINE ALL-TERRAIN VEHICLE MARKET, BY REGION, 2018–2022 (UNITS)
                    TABLE 60 GASOLINE ALL-TERRAIN VEHICLE MARKET, BY REGION, 2023–2028 (UNITS)
                    TABLE 61 GASOLINE ALL-TERRAIN VEHICLE MARKET, BY REGION, 2018–2022 (USD MILLION)
                    TABLE 62 GASOLINE ALL-TERRAIN VEHICLE MARKET, BY REGION, 2023–2028 (USD MILLION)
 
8 ALL-TERRAIN VEHICLE MARKET, BY APPLICATION (Page No. - 118)
    8.1 INTRODUCTION 
           8.1.1 INDUSTRY INSIGHTS
                    FIGURE 28 ALL-TERRAIN VEHICLE MARKET, BY APPLICATION, 2023 VS. 2028 (USD MILLION)
                    TABLE 63 ALL-TERRAIN VEHICLE MARKET, BY APPLICATION, 2018–2022 (UNITS)
                    TABLE 64 ALL-TERRAIN VEHICLE MARKET, BY APPLICATION, 2023–2028 (UNITS)
                    TABLE 65 ALL-TERRAIN VEHICLE MARKET, BY APPLICATION, 2018–2022 (USD MILLION)
                    TABLE 66 ALL-TERRAIN VEHICLE MARKET, BY APPLICATION, 2023–2028 (USD MILLION)
    8.2 SPORTS 
           8.2.1 POPULARITY OF SPORTS EVENTS AND CHAMPIONSHIPS TO DRIVE DEMAND
                    TABLE 67 SPORTS: ALL-TERRAIN VEHICLE MARKET, BY REGION, 2018–2022 (UNITS)
                    TABLE 68 SPORTS: ALL-TERRAIN VEHICLE MARKET, BY REGION, 2023–2028 (UNITS)
                    TABLE 69 SPORTS: ALL-TERRAIN VEHICLE MARKET, BY REGION, 2018–2022 (USD MILLION)
                    TABLE 70 SPORTS: ALL-TERRAIN VEHICLE MARKET, BY REGION, 2023–2028 (USD MILLION)
    8.3 ENTERTAINMENT 
           8.3.1 GROWING NUMBER OF LEISURE ENTHUSIASTS TO DRIVE DEMAND
                    TABLE 71 ENTERTAINMENT: ALL-TERRAIN VEHICLE MARKET, BY REGION, 2018–2022 (UNITS)
                    TABLE 72 ENTERTAINMENT: ALL-TERRAIN VEHICLE MARKET, BY REGION, 2023–2028 (UNITS)
                    TABLE 73 ENTERTAINMENT: ALL-TERRAIN VEHICLE MARKET, BY REGION, 2018–2022 (USD MILLION)
                    TABLE 74 ENTERTAINMENT: ALL-TERRAIN VEHICLE MARKET, BY REGION, 2023–2028 (USD MILLION)
    8.4 AGRICULTURE 
           8.4.1 GROWING FARM MECHANIZATION TO DRIVE DEMAND
                    TABLE 75 AGRICULTURE: ALL-TERRAIN VEHICLE MARKET, BY REGION, 2018–2022 (UNITS)
                    TABLE 76 AGRICULTURE: ALL-TERRAIN VEHICLE MARKET, BY REGION, 2023–2028 (UNITS)
                    TABLE 77 AGRICULTURE: ALL-TERRAIN VEHICLE MARKET, BY REGION, 2018–2022 (USD MILLION)
                    TABLE 78 AGRICULTURE: ALL-TERRAIN VEHICLE MARKET, BY REGION, 2023–2028 (USD MILLION)
    8.5 MILITARY & DEFENSE 
           8.5.1 GROWING R&D AND INVESTMENTS TO DEVELOP ATVS THAT CAN OPERATE IN EXTREME CONDITIONS TO DRIVE DEMAND
                    TABLE 79 MILITARY & DEFENSE: ALL-TERRAIN VEHICLE MARKET, BY REGION, 2018–2022 (UNITS)
                    TABLE 80 MILITARY & DEFENSE: ALL-TERRAIN VEHICLE MARKET, BY REGION, 2023–2028 (UNITS)
                    TABLE 81 MILITARY & DEFENSE: ALL-TERRAIN VEHICLE MARKET, BY REGION, 2018–2022 (USD MILLION)
                    TABLE 82 MILITARY & DEFENSE: ALL-TERRAIN VEHICLE MARKET, BY REGION, 2023–2028 (USD MILLION)
    8.6 OTHERS 
           TABLE 83 OTHERS: ALL-TERRAIN VEHICLE MARKET, BY REGION, 2018–2022 (UNITS)
           TABLE 84 OTHERS: ALL-TERRAIN VEHICLE MARKET, BY REGION, 2023–2028 (UNITS)
           TABLE 85 OTHERS: ALL-TERRAIN VEHICLE MARKET, BY REGION, 2018–2022 (USD MILLION)
           TABLE 86 OTHERS: ALL-TERRAIN VEHICLE MARKET, BY REGION, 2023–2028 (USD MILLION)
 
9 ALL-TERRAIN VEHICLE MARKET, BY ENGINE CAPACITY (Page No. - 131)
    9.1 INTRODUCTION 
           9.1.1 INDUSTRY INSIGHTS
                    FIGURE 29 ALL-TERRAIN VEHICLE MARKET, BY ENGINE CAPACITY, 2023 VS. 2028 (USD MILL
                    TABLE 87 ALL-TERRAIN VEHICLE MARKET, BY ENGINE CAPACITY, 2018–2022 (UNITS)
                    TABLE 88 ALL-TERRAIN VEHICLE MARKET, BY ENGINE CAPACITY, 2023–2028 (UNITS)
                    TABLE 89 ALL-TERRAIN VEHICLE MARKET, BY ENGINE CAPACITY, 2018–2022 (USD MILLION)
                    TABLE 90 ALL-TERRAIN VEHICLE MARKET, BY ENGINE CAPACITY, 2023–2028 (USD MILLION)
    9.2 <400 CC 
           9.2.1 RISING DEMAND FOR ATVS WITH <400 CC ENGINE CAPACITY IN SPORTS AND OFF-ROAD ACTIVITIES TO DRIVE MARKET
                    TABLE 91 <400 CC: ALL-TERRAIN VEHICLE MARKET, BY REGION, 2018–2022 (UNITS)
                    TABLE 92 <400 CC: ALL-TERRAIN VEHICLE MARKET, BY REGION, 2023–2028 (UNITS)
                    TABLE 93 <400 CC: ALL-TERRAIN VEHICLE MARKET, BY REGION, 2018–2022 (USD MILLION)
                    TABLE 94 <400 CC: ALL-TERRAIN VEHICLE MARKET, BY REGION, 2023–2028 (USD MILLION)
    9.3 400–800 CC 
           9.3.1 HIGH DELIVERING POWER AND BETTER FUEL EFFICIENCY TO DRIVE SEGMENT
                    TABLE 95 400–800 CC: ALL-TERRAIN VEHICLE MARKET, BY REGION, 2018–2022 (UNITS)
                    TABLE 96 400–800 CC: ALL-TERRAIN VEHICLE MARKET, BY REGION, 2023–2028 (UNITS)
                    TABLE 97 400–800 CC: ALL-TERRAIN VEHICLE MARKET, BY REGION, 2018–2022 (USD MILLION)
                    TABLE 98 400–800 CC: ALL-TERRAIN VEHICLE MARKET, BY REGION, 2023–2028 (USD MILLION)
    9.4 >800 CC 
           9.4.1 ATVS WITH >800 CC ENGINE CAPACITY TO OFFER EXTREME POWER AND TORQUE REQUIREMENTS
                    TABLE 99 >800 CC: ALL-TERRAIN VEHICLE MARKET, BY REGION, 2018–2022 (UNITS)
                    TABLE 100 >800 CC: ALL-TERRAIN VEHICLE MARKET, BY REGION, 2023–2028 (UNITS)
                    TABLE 101 >800 CC: ALL-TERRAIN VEHICLE MARKET, BY REGION, 2018–2022 (USD MILLION)
                    TABLE 102 >800 CC: ALL-TERRAIN VEHICLE MARKET, BY REGION, 2023–2028 (USD MILLION)
 
10 ALL-TERRAIN VEHICLE MARKET, BY SEATING CAPACITY (Page No. - 139)
     10.1 INTRODUCTION 
             10.1.1 INDUSTRY INSIGHTS
                       FIGURE 30 ALL-TERRAIN VEHICLE MARKET, BY SEATING CAPACITY, 2023 VS. 2028 (USD MILLION)
                       TABLE 103 ALL-TERRAIN VEHICLE MARKET, BY SEATING CAPACITY, 2018–2022 (UNITS)
                       TABLE 104 ALL-TERRAIN VEHICLE MARKET, BY SEATING CAPACITY, 2023–2028 (UNITS)
                       TABLE 105 ALL-TERRAIN VEHICLE MARKET, BY SEATING CAPACITY, 2018–2022 (USD MILLION)
                       TABLE 106 ALL-TERRAIN VEHICLE MARKET, BY SEATING CAPACITY, 2023–2028 (USD MILLION)
     10.2 ONE-SEATER 
             10.2.1 LOWER COST TO DRIVE DEMAND FOR ONE-SEATER ATVS
                       TABLE 107 ONE-SEATER: ALL-TERRAIN VEHICLE MARKET, BY REGION, 2018–2022 (UNITS)
                       TABLE 108 ONE-SEATER: ALL-TERRAIN VEHICLE MARKET, BY REGION, 2023–2028 (UNITS)
                       TABLE 109 ONE-SEATER: ALL-TERRAIN VEHICLE MARKET, BY REGION, 2018–2022 (USD MILLION)
                       TABLE 110 ONE-SEATER: ALL-TERRAIN VEHICLE MARKET, BY REGION, 2023–2028 (USD MILLION)
     10.3 ≥TWO-SEATER 
             10.3.1 REDUCED MAINTENANCE AND INCREASED SAFETY TO DRIVE DEMAND FOR ≥TWO-SEATER ATVS
                       TABLE 111 ≥TWO-SEATER: ALL-TERRAIN VEHICLE MARKET, BY REGION, 2018–2022 (UNITS)
                       TABLE 112 ≥TWO-SEATER: ALL-TERRAIN VEHICLE MARKET, BY REGION, 2023–2028 (UNITS)
                       TABLE 113 ≥TWO-SEATER: ALL-TERRAIN VEHICLE MARKET, BY REGION, 2018–2022 (USD MILLION)
                       TABLE 114 ≥TWO-SEATER: ALL-TERRAIN VEHICLE MARKET, BY REGION, 2023–2028 (USD MILLION)
 
11 ALL-TERRAIN VEHICLE MARKET, BY TYPE (Page No. - 145)
     11.1 INTRODUCTION 
             11.1.1 INDUSTRY INSIGHTS
                       FIGURE 31 ALL-TERRAIN VEHICLE MARKET, BY TYPE, 2023 VS. 2028 (USD MILLION)
                       TABLE 115 ALL-TERRAIN VEHICLE MARKET, BY TYPE, 2018–2022 (UNITS)
                       TABLE 116 ALL-TERRAIN VEHICLE MARKET, BY TYPE, 2023–2028 (UNITS)
                       TABLE 117 ALL-TERRAIN VEHICLE MARKET, BY TYPE, 2018–2022 (USD MILLION)
                       TABLE 118 ALL-TERRAIN VEHICLE MARKET, BY TYPE, 2023–2028 (USD MILLION)
     11.2 UTILITY 
             11.2.1 INCREASING APPLICATION IN FARMS AND AGRICULTURAL PRACTICES TO DRIVE UTILITY SEGMENT
                       TABLE 119 UTILITY: ALL-TERRAIN VEHICLE MARKET, BY REGION, 2018–2022 (UNITS)
                       TABLE 120 UTILITY: ALL-TERRAIN VEHICLE MARKET, BY REGION, 2023–2028 (UNITS)
                       TABLE 121 UTILITY: ALL-TERRAIN VEHICLE MARKET, BY REGION, 2018–2022 (USD MILLION)
                       TABLE 122 UTILITY: ALL-TERRAIN VEHICLE MARKET, BY REGION, 2023–2028 (USD MILLION)
     11.3 SPORT 
             11.3.1 ASIA OCEANIA TO BE FASTEST-GROWING MARKET FOR SPORT ATVS
                       TABLE 123 SPORT: ALL-TERRAIN VEHICLE MARKET, BY REGION, 2018–2022 (UNITS)
                       TABLE 124 SPORT: ALL-TERRAIN VEHICLE MARKET, BY REGION, 2023–2028 (UNITS)
                       TABLE 125 SPORT: ALL-TERRAIN VEHICLE MARKET, BY REGION, 2018–2022 (USD MILLION)
                       TABLE 126 SPORT: ALL-TERRAIN VEHICLE MARKET, BY REGION, 2023–2028 (USD MILLION)
 
12 ALL-TERRAIN VEHICLE MARKET, BY NUMBER OF WHEELS (Page No. - 152)
     12.1 INTRODUCTION 
             12.1.1 INDUSTRY INSIGHTS
                       FIGURE 32 ALL-TERRAIN VEHICLE MARKET, BY NUMBER OF WHEELS, 2023 VS. 2028 (USD MILLION)
                       TABLE 127 ALL-TERRAIN VEHICLE MARKET, BY NUMBER OF WHEELS, 2018–2022 (UNITS)
                       TABLE 128 ALL-TERRAIN VEHICLE MARKET, BY NUMBER OF WHEELS, 2023–2028 (UNITS)
                       TABLE 129 ALL-TERRAIN VEHICLE MARKET, BY NUMBER OF WHEELS, 2018–2022 (USD MILLION)
                       TABLE 130 ALL-TERRAIN VEHICLE MARKET, BY NUMBER OF WHEELS, 2023–2028 (USD MILLION)
     12.2 FOUR WHEELS 
             12.2.1 INCREASED SPORTS AND RECREATIONAL ACTIVITIES TO DRIVE DEMAND
                       TABLE 131 FOUR WHEELS: ALL-TERRAIN VEHICLE MARKET, BY REGION, 2018–2022 (UNITS)
                       TABLE 132 FOUR WHEELS: ALL-TERRAIN VEHICLE MARKET, BY REGION, 2023–2028 (UNITS)
                       TABLE 133 FOUR WHEELS: ALL-TERRAIN VEHICLE MARKET, BY REGION, 2018–2022 (USD MILLION)
                       TABLE 134 FOUR WHEELS: ALL-TERRAIN VEHICLE MARKET, BY REGION, 2023–2028 (USD MILLION)
     12.3 >FOUR WHEELS 
             12.3.1 GROWING DEMAND FOR UTILITY ATVS IN AGRICULTURE, CONSTRUCTION, AND MINING TO DRIVE SEGMENT
                       TABLE 135 >FOUR WHEELS: ALL-TERRAIN VEHICLE MARKET, BY REGION, 2018–2022 (UNITS)
                       TABLE 136 >FOUR WHEELS: ALL-TERRAIN VEHICLE MARKET, BY REGION, 2023–2028 (UNITS)
                       TABLE 137 >FOUR WHEELS: ALL-TERRAIN VEHICLE MARKET, BY REGION, 2018–2022 (USD MILLION)
                       TABLE 138 >FOUR WHEELS: ALL-TERRAIN VEHICLE MARKET, BY REGION, 2023–2028 (USD MILLION)
 
13 SIDE-BY-SIDE VEHICLE MARKET, BY REGION (Page No. - 158)
     13.1 INTRODUCTION 
             13.1.1 INDUSTRY INSIGHTS
                       FIGURE 33 SIDE-BY-SIDE VEHICLE MARKET, BY REGION, 2023 VS. 2028 (USD MILLION)
                       TABLE 139 SIDE-BY-SIDE VEHICLE MARKET, BY REGION, 2018–2022 (UNITS)
                       TABLE 140 SIDE-BY-SIDE VEHICLE MARKET, BY REGION, 2023–2028 (UNITS)
                       TABLE 141 SIDE-BY-SIDE VEHICLE MARKET, BY REGION, 2018–2022 (USD MILLION)
                       TABLE 142 SIDE-BY-SIDE VEHICLE MARKET, BY REGION, 2023–2028 (USD MILLION)
 
14 ALL-TERRAIN VEHICLE MARKET, BY REGION (Page No. - 162)
     14.1 INTRODUCTION 
             14.1.1 INDUSTRY INSIGHTS
                       FIGURE 34 ALL-TERRAIN VEHICLE MARKET, BY REGION, 2023–2028 (USD MILLION)
                       TABLE 143 ALL-TERRAIN VEHICLE MARKET, BY REGION, 2018–2022 (UNITS)
                       TABLE 144 ALL-TERRAIN VEHICLE MARKET, BY REGION, 2023–2028 (UNITS)
                       TABLE 145 ALL-TERRAIN VEHICLE MARKET, BY REGION, 2018–2022 (USD MILLION)
                       TABLE 146 ALL-TERRAIN VEHICLE MARKET, BY REGION, 2023–2028 (USD MILLION)
     14.2 ASIA OCEANIA 
             14.2.1 RECESSION IMPACT
                       FIGURE 35 ASIA OCEANIA: ALL-TERRAIN VEHICLE MARKET SNAPSHOT
                       TABLE 147 ASIA OCEANIA: ALL-TERRAIN VEHICLE MARKET, BY COUNTRY, 2018–2022 (UNITS)
                       TABLE 148 ASIA OCEANIA: ALL-TERRAIN VEHICLE MARKET, BY COUNTRY, 2023–2028 (UNITS)
                       TABLE 149 ASIA OCEANIA: ALL-TERRAIN VEHICLE MARKET, BY COUNTRY, 2018–2022 (USD MILLION)
                       TABLE 150 ASIA OCEANIA: ALL-TERRAIN VEHICLE MARKET, BY COUNTRY, 2023–2028 (USD MILLION)
             14.2.2 CHINA
                       14.2.2.1 Large-scale domestic manufacturing of ATVs and increased adoption in farming to drive market
                                   TABLE 151 CHINA: LIST OF MAJOR ATV MANUFACTURERS AND THEIR KEY INDICATIVE MODELS
                                   TABLE 152 CHINA: ALL-TERRAIN VEHICLE MARKET, BY TYPE, 2018–2022 (UNITS)
                                   TABLE 153 CHINA: ALL-TERRAIN VEHICLE MARKET, BY TYPE, 2023–2028 (UNITS)
                                   TABLE 154 CHINA: ALL-TERRAIN VEHICLE MARKET, BY TYPE, 2018–2022 (USD MILLION)
                                   TABLE 155 CHINA: ALL-TERRAIN VEHICLE MARKET, BY TYPE, 2023–2028 (USD MILLION)
             14.2.3 AUSTRALIA
                       14.2.3.1 Introduction of safety regulations like installation of rollover protection devices to drive market
                                   TABLE 156 AUSTRALIA: LIST OF MAJOR ATV MANUFACTURERS AND THEIR KEY INDICATIVE MODELS
                                   TABLE 157 AUSTRALIA: ALL-TERRAIN VEHICLE MARKET, BY TYPE, 2018–2022 (UNITS)
                                   TABLE 158 AUSTRALIA: ALL-TERRAIN VEHICLE MARKET, BY TYPE, 2023–2028 (UNITS)
                                   TABLE 159 AUSTRALIA: ALL-TERRAIN VEHICLE MARKET, BY TYPE, 2018–2022 (USD MILLION)
                                   TABLE 160 AUSTRALIA: ALL-TERRAIN VEHICLE MARKET, BY TYPE, 2023–2028 (USD MILLION)
             14.2.4 NEW ZEALAND
                       14.2.4.1 Increasing popularity of sports events and championships to drive sport ATV segment
                                   TABLE 161 NEW ZEALAND: LIST OF MAJOR ATV MANUFACTURERS AND THEIR KEY INDICATIVE MODELS
                                   TABLE 162 NEW ZEALAND: ALL-TERRAIN VEHICLE MARKET, BY TYPE, 2018–2022 (UNITS)
                                   TABLE 163 NEW ZEALAND: ALL-TERRAIN VEHICLE MARKET, BY TYPE, 2023–2028 (UNITS)
                                   TABLE 164 NEW ZEALAND: ALL-TERRAIN VEHICLE MARKET, BY TYPE, 2018–2022 (USD MILLION)
                                   TABLE 165 NEW ZEALAND: ALL-TERRAIN VEHICLE MARKET, BY TYPE, 2023–2028 (USD MILLION)
             14.2.5 JAPAN
                       14.2.5.1 Growing demand for ATVs in sports events and championships to drive market
                                   TABLE 166 JAPAN: LIST OF MAJOR ATV MANUFACTURERS AND THEIR KEY INDICATIVE MODELS
                                   TABLE 167 JAPAN: ALL-TERRAIN VEHICLE MARKET, BY TYPE, 2018–2022 (UNITS)
                                   TABLE 168 JAPAN: ALL-TERRAIN VEHICLE MARKET, BY TYPE, 2023–2028 (UNITS)
                                   TABLE 169 JAPAN: ALL-TERRAIN VEHICLE MARKET, BY TYPE, 2018–2022 (USD MILLION)
                                   TABLE 170 JAPAN: ALL-TERRAIN VEHICLE MARKET, BY TYPE, 2023–2028 (USD MILLION)
             14.2.6 INDIA
                       14.2.6.1 Introduction of new models for agriculture applications to drive market
                                   TABLE 171 INDIA: LIST OF MAJOR ATV MANUFACTURERS AND THEIR KEY INDICATIVE MODELS
                                   TABLE 172 INDIA: ALL-TERRAIN VEHICLE MARKET, BY TYPE, 2018–2022 (UNITS)
                                   TABLE 173 INDIA: ALL-TERRAIN VEHICLE MARKET, BY TYPE, 2023–2028 (UNITS)
                                   TABLE 174 INDIA: ALL-TERRAIN VEHICLE MARKET, BY TYPE, 2018–2022 (USD MILLION)
                                   TABLE 175 INDIA: ALL-TERRAIN VEHICLE MARKET, BY TYPE, 2023–2028 (USD MILLION)
     14.3 EUROPE 
             14.3.1 RECESSION IMPACT
                       FIGURE 36 EUROPE: ALL-TERRAIN VEHICLE MARKET SNAPSHOT
                       TABLE 176 EUROPE: ALL-TERRAIN VEHICLE MARKET, BY COUNTRY, 2018–2022 (UNITS)
                       TABLE 177 EUROPE: ALL-TERRAIN VEHICLE MARKET, BY COUNTRY, 2023–2028 (UNITS)
                       TABLE 178 EUROPE: ALL-TERRAIN VEHICLE MARKET, BY COUNTRY, 2018–2022 (USD MILLION)
                       TABLE 179 EUROPE: ALL-TERRAIN VEHICLE MARKET, BY COUNTRY, 2023–2028 (USD MILLION)
             14.3.2 GERMANY
                       14.3.2.1 Growing penetration of ATVs in military and defense to drive market
                                   TABLE 180 GERMANY: LIST OF MAJOR ATV MANUFACTURERS AND THEIR KEY INDICATIVE MODELS
                                   TABLE 181 GERMANY: ALL-TERRAIN VEHICLE MARKET, BY TYPE, 2018–2022 (UNITS)
                                   TABLE 182 GERMANY: ALL-TERRAIN VEHICLE MARKET, BY TYPE, 2023–2028 (UNITS)
                                   TABLE 183 GERMANY: ALL-TERRAIN VEHICLE MARKET, BY TYPE, 2018–2022 (USD MILLION)
                                   TABLE 184 GERMANY: ALL-TERRAIN VEHICLE MARKET, BY TYPE, 2023–2028 (USD MILLION)
             14.3.3 FRANCE
                       14.3.3.1 Increasing adoption of ATVs in construction and farming activities to drive market
                                   TABLE 185 FRANCE: LIST OF MAJOR ATV MANUFACTURERS AND THEIR KEY INDICATIVE MODELS
                                   TABLE 186 FRANCE: ALL-TERRAIN VEHICLE MARKET, BY TYPE, 2018–2022 (UNITS)
                                   TABLE 187 FRANCE: ALL-TERRAIN VEHICLE MARKET, BY TYPE, 2023–2028 (UNITS)
                                   TABLE 188 FRANCE: ALL-TERRAIN VEHICLE MARKET, BY TYPE, 2018–2022 (USD MILLION)
                                   TABLE 189 FRANCE: ALL-TERRAIN VEHICLE MARKET, BY TYPE, 2023–2028 (USD MILLION)
             14.3.4 RUSSIA
                       14.3.4.1 Rising demand for ATVs in defense and agriculture to drive market
                                   TABLE 190 RUSSIA: LIST OF MAJOR ATV MANUFACTURERS AND THEIR KEY INDICATIVE MODELS
                                   TABLE 191 RUSSIA: ALL-TERRAIN VEHICLE MARKET, BY TYPE, 2018–2022 (UNITS)
                                   TABLE 192 RUSSIA: ALL-TERRAIN VEHICLE MARKET, BY TYPE, 2023–2028 (UNITS)
                                   TABLE 193 RUSSIA: ALL-TERRAIN VEHICLE MARKET, BY TYPE, 2018–2022 (USD MILLION)
                                   TABLE 194 RUSSIA: ALL-TERRAIN VEHICLE MARKET, BY TYPE, 2023–2028 (USD MILLION)
             14.3.5 UK
                       14.3.5.1 Development of quad bikes for military purposes to drive market
                                   TABLE 195 UK: LIST OF MAJOR ATV MANUFACTURERS AND THEIR KEY INDICATIVE MODELS
                                   TABLE 196 UK: ALL-TERRAIN VEHICLE MARKET, BY TYPE, 2018–2022 (UNITS)
                                   TABLE 197 UK: ALL-TERRAIN VEHICLE MARKET, BY TYPE, 2023–2028 (UNITS)
                                   TABLE 198 UK: ALL-TERRAIN VEHICLE MARKET, BY TYPE, 2018–2022 (USD MILLION)
                                   TABLE 199 UK: ALL-TERRAIN VEHICLE MARKET, BY TYPE, 2023–2028 (USD MILLION)
             14.3.6 SPAIN
                       14.3.6.1 Growing demand for agriculture applications to drive market
                                   TABLE 200 SPAIN: ALL-TERRAIN VEHICLE MARKET, BY TYPE, 2018–2022 (UNITS)
                                   TABLE 201 SPAIN: ALL-TERRAIN VEHICLE MARKET, BY TYPE, 2023–2028 (UNITS)
                                   TABLE 202 SPAIN: ALL-TERRAIN VEHICLE MARKET, BY TYPE, 2018–2022 (USD MILLION)
                                   TABLE 203 SPAIN: ALL-TERRAIN VEHICLE MARKET, BY TYPE, 2023–2028 (USD MILLION)
             14.3.7 SWEDEN
                       14.3.7.1 Decline in demand due to Russia-Ukraine war
                                   TABLE 204 SWEDEN: LIST OF MAJOR ATV MANUFACTURERS AND THEIR KEY INDICATIVE MODELS
                                   TABLE 205 SWEDEN: ALL-TERRAIN VEHICLE MARKET, BY TYPE, 2018–2022 (UNITS)
                                   TABLE 206 SWEDEN: ALL-TERRAIN VEHICLE MARKET, BY TYPE, 2023–2028 (UNITS)
                                   TABLE 207 SWEDEN: ALL-TERRAIN VEHICLE MARKET, BY TYPE, 2018–2022 (USD MILLION)
                                   TABLE 208 SWEDEN: ALL-TERRAIN VEHICLE MARKET, BY TYPE, 2023–2028 (USD MILLION)
             14.3.8 REST OF EUROPE
                       TABLE 209 REST OF EUROPE: ALL-TERRAIN VEHICLE MARKET, BY TYPE, 2018–2022 (UNITS)
                       TABLE 210 REST OF EUROPE: ALL-TERRAIN VEHICLE MARKET, BY TYPE, 2023–2028 (UNITS)
                       TABLE 211 REST OF EUROPE: ALL-TERRAIN VEHICLE MARKET, BY TYPE, 2018–2022 (USD MILLION)
                       TABLE 212 REST OF EUROPE: ALL-TERRAIN VEHICLE MARKET, BY TYPE, 2023–2028 (USD MILLION)
     14.4 NORTH AMERICA 
             14.4.1 RECESSION IMPACT
                       FIGURE 37 NORTH AMERICA: ALL-TERRAIN VEHICLE MARKET SNAPSHOT
                       TABLE 213 NORTH AMERICA: ALL-TERRAIN VEHICLE MARKET, BY COUNTRY, 2018–2022 (UNITS)
                       TABLE 214 NORTH AMERICA: ALL-TERRAIN VEHICLE MARKET, BY COUNTRY, 2023–2028 (UNITS)
                       TABLE 215 NORTH AMERICA: ALL-TERRAIN VEHICLE MARKET, BY COUNTRY, 2018–2022 (USD MILLION)
                       TABLE 216 NORTH AMERICA: ALL-TERRAIN VEHICLE MARKET, BY COUNTRY, 2023–2028 (USD MILLION)
             14.4.2 US
                       14.4.2.1 High preference for recreational activities and growing usage of ATVs in military applications to drive market
                                   TABLE 217 US: LIST OF MAJOR ATV MANUFACTURERS AND THEIR KEY INDICATIVE MODELS
                                   TABLE 218 US: ALL-TERRAIN VEHICLE MARKET, BY TYPE, 2018–2022 (UNITS)
                                   TABLE 219 US: ALL-TERRAIN VEHICLE MARKET, BY TYPE, 2023–2028 (UNITS)
                                   TABLE 220 US: ALL-TERRAIN VEHICLE MARKET, BY TYPE, 2018–2022 (USD MILLION)
                                   TABLE 221 US: ALL-TERRAIN VEHICLE MARKET, BY TYPE, 2023–2028 (USD MILLION)
             14.4.3 CANADA
                       14.4.3.1 Growing popularity of off-road racing events and government efforts to legalize ATVs in some provinces to drive market
                                   TABLE 222 CANADA: LIST OF MAJOR ATV MANUFACTURERS AND THEIR KEY INDICATIVE MODELS
                                   TABLE 223 CANADA: ALL-TERRAIN VEHICLE MARKET, BY TYPE, 2018–2022 (UNITS)
                                   TABLE 224 CANADA: ALL-TERRAIN VEHICLE MARKET, BY TYPE, 2023–2028 (UNITS)
                                   TABLE 225 CANADA: ALL-TERRAIN VEHICLE MARKET, BY TYPE, 2018–2022 (USD MILLION)
                                   TABLE 226 CANADA: ALL-TERRAIN VEHICLE MARKET, BY TYPE, 2023–2028 (USD MILLION)
             14.4.4 MEXICO
                       14.4.4.1 Presence of well-established OEMs and growing off-roading industry to drive market
                                   TABLE 227 MEXICO: LIST OF MAJOR ATV MANUFACTURERS AND THEIR KEY INDICATIVE MODELS
                                   TABLE 228 MEXICO: ALL-TERRAIN VEHICLE MARKET, BY TYPE, 2018–2022 (UNITS)
                                   TABLE 229 MEXICO: ALL-TERRAIN VEHICLE MARKET, BY TYPE, 2023–2028 (UNITS)
                                   TABLE 230 MEXICO: ALL-TERRAIN VEHICLE MARKET, BY TYPE, 2018–2022 (USD MILLION)
                                   TABLE 231 MEXICO: ALL-TERRAIN VEHICLE MARKET, BY TYPE, 2023–2028 (USD MILLION)
     14.5 REST OF THE WORLD 
             14.5.1 RECESSION IMPACT
                       FIGURE 38 REST OF THE WORLD: ALL-TERRAIN VEHICLE MARKET, 2023 VS. 2028 (USD MILLION)
                       TABLE 232 REST OF THE WORLD: ALL-TERRAIN VEHICLE MARKET, BY COUNTRY, 2018–2022 (UNITS)
                       TABLE 233 REST OF THE WORLD: ALL-TERRAIN VEHICLE MARKET, BY COUNTRY, 2023–2028 (UNITS)
                       TABLE 234 REST OF THE WORLD: ALL-TERRAIN VEHICLE MARKET, BY COUNTRY, 2018–2022 (USD MILLION)
                       TABLE 235 REST OF THE WORLD: ALL-TERRAIN VEHICLE MARKET, BY COUNTRY, 2023–2028 (USD MILLION)
             14.5.2 BRAZIL
                       14.5.2.1 Increasing penetration of ATVs in government forest departments and availability of several models to drive market
                                   TABLE 236 BRAZIL: LIST OF MAJOR ATV MANUFACTURERS AND THEIR KEY INDICATIVE MODELS
                                   TABLE 237 BRAZIL: ALL-TERRAIN VEHICLE MARKET, BY TYPE, 2018–2022 (UNITS)
                                   TABLE 238 BRAZIL: ALL-TERRAIN VEHICLE MARKET, BY TYPE, 2023–2028 (UNITS)
                                   TABLE 239 BRAZIL: ALL-TERRAIN VEHICLE MARKET, BY TYPE, 2018–2022 (USD MILLION)
                                   TABLE 240 BRAZIL: ALL-TERRAIN VEHICLE MARKET, BY TYPE, 2023–2028 (USD MILLION)
             14.5.3 UAE
                       14.5.3.1 Growing tourism sector to drive demand for sport ATVs
                                   TABLE 241 UAE: LIST OF MAJOR ATV MANUFACTURERS AND THEIR KEY INDICATIVE MODELS
                                   TABLE 242 UAE: ALL-TERRAIN VEHICLE MARKET, BY TYPE, 2018–2022 (UNITS)
                                   TABLE 243 UAE: ALL-TERRAIN VEHICLE MARKET, BY TYPE, 2023–2028 (UNITS)
                                   TABLE 244 UAE: ALL-TERRAIN VEHICLE MARKET, BY TYPE, 2018–2022 (USD MILLION)
                                   TABLE 245 UAE: ALL-TERRAIN VEHICLE MARKET, BY TYPE, 2023–2028 (USD MILLION)
             14.5.4 SOUTH AFRICA
                       14.5.4.1 Increasing demand for utility ATVs to access difficult terrains
                                   TABLE 246 SOUTH AFRICA: LIST OF MAJOR ATV MANUFACTURERS AND THEIR KEY INDICATIVE MODELS
                                   TABLE 247 SOUTH AFRICA: ALL-TERRAIN VEHICLE MARKET, BY TYPE, 2018–2022 (UNITS)
                                   TABLE 248 SOUTH AFRICA: ALL-TERRAIN VEHICLE MARKET, BY TYPE, 2023–2028 (UNITS)
                                   TABLE 249 SOUTH AFRICA: ALL-TERRAIN VEHICLE MARKET, BY TYPE, 2018–2022 (USD MILLION)
                                   TABLE 250 SOUTH AFRICA: ALL-TERRAIN VEHICLE MARKET, BY TYPE, 2023–2028 (USD MILLION)
             14.5.5 SAUDI ARABIA
                       14.5.5.1 Growing popularity of desert racing and sports events to drive market
                                   TABLE 251 SAUDI ARABIA: LIST OF MAJOR ATV MANUFACTURERS AND THEIR KEY INDICATIVE MODELS
                                   TABLE 252 SAUDI ARABIA: ALL-TERRAIN VEHICLE MARKET, BY TYPE, 2018–2022 (UNITS)
                                   TABLE 253 SAUDI ARABIA: ALL-TERRAIN VEHICLE MARKET, BY TYPE, 2023–2028 (UNITS)
                                   TABLE 254 SAUDI ARABIA: ALL-TERRAIN VEHICLE MARKET, BY TYPE, 2018–2022 (USD MILLION)
                                   TABLE 255 SAUDI ARABIA: ALL-TERRAIN VEHICLE MARKET, BY TYPE, 2023–2028 (USD MILLION)
 
15 RECOMMENDATIONS BY MARKETSANDMARKETS (Page No. - 207)
     15.1 ASIA OCEANIA TO BE ATTRACTIVE MARKET FOR ALL-TERRAIN VEHICLES 
     15.2 >800 CC ATVS AND SIDE-BY-SIDE VEHICLES TO CREATE NEW REVENUE POCKETS IN FUTURE 
     15.3 ELECTRIC ATVS TO OFFER ATTRACTIVE OPPORTUNITIES TO MANUFACTURERS 
     15.4 CONCLUSION 
 
16 COMPETITIVE LANDSCAPE (Page No. - 209)
     16.1 OVERVIEW 
     16.2 MARKET SHARE ANALYSIS, 2022 
               TABLE 256 MARKET SHARE ANALYSIS FOR ALL-TERRAIN VEHICLE MARKET, 2022
               FIGURE 39 ALL-TERRAIN VEHICLE MARKET SHARE ANALYSIS, 2022
     16.3 REVENUE ANALYSIS OF TOP LISTED/PUBLIC PLAYERS 
     16.4 COMPANY EVALUATION MATRIX: ALL-TERRAIN VEHICLE MANUFACTURERS 
             16.4.1 TERMINOLOGY
             16.4.2 STARS
             16.4.3 EMERGING LEADERS
             16.4.4 PERVASIVE PLAYERS
             16.4.5 PARTICIPANTS
                       TABLE 257 ALL-TERRAIN VEHICLE MARKET: COMPANY FOOTPRINT, 2022
                       TABLE 258 ALL-TERRAIN VEHICLE MARKET: COMPANY PRODUCT FOOTPRINT, 2022
                       TABLE 259 ALL-TERRAIN VEHICLE MARKET: COMPANY REGION FOOTPRINT, 2022
                       FIGURE 40 ALL-TERRAIN VEHICLE MANUFACTURERS: COMPANY EVALUATION MATRIX, 2022
     16.5 COMPETITIVE EVALUATION QUADRANT: SIDE-BY-SIDE VEHICLE MANUFACTURERS 
             16.5.1 STARS
             16.5.2 EMERGING LEADERS
             16.5.3 PERVASIVE PLAYERS
             16.5.4 PARTICIPANTS
                       FIGURE 41 SIDE-BY-SIDE (SXS) VEHICLE MANUFACTURERS: COMPANY EVALUATION MATRIX, 2022
     16.6 COMPETITIVE SCENARIO 
             16.6.1 PRODUCT LAUNCHES
                       TABLE 260 ALL-TERRAIN VEHICLE MARKET: PRODUCT LAUNCHES, 2021–2023
             16.6.2 DEALS
                       TABLE 261 ALL-TERRAIN VEHICLE MARKET: DEALS, 2021–2023
             16.6.3 OTHERS
                       TABLE 262 ALL-TERRAIN VEHICLE MARKET: OTHERS, 2021–2023
     16.7 STRATEGIES ADOPTED BY KEY PLAYERS/RIGHT TO WIN, 2018–2022 
               TABLE 263 KEY GROWTH STRATEGIES, 2018–2022
     16.8 COMPETITIVE BENCHMARKING 
             16.8.1 ALL-TERRAIN VEHICLE KEY PLAYERS AND THEIR PRODUCT RANGE
                       TABLE 264 ALL-TERRAIN VEHICLE MARKET: KEY PLAYERS
 
17 COMPANY PROFILES (Page No. - 233)
     17.1 KEY PLAYERS 
(Business overview, Products offered, Recent Developments, MNM view)*
             17.1.1 POLARIS INC.
                       TABLE 265 POLARIS INC.: BUSINESS OVERVIEW
                       FIGURE 42 POLARIS INC.: COMPANY SNAPSHOT
                       TABLE 266 POLARIS INC.: PRODUCT LAUNCHES
                       TABLE 267 POLARIS INC.: DEALS
                       TABLE 268 POLARIS INC.: OTHERS
             17.1.2 TEXTRON INC.
                       TABLE 269 TEXTRON INC.: BUSINESS OVERVIEW
                       FIGURE 43 TEXTRON INC.: COMPANY SNAPSHOT
                       TABLE 270 TEXTRON INC.: PRODUCT LAUNCHES
                       TABLE 271 TEXTRON INC.: DEALS
             17.1.3 HONDA MOTOR CO., LTD.
                       TABLE 272 HONDA MOTOR CO., LTD.: BUSINESS OVERVIEW
                       FIGURE 44 HONDA MOTOR CO., LTD.: COMPANY SNAPSHOT
                       TABLE 273 HONDA MOTOR CO., LTD.: PRODUCT LAUNCHES
                       TABLE 274 HONDA MOTOR CO., LTD.: DEALS
             17.1.4 KAWASAKI HEAVY INDUSTRIES LTD.
                       TABLE 275 KAWASAKI HEAVY INDUSTRIES LTD.: BUSINESS OVERVIEW
                       FIGURE 45 KAWASAKI HEAVY INDUSTRIES LTD.: COMPANY SNAPSHOT
                       TABLE 276 KAWASAKI HEAVY INDUSTRIES LTD.: PRODUCT LAUNCHES
                       TABLE 277 KAWASAKI HEAVY INDUSTRIES LTD.: OTHERS
             17.1.5 YAMAHA MOTOR CORPORATION
                       TABLE 278 YAMAHA MOTOR CORPORATION: BUSINESS OVERVIEW
                       FIGURE 46 YAMAHA MOTOR CORPORATION: COMPANY SNAPSHOT
                       TABLE 279 YAMAHA MOTOR CORPORATION: PRODUCT LAUNCHES
                       TABLE 280 YAMAHA MOTOR CORPORATION: OTHERS
             17.1.6 SUZUKI MOTOR CORPORATION
                       TABLE 281 SUZUKI MOTOR CORPORATION: BUSINESS OVERVIEW
                       FIGURE 47 SUZUKI MOTOR CORPORATION: COMPANY SNAPSHOT
                       TABLE 282 SUZUKI MOTOR CORPORATION: PRODUCT LAUNCHES
                       TABLE 283 SUZUKI MOTOR CORPORATION: DEALS
             17.1.7 JOHN DEERE
                       TABLE 284 JOHN DEERE: BUSINESS OVERVIEW
                       FIGURE 48 JOHN DEERE: COMPANY SNAPSHOT
                       TABLE 285 JOHN DEERE: PRODUCT LAUNCHES
             17.1.8 BRP
                       TABLE 286 BRP: BUSINESS OVERVIEW
                       FIGURE 49 BRP: COMPANY SNAPSHOT
                       TABLE 287 BRP: PRODUCT LAUNCHES
                       TABLE 288 BRP: DEALS
                       TABLE 289 BRP: OTHERS
             17.1.9 CFMOTO
                       TABLE 290 CFMOTO: BUSINESS OVERVIEW
                       FIGURE 50 CFMOTO: COMPANY SNAPSHOT
                       TABLE 291 CFMOTO: PRODUCT LAUNCHES
             17.1.10 HISUN MOTORS CORPORATION
                       TABLE 292 HISUN MOTORS CORPORATION: BUSINESS OVERVIEW
                       TABLE 293 HISUN MOTORS CORPORATION: DEALS
                       TABLE 294 HISUN MOTORS CORPORATION: OTHERS
*Details on Business overview, Products offered, Recent Developments, MNM view might not be captured in case of unlisted companies.
     17.2 OTHER PLAYERS 
             17.2.1 BENNCHE, LLC
                       TABLE 295 BENNCHE, LLC: COMPANY OVERVIEW
             17.2.2 VELOMOTORS
                       TABLE 296 VELOMOTORS: COMPANY OVERVIEW
             17.2.3 ECO CHARGER
                       TABLE 297 ECO CHARGER: COMPANY OVERVIEW
             17.2.4 BALTMOTORS
                       TABLE 298 BALTMOTORS: COMPANY OVERVIEW
             17.2.5 CECTEK
                       TABLE 299 CECTEK: COMPANY OVERVIEW
             17.2.6 NEBULA AUTOMOTIVE PRIVATE LIMITED
                       TABLE 300 NEBULA AUTOMOTIVE PRIVATE LIMITED: COMPANY OVERVIEW
             17.2.7 TAIWAN GOLDEN BEE (TGB)
                       TABLE 301 TAIWAN GOLDEN BEE (TGB): COMPANY OVERVIEW
             17.2.8 KYMCO
                       TABLE 302 KYMCO: COMPANY OVERVIEW
             17.2.9 LINHAI
                       TABLE 303 LINHAI: COMPANY OVERVIEW
             17.2.10 AMERICAN LANDMASTER
                       TABLE 304 AMERICAN LANDMASTER: BUSINESS OVERVIEW
 
18 APPENDIX (Page No. - 286)
     18.1 INSIGHTS FROM INDUSTRY EXPERTS 
     18.2 DISCUSSION GUIDE 
     18.3 KNOWLEDGESTORE: MARKETSANDMARKETS’ SUBSCRIPTION PORTAL 
     18.4 CUSTOMIZATION OPTIONS 
             18.4.1 SIDE-BY-SIDE VEHICLE MARKET, BY APPLICATION
                       18.4.1.1 Sports
                       18.4.1.2 Entertainment
                       18.4.1.3 Agriculture
                       18.4.1.4 Military & Defense
                       18.4.1.5 Others (Hunting & Forestry)
             18.4.2 SIDE-BY-SIDE VEHICLE MARKET, BY FUEL TYPE
                       18.4.2.1 Gasoline
                       18.4.2.2 Diesel
                       18.4.2.3 Electric
     18.5 RELATED REPORTS 
     18.6 AUTHOR DETAILS 

The study involved four major activities in estimating the current size of the all-terrain vehicle market. Exhaustive secondary research was carried out to collect information on the market, the peer market, and the parent market. The next step was to validate these findings, assumptions, and sizing with the industry experts across value chains through primary research. The bottom-up and top-down approaches were employed to estimate the complete market size. Thereafter, market breakdown and data triangulation processes were used to estimate the market size of segments and subsegments.

Secondary Research

The all-terrain vehicle market is directly dependent on vehicle production. ATV sales/registrations volume was derived through secondary sources such as automotive industry organizations; corporate filings (such as annual reports, investor presentations, and financial statements); and trade, paid repository, and automotive associations such as Motorcycle Industry Council, Abraciclo, Agricultural Engineers Association (AEA), Canadian Off-Highway Vehicle Distributors Council, etc. Historical sales/registration data was collected and analyzed, and the industry trend was considered to arrive at the forecast, which was further validated by primary research.

Primary Research

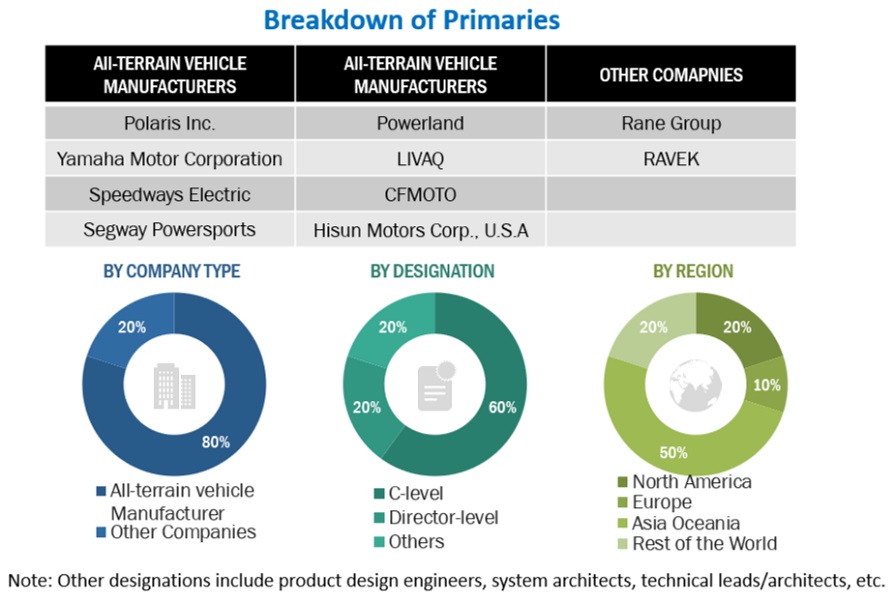
In the primary research process, various primary sources from both the supply and demand sides were interviewed to obtain qualitative and quantitative information on the market. The primary sources from the supply side included various industry experts, such as CXOs, vice presidents, directors from business development, marketing, and product development/innovation teams, and related key executives from various key companies. Various system integrators, industry associations, independent consultants/industry veterans, and key opinion leaders were also interviewed.

Primary interviews were conducted to gather insights such as all-terrain vehicle sales/registrations and forecasts, future technology trends, and upcoming technologies in the all-terrain vehicle industry. Data triangulation of all these points was carried out with the information gathered from secondary research as well as model mapping. Stakeholders from the demand as well as supply sides were interviewed to understand their views on the points mentioned above.

Primary interviews were conducted with market experts from both the demand (all-terrain vehicle solution and service providers) and supply sides across four major regions, namely, North America, Europe, Asia Pacific, and the Rest of the World. Approximately 90% and 10% of primary interviews were conducted from the supply side and others, respectively. Primary data was collected through questionnaires, emails, and telephonic interviews. In the canvassing of primaries, we have strived to cover various departments within organizations, such as sales and operations, to provide a holistic viewpoint in our report.

After interacting with industry experts, we have also conducted brief sessions with highly experienced independent consultants to reinforce the findings from our primaries. This, along with the in-house subject matter experts’ opinions, has led us to the findings as described in the remainder of this report.
All-terrain Vehicle Market  Size, and Share

To know about the assumptions considered for the study, download the pdf brochure

Market Size Estimation

A detailed market estimation approach was followed to estimate and validate the value of the all-terrain vehicle market and other dependent submarkets, as mentioned below:

  • Key players in the all-terrain vehicle market for automotive were identified through secondary research, and their global market shares were determined through primary and secondary research.
  • The research methodology included a study of annual and quarterly financial reports and regulatory filings of major market players (public) as well as interviews with industry experts for detailed market insights.
  • All industry-level penetration rates, percentage shares, splits, and breakdowns for the all-terrain vehicle market for automotive were determined using secondary sources and verified through primary sources.
  • All key macro indicators affecting the revenue growth of the market segments and subsegments were accounted for, viewed in extensive detail, verified through primary research, and analyzed to get the validated and verified quantitative and qualitative data.
  • The gathered market data was consolidated and added with detailed inputs, analyzed, and presented in this report.
  • Qualitative aspects such as market drivers, restraints, opportunities, and challenges were taken into consideration while calculating and forecasting the market size.

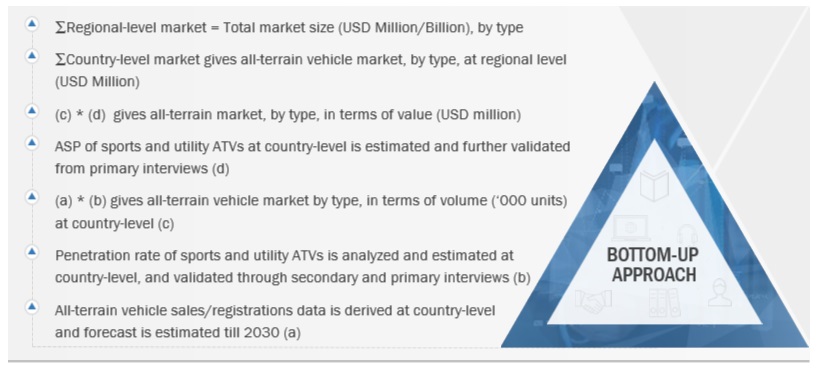
Bottom-up Approach: All-Terrain Vehicle Market, by Type and Region

All-terrain Vehicle Market  Size, and Share

To know about the assumptions considered for the study, Request for Free Sample Report

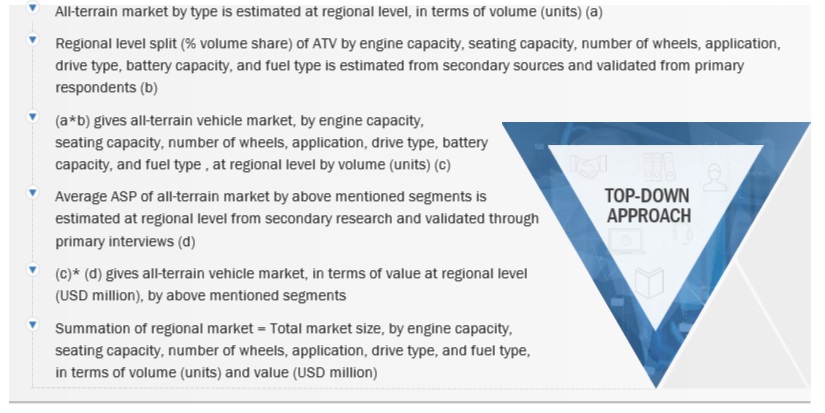
Top-Down Approach: by Seating Capacity, Number Of Wheels, Drive Type, Engine Capacity, Application, Fuel Type

All-terrain Vehicle Market  Size, and Share

Data Triangulation

  • After arriving at the overall market size—using the market size estimation processes as explained above—the market was split into several segments and subsegments. To complete the overall market engineering process and arrive at the exact statistics of each market segment and subsegment, data triangulation and market breakdown procedures were employed, wherever applicable. The data was triangulated by studying various factors and trends from both the demand and supply sides.

Market Definition:

According to Polaris Inc., an all-terrain vehicle, or ATV, is a four-wheeled off-road vehicle with straddle/motorcycle-style seating and handlebar steering. While two-person models are out there, a typical ATV accommodates a single rider. Also known as quads or four-wheelers, ATVs are generally smaller than UTVs, more physically intensive to operate than UTVs, and are generally easier to transport long-distance than UTVs as they can fit in the beds of most full-size pickups and many standard utility trailers.

Key Stakeholders:

  • Sales Head
  • Marketing Head
  • Design Manager
  • R&D Head

Report Objectives

  • To define, segment, analyze, and forecast (2023–2028) the all-terrain vehicle market size, in terms of volume (units) and value (USD million) based on:
    • Type (utility ATV and sport ATV)
    • Application (sport, entertainment, agriculture, military & defense, and others)
    • Seating Capacity (one seat and ≥2-seats)
    • Number of Wheels (four-wheel and >four wheels)
    • Drive Type (2WD, 4WD, and AWD)
    • Engine Capacity (<400cc, 400–800cc, and >800cc)
    • Fuel Type (Gasoline and Electric)
    • Region (North America, Europe, Asia Pacific, and the Rest of the World (RoW))
    • Side-by-Side (North America, Europe, Asia Pacific)
  • To analyze the recession impact on the all-terrain vehicle market
  • To understand the market dynamics (drivers, restraints, opportunities, and challenges) of the all-terrain vehicle market
  • To study the following with respect to the market
    • Supply Chain Analysis
    • Market Ecosystem
    • Technology Analysis
    • Trade Analysis
    • Case Study Analysis
    • Patent Analysis
    • Buying Criteria
    • Regulatory Landscape
  • To estimate the following with respect to the market
    • Average Selling Price Analysis
    • Market Share Analysis
  • To analyze the competitive landscape and prepare a competitive evaluation quadrant for the global players operating in the all-terrain vehicle market
  • To analyze recent developments, alliances, joint ventures, mergers & acquisitions, new product launches, and other activities carried out by key industry participants in the all-terrain vehicle market

Available Customizations

With the given market data, MarketsandMarkets offers customizations in accordance with a company’s specific needs.

Side-By-Side Vehicle Market, by Application

  • Sports
  • Entertainment
  • Agriculture
  • Military & Defense
  • Others (Hunting & Forestry)

Side-by-Side Vehicle Market, by Fuel Type

  • Gasoline
  • Diesel
  • Electric

Note: The countries would be covered: Asia Pacific (China, Australia, New Zealand, India, and Japan), Europe (Germany, France, UK, Spain, Sweden, Russia, and the Rest of Europe), North America (US, Canada, and Mexico), and the Rest of World (South Africa, UAE, Saudi Arabia, and Brazil) 

Custom Market Research Services

We will customize the research for you, in case the report listed above does not meet with your exact requirements. Our custom research will comprehensively cover the business information you require to help you arrive at strategic and profitable business decisions.

Request Customization

Instant Answers with GPT - Ask Now!

Ask real questions. Get complete answers !
Report Code
AT 7165
Published ON
Jul, 2023
Choose License Type
BUY NOW
  • SHARE
X
Request Customization
Speak to Analyst
Speak to Analyst
OR FACE-TO-FACE MEETING
PERSONALIZE THIS RESEARCH
  • Triangulate with your Own Data
  • Get Data as per your Format and Definition
  • Gain a Deeper Dive on a Specific Application, Geography, Customer or Competitor
  • Any level of Personalization
REQUEST A FREE CUSTOMIZATION
LET US HELP YOU!
  • What are the Known and Unknown Adjacencies Impacting the All-terrain Vehicle Market
  • What will your New Revenue Sources be?
  • Who will be your Top Customer; what will make them switch?
  • Defend your Market Share or Win Competitors
  • Get a Scorecard for Target Partners
CUSTOMIZED WORKSHOP REQUEST
+1-888-600-6441
  • Call Us
  • +1-888-600-6441 (Corporate office hours)
  • +1-888-600-6441 (US/Can toll free)
  • +44-800-368-9399 (UK office hours)
CONNECT WITH US
ABOUT TRUST ONLINE
©2024 MarketsandMarkets Research Private Ltd. All rights reserved
DMCA.com Protection Status Website Feedback