Nucleic Acid Labeling Market by Product (Reagents & Kits, Services), Applications, Labeling Techniques (PCR, Nick Translation, Random Primer, In Vitro Transcription, Reverse Transcription, End Labeling), by Region - Global Forecast to 2020


The global nucleic acid labeling market is expected to USD 1,925.7 Million by 2020 from USD 1271.8 Million in 2015, at a CAGR of 8.65% between 2015 and 2020. Nucleic acid can be labeled using several different methods including incorporation of fluorescent tags, biotin, and enzymes. The labeled nucleic acid can be used for a variety of applications, including DNA sequencing, PCR, FISH, microarrays, blotting, and in situ hybridization. This market report studies the potential of reagents & kits and services for various applications by using PCR, nick translation, random primer labeling techniques.
The major drivers for the market include the increasing healthcare expenditure impacting personalized health technologies; increase in genomics research; rise in disease diagnosis; and increase in R&D spending. On the other hand high competition and lack of skilled professionals in transcriptomics field are the major factors restraining the growth of this market.
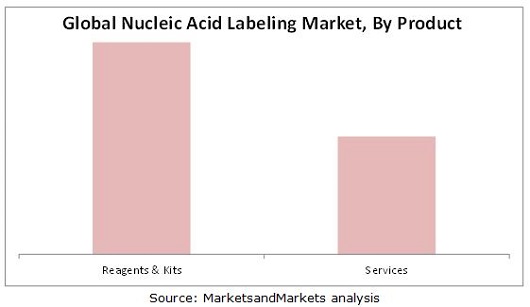
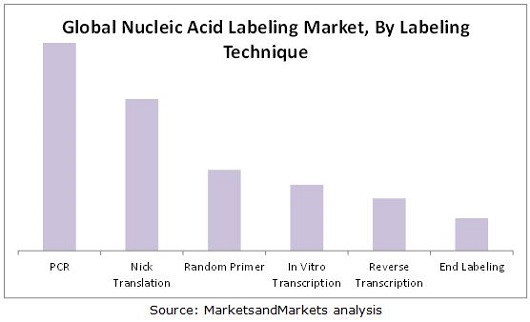
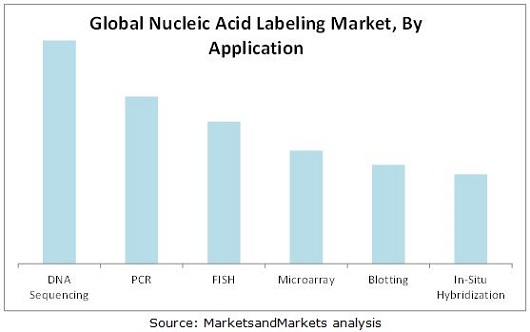
This report segments the global nucleic acid labeling market by product, labeling technique, application, and geography. By product, the market includes reagents & kits and services. The reagents & kits segment is further divided into labels and probes. The labeling technique segment includes PCR, nick translation, random primer, in vitro transcription, reverse transcription, and end labeling. The application segments included in this report are DNA sequencing, PCR, FISH, microarray, blotting, in situ hybridization and other applications.
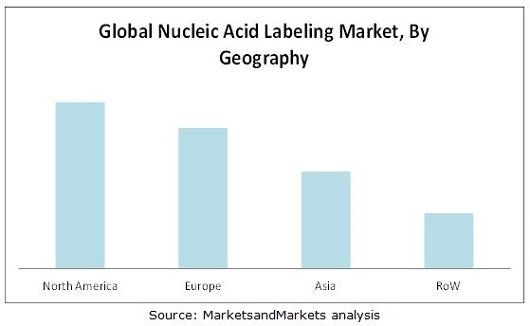
Geographic analysis reveals that North America accounted for the largest share of the global nucleic acid labeling market in 2015. Growth in this market can be attributed to the increase in growth of genomics research and increasing R & D spending. The Asian regional segment, on the other hand, is expected to register a double-digit growth from 2015 to 2020, owning to the increased R&D spending. R&D spending in Asia increased from USD 177 Billion in 2003 to USD 329 Billion in 2010, at a CAGR of 9.29%. The R&D spending in Asia accounted for 27.13% of global R&D expenditure in 2010.
The major players in this market include Thermo Fisher Scientific, Inc. (U.S.), New England Biolabs (U.S.), PerkinElmer, Inc. (U.S.), F. Hoffmann La-Roche AG (Switzerland), General Electric Company (U.S.), Merck KGaA (Germany), Enzo Biochem (U.S.), Promega Corporation (U.S.), Vector Laboratories (U.S.), and Agilent Technologies (U.S.).
Scope of the Report : Nucleic Acid Labeling Market
This research report categorizes the global market into the following segments and subsegments:
Global Nucleic Acid Labeling Market, by Product
- Products
- Labels
- Radioactive
- Non-Radioactive
- Chemiluminescent
- Fluorescent
- DIG System
- Enzymes
- Biotin
- Antibodies
- Probes
- Non-Radioactive
- Radioactive
- Services
Global Nucleic Acid Labeling Market, by Labeling Technique
- PCR
- Nick Translation
- Random Primer
- In Vitro Transcription
- Reverse Transcription
- End Labeling
Global Nucleic Acid Labeling Market, by Application
- DNA Sequencing
- PCR
- FISH
- Microarray
- In Situ Hybridization
- Blotting
- Other Application
Global Nucleic Acid Labeling Market, by Geography
- North America
- Europe
- Asia
- Rest of the World
The global nucleic acid labeling market is expected to USD 1,925.7 Million by 2020 from USD 1271.8 Million in 2015, at a CAGR of 8.65% between 2015 and 2020. The major drivers for the market include the increasing healthcare expenditure impacting personalized health technologies, increase in genomics research, rise in disease diagnosis, and increase in R&D spending are driving the growth of the global market. The emerging economics will provide new growth opportunities for this market.
The report provides a granular understanding of the nucleic acid labeling market. This report segments the global market on the basis of products, labeling techniques, applications, and geographies. The product segments included in this report are reagents & kits and services.
The labeling techniques segment includes PCR, nick translation, random primer, in vitro transcription, reverse transcription, and end labeling. The application segments included in this report are DNA sequencing, PCR, FISH, microarray, in situ hybridization, blotting, and other applications.
The geographic segments included in this report are North America, Europe, Asia, and the Rest of the World (RoW). The report maps each test type and product segment in 11 geographic and regional segments.
The major players in the Nucleic Acid Labeling Market include Thermo Fisher Scientific, Inc. (U.S.), New England Biolabs (U.S.), PerkinElmer, Inc. (U.S.), F. Hoffmann La-Roche AG (Switzerland), General Electric Company (U.S.), Merck KGaA (Germany), Enzo Biochem (U.S.), Promega Corporation (U.S.), Vector Laboratories (U.S.), and Agilent Technologies (U.S.).
Global nucleic acid labeling market snapshot, 2015 (USD Million)
 Exclusive indicates content/data unique to MarketsandMarkets and not available with any competitors.
Table of Contents
1 Introduction (Page No. - 15)
1.1 Objectives of the Study
1.2 Market Definition
1.3 Market Scope
1.3.1 Markets Covered
1.3.2 Years Considered in the Report
1.4 Currency
1.5 Limitations
1.6 Stakeholders
2 Research Methodology (Page No. - 18)
2.1 Market Size Estimation
2.2 Market Breakdown and Data Triangulation
2.3 Market Share Estimation
2.3.1 Key Data From Secondary Sources
2.3.2 Key Data From Primary Sources
2.3.3 Assumptions for the Study
3 Executive Summary (Page No. - 25)
4 Premium Insights (Page No. - 30)
4.1 Global Market Overview
5 Market Overview (Page No. - 33)
5.1 Introduction
5.2 Market Segmentation
5.2.1 By Product
5.2.2 By Labeling Techniques
5.2.3 By Application
5.3 Market Dynamics
5.3.1 Drivers
5.3.1.1 Increasing Healthcare Expenditure
5.3.1.2 Low Cost of Genome Sequencing Leads to Increased Genomics Research
5.3.1.3 Applications in Disease Diagnosis
5.3.1.4 Increase in R&D Spending
5.3.2 Restraints
5.3.2.1 Lack of Skilled Professionals in Transcriptomics
5.3.3 Opportunities
5.3.3.1 Rising Opportunities in Emerging Markets
5.3.4 Trends
5.3.4.1 Utilization of Low-To-Medium-Throughput Technologies
6 Nucleic Acid Labeling Market, By Products (Page No. - 42)
6.1 Introduction
6.2 Reagents & Kits
6.2.1 Labels
6.2.1.1 Radioactive Labels
6.2.1.2 Non-Radioactive Labels
6.2.2 Probes
6.2.2.1 Radioactive Probes
6.2.2.2 Non-Radioactive
6.3 Services
7 Nucleic Acid Labeling Market, By Labeling Technique (Page No. - 55)
7.1 Introduction
7.2 PCR
7.3 Nick Translation
7.4 Random Primer
7.5 In Vitro Transcription
7.6 Reverse Transcription
7.7 End Labeling
8 Nucleic Acid Labeling Market, By Application (Page No. - 69)
8.1 Introduction
8.2 DNA Sequencing
8.3 Polymerase Chain Reaction
8.4 Fluorescence in Situ Hybridization (FISH)
8.5 Microarrays
8.6 Blotting
8.7 in Situ Hybridization
8.8 Other Applications
9 Nucleic Acid Labeling Market, By Region (Page No. - 84)
9.1 Introduction
9.2 North America
9.2.1 U.S.
9.2.2 Canada
9.3 Europe
9.4 Asia
9.5 Rest of the World (RoW)
10 Competitive Landscape (Page No. - 117)
10.1 Introduction
10.2 Strategic Overview
10.3 Market Share Analysis
10.4 Competitive Situation and Trends
10.4.1 New Product Launches & Product Upgrades
10.4.2 Acquisitions
10.4.3 Agreements
10.4.4 Expansions
10.4.5 Patents
11 Company Profiles (Page No. - 123)
11.1 Introduction
11.2 Agilent Technologies, Inc.
11.2.1 Business Overview
11.2.2 Products Offered
11.2.3 Recent Developments
11.2.4 MnM View
11.2.4.1 Financial Analysis
11.2.4.2 Strategic Analysis
11.3 Enzo Biochem, Inc.
11.3.1 Business Overview
11.3.2 Products Offered
11.3.3 Recent Development
11.3.4 MnM View
11.3.4.1 Financial Analysis
11.3.4.2 Strategic Analysis
11.4 F. Hoffman-La Roche AG
11.4.1 Business Overview
11.4.2 Products Offered
11.4.3 Recent Development
11.4.4 MnM View
11.4.4.1 Financial Analysis
11.4.4.2 Strategic Analysis
11.5 General Electric Company
11.5.1 Business Overview
11.5.2 Products Offered
11.5.3 Recent Developments
11.5.4 MnM View
11.5.4.1 Financial Analysis
11.5.4.2 Strategic Analysis
11.6 Merck KGaA (Germany)
11.6.1 Business Overview
11.6.2 Products Offered
11.6.3 Recent Developments
11.6.4 MnM View
11.6.4.1 Financial Analysis
11.6.4.2 Strategic Analysis
11.7 New England Biolabs
11.7.1 Business Overview
11.7.2 Products Offered
11.7.3 Recent Developments
11.7.4 MnM View
11.7.4.1 Strategic Analysis
11.8 Perkinelmer, Inc.
11.8.1 Business Overview
11.8.2 Products & Services Offered
11.8.3 Recent Development
11.8.4 MnM View
11.8.4.1 Financial Analysis
11.8.4.2 Strategic Analysis
11.9 Promega Corporation
11.9.1 Business Overview
11.9.2 Products Offered
11.9.3 Recent Developments
11.9.4 MnM View
11.9.4.1 Strategic Analysis
11.10 Thermo Fisher Scientific, Inc.
11.10.1 Business Overview
11.10.2 Products & Services Offered
11.10.3 Recent Developments
11.10.4 MnM View
11.10.4.1 Financial Analysis
11.10.4.2 Strategic Analysis
11.11 Vector Laboratories
11.11.1 Business Overview
11.11.2 Products Offered
11.11.3 Recent Developments
11.11.4 MnM View
11.11.4.1 Strategic Analysis
12 Appendix (Page No. - 153)
12.1 Insights of Industry Experts
12.2 Discussion Guide
12.3 Introducing RT: Real-Time Market Intelligence
12.4 Available Customizations
12.5 Related Reports
List of Tables (77 Tables)
Table 1 Market Summary
Table 2 Increasing Healthcare Expenditure and Genomics Research Propelling the Growth of the Market
Table 3 High Consolidation, Competition in Market Restraining Its Growth
Table 4 Emerging Economies Present Significant Growth Opportunities
Table 5 Utilization of Low-To-Medium-Throughput Technologies is an Important Trend
Table 6 Market Size, By Product, 2013�2020 (USD Million)
Table 7 Market Size for Reagents & Kits, By Type, 2013�2020 (USD Million)
Table 8 Market Size for Reagents & Kits, By Region, 2013�2020 (USD Million)
Table 9 North America: Market Size for Reagents & Kits, By Region, 2013�2020 (USD Million)
Table 10 Market Size for Labels, By Region, 2013�2020 (USD Million)
Table 11 North America: Market Size for Labels, By Region, 2013-2020 (USD Million)
Table 12 Market Size for Non-Radioactive Labels, By Type, 2013�2020 (USD Million)
Table 13 Market Size for Probes, By Region, 2013�2020 (USD Million)
Table 14 North America: Market Size for Probes, By Region, 2013�2020 (USD Million)
Table 15 Market Size for Services, By Region, 2013�2020 (USD Million)
Table 16 North America: Market Size for Services, By Region, 2013�2020 (USD Million)
Table 17 Market Size, By Labeling Technique, 2013�2020 (USD Million)
Table 18 Market Size for PCR, By Region, 2013�2020 (USD Million)
Table 19 North America: Market Size for PCR, By Country, 2013�2020 (USD Million)
Table 20 Market Size for Nick Translation, By Region, 2013�2020 (USD Million)
Table 21 North America: Market Size for Nick Translation, By Country, 2013�2020 (USD Million)
Table 22 Market Size for Random Primer Labeling, By Region, 2013�2020 (USD Million)
Table 23 North America: Nucleic Acid Labeling Market Size for Random Primer Labeling, By Country, 2013�2020 (USD Million)
Table 24 Market Size for in Vitro Transcription, By Region, 2013�2020 (USD Million)
Table 25 North America: Market Size for in Vitro Transcription, By Country, 2013�2020 (USD Million)
Table 26 Market Size for Reverse Transcription, By Region, 2013�2020 (USD Million)
Table 27 North America: Market Size for Reverse Transcription, By Country, 2013�2020 (USD Million)
Table 28 Market Size for End Labeling, By Region, 2013�2020 (USD Million)
Table 29 North America: Market Size for End Labeling, By Country, 2013�2020 (USD Million)
Table 30 Market Size, By Application, 2013�2020 (USD Million)
Table 31 Market Size for DNA Sequencing, By Region, 2013�2020 (USD Million)
Table 32 North America: Market Size for DNA Sequencing, By Region, 2013�2020 (USD Million)
Table 33 Market Size for PCR, By Region, 2013�2020 (USD Million)
Table 34 North America: Market Size for PCR, By Region, 2013�2020 (USD Million)
Table 35 Market Size for FISH, By Region, 2013�2020 (USD Million)
Table 36 North America: Market Size for FISH, By Region, 2013�2020 (USD Million)
Table 37 Market Size for Microarrays, By Region, 2013�2020 (USD Million)
Table 38 North America: Market for Microarrays, By Region, 2013�2020 (USD Million)
Table 39 Market Size for Blotting, By Region, 2013�2020 (USD Million)
Table 40 North America: Market Size for Blotting, By Region, 2013�2020 (USD Million)
Table 41 Market Size for in Situ Hybridization, By Region, 2013�2020 (USD Million)
Table 42 North America: Market Size for in Situ Hybridization, By Region, 2013�2020 (USD Million)
Table 43 Market Size for Other Applications, By Region, 2013�2020 (USD Million)
Table 44 North America: Market Size for Other Applications, By Region, 2013�2020 (USD Million)
Table 45 Market Size, By Region, 2013�2020 (USD Million)
Table 46 North America: Market Size, By Region, 2013�2020 (USD Million)
Table 47 North America: Market Size, By Product, 2013�2020 (USD Million)
Table 48 North America: Market Size, By Reagents and Kits, 2013�2020 (USD Million)
Table 49 North America: Market Size, By Labeling Technique, 2013�2020 (USD Million)
Table 50 North America: Market Size, By Application, 2013�2020 (USD Million)
Table 51 U.S.: Market Size, By Product, 2013�2020 (USD Million)
Table 52 U.S.: Market Size, By Reagents and Kits, 2013�2020 (USD Million)
Table 53 U.S.: Market Size, By Labeling Technique, 2013�2020 (USD Million)
Table 54 U.S.: Market Size, By Application, 2013�2020 (USD Million)
Table 55 Canada: Market Size, By Product, 2013�2020 (USD Million)
Table 56 Canada: Market Size, By Reagents and Kits, 2013�2020 (USD Million)
Table 57 Canada: Market Size, By Labeling Technique, 2013�2020 (USD Million)
Table 58 Canada: Market Size, By Application, 2013�2020 (USD Million)
Table 59 Europe: Market Size, By Product, 2013�2020 (USD Million)
Table 60 Europe: Market Size, By Reagents and Kits, 2013�2020 (USD Million)
Table 61 Europe: Market Size, By Labeling Technique, 2013�2020 (USD Million)
Table 62 Europe: Market Size, By Application, 2013�2020 (USD Million)
Table 63 Asia: Market Size, By Product, 2013�2020 (USD Million)
Table 64 Asia: Market Size, By Reagents and Kits, 2013�2020 (USD Million)
Table 65 Asia: Market Size, By Labeling Technique, 2013�2020 (USD Million)
Table 66 Asia: Market Size, By Application, 2013�2020 (USD Million)
Table 67 RoW: Market Size, By Product, 2013�2020 (USD Million)
Table 68 RoW: Market Size, By Reagents and Kits, 2013�2020 (USD Million)
Table 69 RoW: Market Size, By Labeling Technique, 2013�2020 (USD Million)
Table 70 RoW: Market Size, By Application, 2013�2020 (USD Million)
Table 71 Market Share Analysis, By Key Player, 2015
Table 72 Market Developments Between January 2013 and August 2015
Table 73 New Product Launches & Product Upgrades , 2013�2015
Table 74 Acquisitions, 2013�2015
Table 75 Agreements , 2013�2015
Table 76 Expansions, 2013�2015
Table 77 Patents, 2013�2015
List of Figures (89 Figures)
Figure 1 Nucleic Acid Labeling Market
Figure 2 Research Design
Figure 3 Market Size Estimation Methodology: Bottom-Up Approach
Figure 4 Market Size Estimation Methodology: Top-Down Approach
Figure 5 Breakdown of Primary Interviews: By Company Type, Designation, and Region
Figure 6 Data Triangulation Methodology
Figure 7 Market Size, By Product, 2015 vs 2020 (USD Million)
Figure 8 Market Size, By Labeling Technique, 2015 vs 2020 (USD Million)
Figure 9 Market Size, By Application, 2015 vs 2020 (USD Million)
Figure 10 Geographical Snapshot of the Nucleic Acid Labeling Market in 2015
Figure 11 Market Size, By Region, 2015 vs 2020 (USD Million)
Figure 12 Increasing Healthecare Expenditure to Drive Market Growth
Figure 13 Geographic Analysis: Nucleic Acid Labeling Market, By Application, 2015
Figure 14 Asia to Witness Highest Growth Rate in the Forecast Period (2015 to 2020)
Figure 15 Market: By Product
Figure 16 Market: By Labeling Techniques
Figure 17 Market: By Application
Figure 18 Increasing Healthcare Expenditure Will Drive the Nucleic Acid Labeling Market
Figure 19 Increasing Healthcare Expenditure is the Most Important Driver for Nucleic Acid Labeling Market
Figure 20 Increasing R&D Spending Boosting the Growth of the Nucleic Acid Labeling Market
Figure 21 Nucleic Acid Labeling Market, By Product
Figure 22 Reagents & Kits Segment to Command the Largest Share of the Nucleic Acid Labeling Market in 2015
Figure 23 Labels to Command the Largest Share of the Nucleic Acid Labeling Reagents & Kits Market in 2015
Figure 24 North America Will Be the Largest Regional Segment of the Reagents & Kits Market in 2015
Figure 25 Asia to Be the Fastest-Growing Regional Segment of the Labels Market Between 2015 and 2020
Figure 26 Chemiluminescent Chemicals to Command the Largest Share of the Nucleic Acid Labeling Market for Non-Radioactive Labels in 2015
Figure 27 Asia to Be the Fastest-Growing Regional Segment of the Nucleic Acid Labeling Probes Market in the Forecast Period
Figure 28 North America Will Be the Largest Regional Segment of the Services Market in 2015
Figure 29 Nucleic Acid Labeling Market Segmentation, By Labeling Technique
Figure 30 PCR Segment to Dominate the Nucleic Acid Labeling Market in 2015
Figure 31 Asia to Witness Highest Growth in the Nucleic Acid Labeling Market for PCR
Figure 32 Asia is Expected to Be the Fastest-Growing Regional Segment for Nick Translation
Figure 33 North America to Dominate the Random Primer Market in 2015
Figure 34 In Vitro Transcription Market in Asia to Witness Highest Growth in the Forecast Period
Figure 35 Asia Will Be the Fastest-Growing Regional Segment for Reverse Transcription Between 2015 and 2020
Figure 36 End Labeling Segment to Witness Highest Growth in North America
Figure 37 Nucleic Acid Labeling Market, By Application
Figure 38 DNA Sequencing Segment Expected to Command the Largest Share of the Nucleic Acid Labeling Market in 2015
Figure 39 North America to Command the Largest Share of the DNA Sequencing Application Segment in 2015
Figure 40 North America to Dominate the Nucleic Acid Labeling Market for PCR in 2015
Figure 41 Asia to Grow at the Highest CAGR in the Forecast Period
Figure 42 North America to Dominate the Nucleic Acid Labeling Market for Microarrays in 2015
Figure 43 Asia to Be the Fastest-Growing Regional Segment in the Blotting Applications Market in 2015
Figure 44 Asia to Be the Fastest-Growing Regional Segment in the in Situ Hybridization Market in 2015
Figure 45 North America is Expected to Be the Largest Regional Market for Other Applications in 2015
Figure 46 Asia to Grow at the Highest Rate During the Forecast Period
Figure 47 Geographic Snapshot (2015)
Figure 48 North America: Macroindicators
Figure 49 North America: Market Snapshot
Figure 50 North American Geographic Snapshot (2015)
Figure 51 Reagents & Kits Expected to Hold the Largest Share of the North American Market, By Product, in 2015
Figure 52 Labels to Account for the Largest Share of the Nucleic Acid Labeling Reagents & Kits in Asia
Figure 53 PCR, the Dominant Labeling Technique Segment in 2015
Figure 54 DNA Sequencing to Be the Largest Application Segment of the North American Nucleic Acid Labeling Market in 2015
Figure 55 U.S.: Macroindicators
Figure 56 Reagents & Kits Expected to Hold Largest Share of U.S. Market, By Product, in 2015
Figure 57 Labels Estimated to Be the Largest Reagents & Kits Segment in the U.S. Nucleic Acid Labeling Market in 2015
Figure 58 PCR, the Dominant Labeling Technique Segment in 2015
Figure 59 DNA Sequencing to Be the Largest Application Segment of the U.S. Nucleic Acid Labeling Market in 2015
Figure 60 Canada: Macroindicators
Figure 61 Reagents & Kits Expected to Hold Largest Share of the Canadian Market, By Product, in 2015
Figure 62 Labels Estimated to Be the Largest Reagents & Kits Segment in the Canada Nucleic Acid Labeling Market in 2015
Figure 63 PCR, the Dominant Labeling Technique Segment in 2015
Figure 64 DNA Sequencing to Be the Largest Application Segment of the Canadian Nucleic Acid Labeling Market in 2015
Figure 65 Europe: Macroindicators
Figure 66 Reagents & Kits Expected to Hold Largest Share of the European Market, By Product, in 2015
Figure 67 Labels Estimated to Be the Largest Reagents & Kits Segment in the European Nucleic Acid Labeling Market in 2015
Figure 68 PCR, the Dominant Labeling Technique Segment in 2015
Figure 69 DNA Sequencing to Be the Largest Application Segment of the Europe Nucleic Acid Labeling Market in 2015
Figure 70 Asia: Macroindicators
Figure 71 Asia: Market Snapshot
Figure 72 Reagents & Kits Expected to Hold the Largest Share of the Asian Market, By Product, in 2015
Figure 73 Labels Estimated to Be the Largest Reagents & Kits Segment in the Asian Nucleic Acid Labeling Market in 2015
Figure 74 PCR, the Dominant Labeling Technique Segment in 2015
Figure 75 DNA Sequencing to Be the Largest Application Segment of the Asian Nucleic Acid Labeling Market in 2015
Figure 76 RoW: Macroindicators
Figure 77 Reagents & Kits Expected to Hold Largest Share of RoW Market, By Product, in 2015
Figure 78 Labels Estimated to Be the Largest Reagents & Kits Segment in the RoW Nucleic Acid Labeling Market in 2015
Figure 79 PCR, the Dominant Labeling Technique Segment in 2015
Figure 80 DNA Sequencing to Be the Largest Application Segment of the RoW Nucleic Acid Labeling Market in 2015
Figure 81 New Product Launch are the Key Strategy Adopted By Players in the Nucleic Acid Labeling Market, 2013�2015
Figure 82 Financial Performances of the Leading Market Players
Figure 83 Company Snapshot: Agilent Technologies, Inc.
Figure 84 Company Snapshot: Enzo Biochem, Inc.
Figure 85 Company Snapshot: F. Hoffman-La Roche AG
Figure 86 Company Snapshot: General Electric Company
Figure 87 Company Snapshot: Merck KGaA (Germany)
Figure 88 Company Snapshot: Perkinelmer, Inc.
Figure 89 Company Snapshot: Thermo Fisher Scientific, Inc.

 Generating Response ...


Growth opportunities and latent adjacency in Nucleic Acid Labeling Market