
Occupant Classification System (OCS) Market

Occupant Classification System (OCS) Market by Vehicle Class (Economy, Mid-size, Luxury), Component Type (ACU, Sensor), Sensor Type (Pressure Sensor, Belt Tension Sensor), Electric Vehicle, Propulsion, and Region - Global Forecast to 2032


OVERVIEW
Source: Secondary Research, Interviews with Experts, MarketsandMarkets Analysis
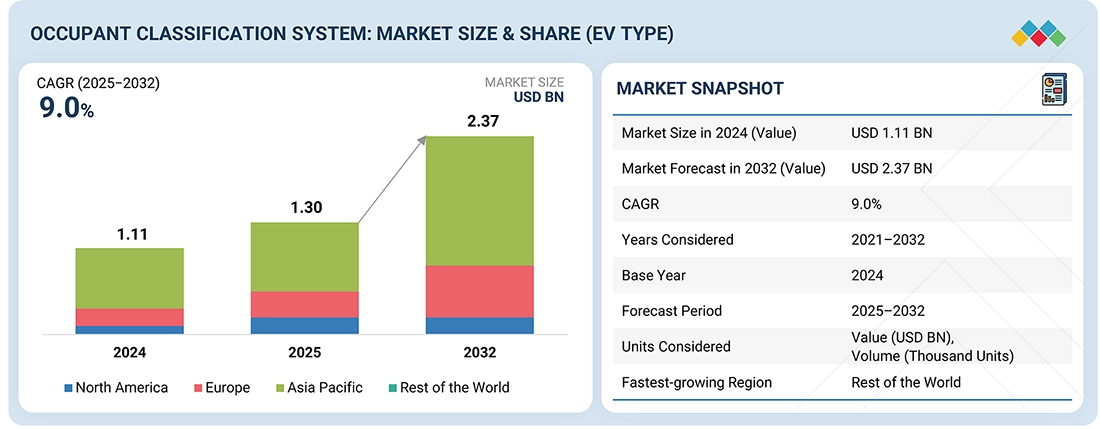
The global occupant classification system market for EVs is expected to reach USD 2.37 billion in 2032, up from USD 1.30 billion in 2025, with a CAGR of 9.0%. Meanwhile, the ICE vehicle OCS market is projected to hit USD 3.9 billion by 2032. The occupant classification system market will grow due to tighter global safety regulations such as Euro NCAP, US FMVSS, and the EU’s General Safety Regulation, which require advanced occupant and child detection features. Additionally, increasing consumer awareness of in-cabin safety, including efforts to prevent child fatalities in cars, will further drive OEM adoption across mass-market models.
Market Size and Forecast:
- Market Size Value in 2025: USD 1.30 Billion
- Revenue Forecast in 2032: USD 2.37 Billion
- Growth Rate: CAGR of 9.0% from 2025 to 2032
- Data available from 2021 to 2032
- Base year: 2024
- Forecast period: 2025–2032
Key Market Trends and Insights
- Market Growth: Growth is driven by stringent vehicle safety regulations, increasing consumer awareness of occupant protection, and rising adoption of advanced safety systems across passenger vehicles.
-
AI & Sensor Technology Impact: Advances in AI, radar, camera-based sensing, and sensor fusion technologies are improving occupant detection accuracy and enhancing system performance.
- Growing Trends: The market is witnessing increased adoption of intelligent occupant monitoring systems, child presence detection, camera-based occupant classification, and integration with connected and software-defined vehicles.
- Growth Opportunities: Opportunities are driven by the expansion of electric and autonomous vehicles, evolving global safety standards, and growing deployment of advanced occupant sensing technologies in mass-market vehicles.
KEY TAKEAWAYS
-
BY VEHICLE CLASSOCS demand is rising in economy cars due to regulations across EU and NA markets, along with growing consumer awareness in developing countries.
-
BY COMPONENTAirbag demand has been growing in emerging economies with OEMs increased adherence to global safety protocols, and increasing demand for safety over cost effectiveness in many markets.
-
BY SENSOR TYPEBoth pressure and belt sensors must grow to meet regulatory requirements for child detection systems across Europe and the US.
-
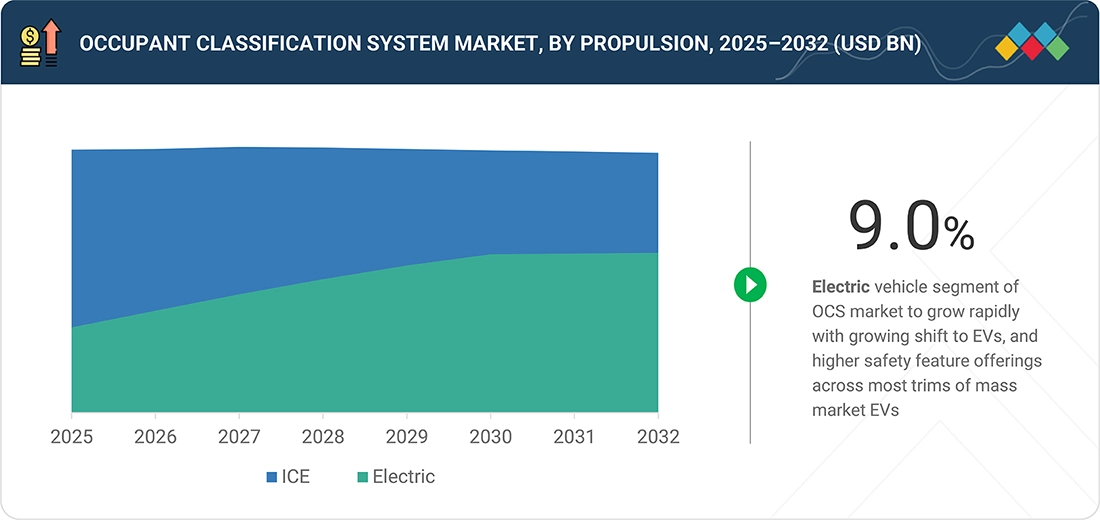
BY PROPULSIONOCS demand is growing rapidly in EVs, with increasing EV shift, and the presence of increased safety features in most trims of mass market EVs.
-
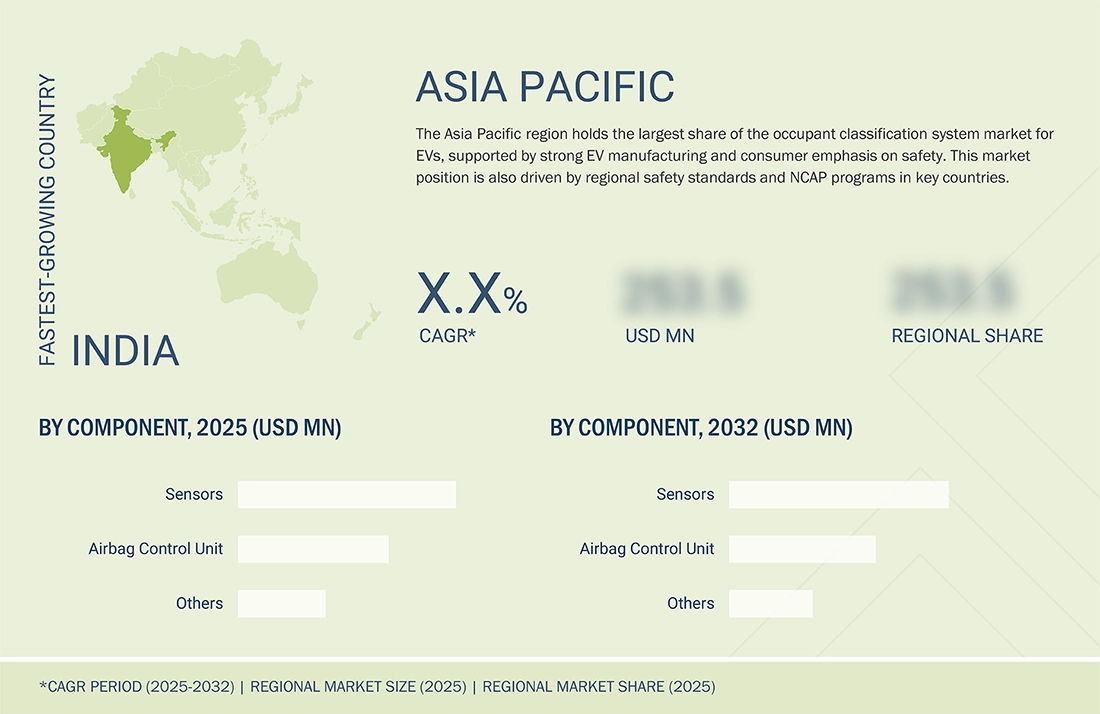
BY REGIONAsia Pacific leads the market, due to high volume sales of passenger cars, increasing priority for vehicle safety by OEMs and stricter regulations across India, Japan, and South Korea.
-
COMPETITIVE LANDSCAPEBosch, Denso, ZF Friedrichshafen, and Continental, among others, lead the classification system market. Key players are developing new products to enhance driver and passenger safety and collaborating with OEMs and other companies in the ecosystem to meet evolving regulatory requirements.
The OCS market is growing as automakers adopt these systems to boost safety ratings, which directly affect consumer trust and vehicle sales. Additionally, tighter regulations for accurate occupancy and child detection for airbag compliance are also fueling the market. Advances in AI, radar, and camera-based technologies are improving accuracy and expanding OCS applications beyond traditional weight sensors. Integration with connected and software-defined vehicle platforms is further encouraging adoption by enabling comfort, personalization, and data-driven services.
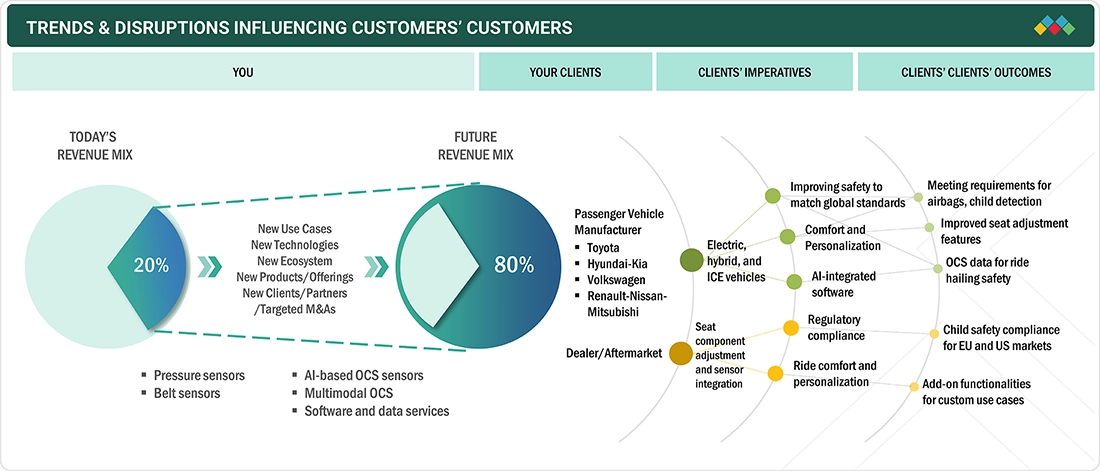
TRENDS & DISRUPTIONS IMPACTING CUSTOMERS' CUSTOMERS
The occupant classification system market is shifting from a hardware-focused revenue model toward a future that includes AI-based OCS, software, and data-driven features. This change is driven by new technologies, digital integration, and broader safety applications, as OEMs align with smart vehicle platforms. Client priorities like regulatory compliance, ADAS integration, and occupant personalization are guiding this transition, resulting in improved airbag deployment, smarter occupant safety solutions, and compliance with global safety standards.
Source: Secondary Research, Interviews with Experts, MarketsandMarkets Analysis
MARKET DYNAMICS
Level
-
Increasing stringency of safety regulations

-
Rising consumer awareness of safety

Level
-
Potential sensor malfunctions

-
Supply chain disruptions

Level
-
Integration of advanced technologies

-
Growing penetration of OCS in economy cars

Level
-
Limited penetration in emerging markets

-
Complex regulatory standards

Source: Secondary Research, Interviews with Experts, MarketsandMarkets Analysis
Driver: Increasing stringency of safety regulations
Occupant safety regulations worldwide are driving occupant classification system adoption beyond NCAP requirements. In the US, FMVSS 208 mandates occupant detection to control airbag deployment based on seat occupancy and classification. The EU enforces UN-ECE standards that require reliable occupant sensing within restraint systems, while China’s GB standards push for real-time detection and classification.
Restraint: Potential sensor malfunctions
Potential sensor malfunctions pose a critical risk to the occupant classification system market, as inaccurate occupant detection can lead to airbags failing to deploy when needed. Such failures expose OEMs to costly recalls, legal liabilities, and reputational damage in advanced safety systems.
Opportunity: Integration of advanced technologies
The integration of advanced technologies such as AI, machine learning, and 3D imaging is transforming the OCS market by enabling more accurate occupant detection, weight estimation, and posture recognition. Advanced technologies also open opportunities for personalization features like occupant-specific comfort and infotainment settings, expanding OCS use cases beyond safety.
Challenge: Limited penetration in emerging markets
The occupant classification system market faces challenges with lower penetration in developing markets due to high system costs, limited regulatory enforcement, and continued reliance on basic restraint systems. Many cost-sensitive OEMs prioritize affordability over advanced safety features, which slows the adoption of OCS in entry-level and mid-range vehicle segments
Occupant Classification System (OCS) Market: COMMERCIAL USE CASES ACROSS INDUSTRIES
| COMPANY | USE CASE DESCRIPTION | BENEFITS |
|---|---|---|
 |
AI interior sensing, child presence detection, pose recognition | Compliance with EU/US rules, improved crash safety, personalization. |
 |
Driver status monitor, posture and distraction detection | Prevents accidents via early warning, adds safety rating value |
 |
Child presence detection with UWB, cabin sensing for living vs. objects | Meets child safety mandates, reduces fatalities, fewer false alarms |
 |
Adaptive restraints with occupant digital twin, active seat belt tensioner | Smarter airbag and belt response, reduced injury risk, better crash outcomes |
 |
Body sensing, child detection, seat belt reminders | Reliable airbag suppression, child protection, regulation compliance |
Logos and trademarks shown above are the property of their respective owners. Their use here is for informational and illustrative purposes only.
MARKET ECOSYSTEM
The occupant classification system ecosystem includes raw material and semiconductor suppliers, airbag control units, sensor manufacturers, OCS solution providers, and OEMs. Key players like Robert Bosch GmbH, Denso Corporation, Aptiv, and Aisin Corporation hold the major market share and provide top-tier OCS systems for OEM integration across vehicles.
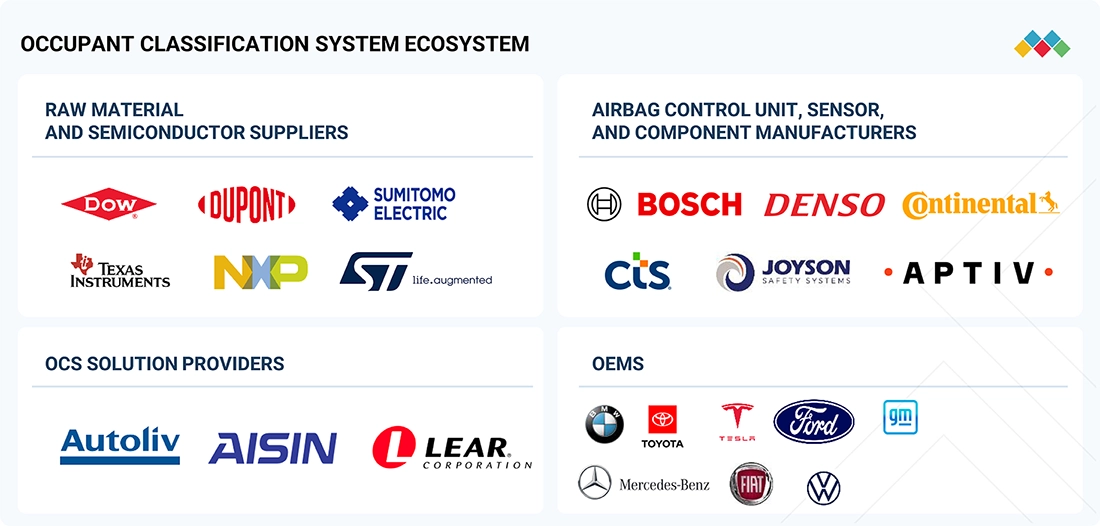
Logos and trademarks shown above are the property of their respective owners. Their use here is for informational and illustrative purposes only.
MARKET SEGMENTS
Source: Secondary Research, Interviews with Experts, MarketsandMarkets Analysis
Occupant Classification System Market, By Vehicle Class
The OCS market is expected to grow in the EV segment with growing adoption in emerging economies due to increased consumer awareness for vehicle safety. Increasing vehicle production and OEM push to standardize safety features across entry-level models are also accelerating demand.
Occupant Classification System Market, By Component
The increasing need for sensors to detect occupants will boost demand in passenger vehicles during the forecast period. Growing regulatory focus on advanced restraint systems is motivating OEMs to include these sensors for better safety compliance. This trend is also supported by regional regulations requiring child safety detection systems in vehicles.
Occupant Classification System Market, By Sensor Type
Belt tension sensors will play a key role in driving OCS demand in the coming years. These sensors provide more precise information on occupant position and restraint usage, enabling smarter airbag deployment and improved crash protection. Regulators and safety rating agencies are emphasizing advanced restraint systems, which is pushing OEMs to integrate belt tension sensing across vehicle models.
Occupant Classification System Market, By Propulsion
OCS adoption will rise in EVs as their usage increases, with manufacturers focusing on integrating smarter restraint and occupant detection systems. Seat and belt sensors, combined with AI-based classification and regulatory requirements for occupant and child detection, will boost demand.
REGION
Asia pacific to be the leading occupant classification system market during forecast period
Asia Pacific is expected to hold the largest share in the occupant classification system market, driven by demand for mid-size cars, stricter safety regulations such as China’s GB 11552-2009 and India’s Bharat NCAP, and increasing consumer focus on safety. Key players including Bosch, ZF, Autoliv, and TE Connectivity maintain strong operations in the region, while IEE Smart Sensing and Aptiv are expanding in India. Partnerships like Autoliv’s collaboration with JMC in China demonstrate ongoing investment in advanced OCS technologies to meet regulatory requirements.
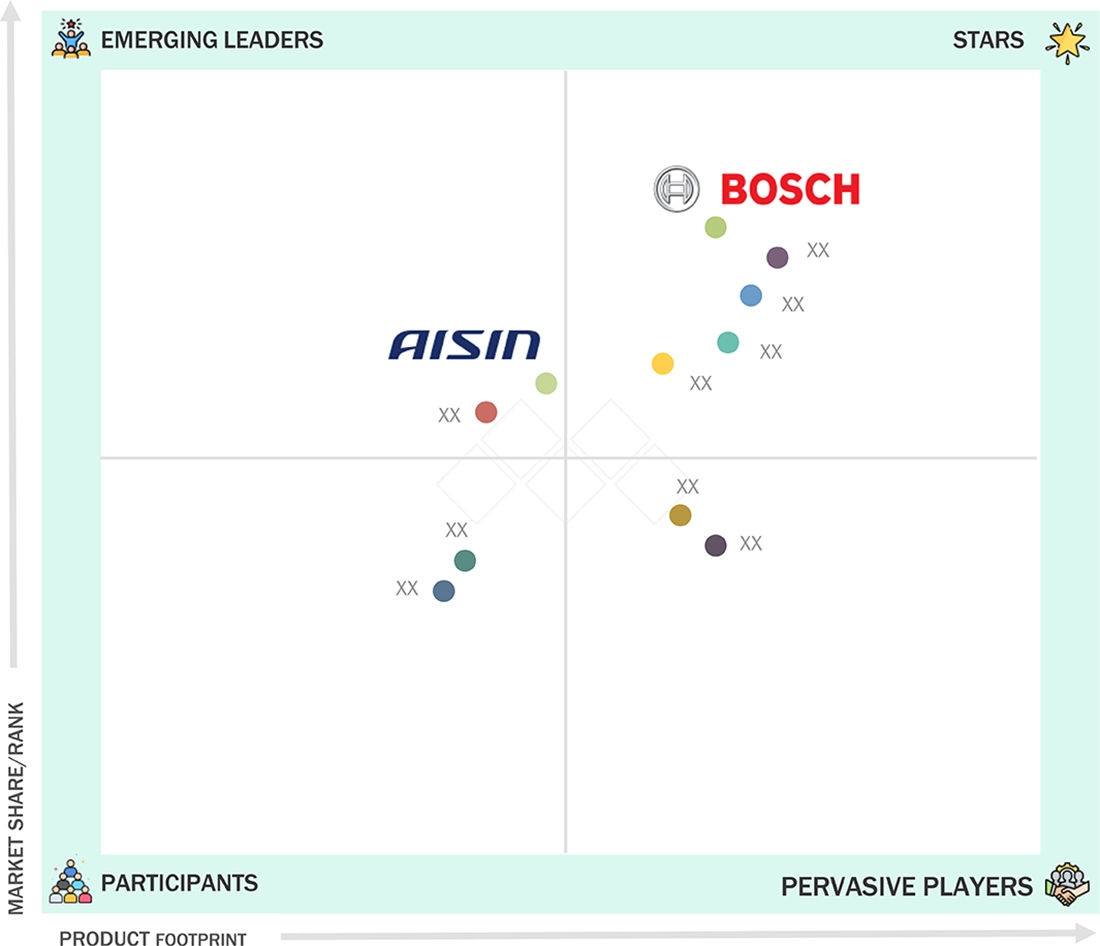
Occupant Classification System (OCS) Market: COMPANY EVALUATION MATRIX
In the occupant classification system market matrix, Robert Bosch GmbH (Star) leads with advanced, scalable ACUs and radar- and camera-based monitoring systems, enabling smart airbag deployment, child presence detection, and improved safety. Aisin Corporation (Emerging Leader) is gaining ground with occupant and seat sensors that enhance airbag and seat belt activation, showing strong potential to move toward the star quadrant.
Source: Secondary Research, Interviews with Experts, MarketsandMarkets Analysis
KEY MARKET PLAYERS
MARKET SCOPE
| REPORT METRIC | DETAILS |
|---|---|
| Market Size in 2025 (Value) | USD 5.08 BN (ICE+EV) |
| Market Forecast in 2032 (Value) | USD 6.32 BN (ICE+EV) |
| Growth Rate | CAGR of 9.0% from 2025-2032 |
| Years Considered | 2021-2032 |
| Base Year | 2024 |
| Forecast Period | 2025-2032 |
| Units Considered | Value (USD BN), Volume (Thousand Units) |
| Report Coverage | Revenue forecast, company ranking, competitive landscape, growth factors, and trends |
| Segments Covered |
|
| Regions Covered | Asia Pacific, Europe, North America, and Rest of the World |
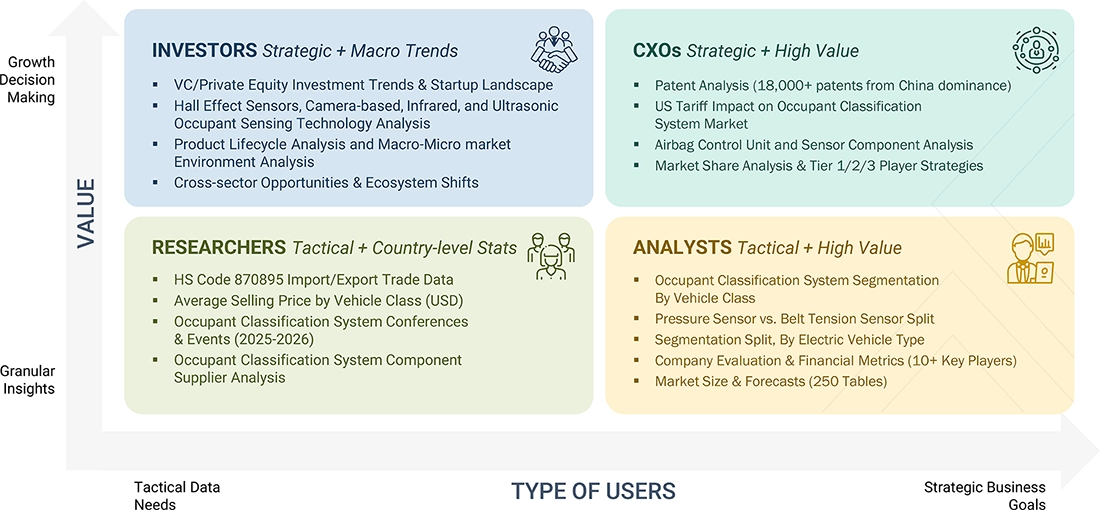
WHAT IS IN IT FOR YOU: Occupant Classification System (OCS) Market REPORT CONTENT GUIDE
DELIVERED CUSTOMIZATIONS
We have successfully delivered the following deep-dive customizations:
| CLIENT REQUEST | CUSTOMIZATION DELIVERED | VALUE ADDS |
|---|---|---|
| Market and Technology Landscape Analysis | Benchmarking of global and regional OCS technologies (weight sensors, vision-based, radar, AI integration) and market size forecast | Identified technology gaps, align R&D with regulatory and consumer trends, and guide investment priorities |
| OEM looking forward to consumer insights in emerging markets | Research on buyer awareness, willingness to pay for safety, and OCS-related feature preferences in emerging markets | Company would want to stay ahead of requirements, help suppliers push forward for higher adoption in cost sensitive markets |
RECENT DEVELOPMENTS
- January 2025 : Aptiv presented its Cabin and Driver Monitoring System focused on occupant safety and driver awareness. The cabin system supports occupant detection, child seat recognition, seat belt tracking, and restraint optimization, while also managing airbag deployment and crash presence detection. On the driver side, it monitors drowsiness, distraction, microsleep, head pose, and eye gaze to improve road safety.
- September 2024 : Denso Corporation revealed plans to expand the location of its Zenmyo facility in Nishio City, Japan. Construction of this facility is anticipated to begin in the first half of FY2025 and is expected to be completed by January 2027. Operations in this facility are scheduled to begin in the first half of FY2028. This new plant will feature a production system that can quickly respond to future market expansion and customer needs by manufacturing large-scale integrated ECUs.
- September 2024 : ZF Friedrichshafen AG announced that ZF LIFETEC is developing comprehensive physical and virtual (hybrid) test methods to improve occupant protection and speed up development cycles at competitive prices. Through these development cycles, seat belts, airbags, and steering wheels will be tested under the most demanding conditions.
- July 2024 : ZF LIFETEC created a Pre-Crash Dual Stage Side Airbag that uses vehicle sensors to activate milliseconds before a collision. The first stage pushes occupants up to 60 mm inward to create extra space, followed by the second stage that inflates like a traditional side airbag for enhanced protection. This system reduces injury risks in side and pole impacts by increasing the effective crumple zone and may help automakers achieve higher Euro NCAP safety ratings.
- February 2024 : ZF Friedrichshafen AG introduced an intelligent seat belt system to help reduce the impact of accidents. The system makes it easier for vehicle manufacturers to meet the increased requirements for restraint systems outlined in the NCAP Roadmap 2030.
Table of Contents
 Exclusive indicates content/data unique to MarketsandMarkets and not available with any competitors.
Methodology
The research study involves extensive use of secondary sources, such as company annual reports/presentations, industry association publications, magazine articles, directories, technical handbooks, World Economic Outlook, trade websites, technical articles, and databases, to identify and collect information on the occupant classification system (OCS) market. Primary sources, such as experts from related industries, OEMs, and suppliers, have been interviewed to obtain and verify critical information and assess the growth prospects and market estimations.
Secondary Research
Secondary sources for this research study include corporate filings, such as annual reports, investor presentations, and financial statements; trade, business, and professional associations; whitepapers and OCS & regulator-related journals; certified publications; articles by recognized authors; directories; and databases. Secondary data has been collected and analyzed to determine the overall market size, further validated by primary research.
Primary Research
After understanding the occupant classification system market scenario through secondary research, extensive primary research has been conducted. Primary interviews have been conducted with market experts from both demand and supply sides across North America, Europe, Asia Pacific, and the Rest of the World. Approximately 27% of interviews have been conducted from the demand side, while 73% have been conducted from the supply side. The primary data has been collected through questionnaires, emails, and telephone interviews.
In the canvassing of primaries, various departments within organizations, such as sales and operations, have been covered to provide a holistic viewpoint in this report. Primary sources from the supply side include various industry experts, such as CXOs, vice presidents, directors from business development, marketing, product development/innovation teams, and related key executives from various key companies. Various system integrators, industry associations, independent consultants/industry veterans, and key opinion leaders have also been interviewed.
 Market Size, and Share")
Notes: Others include sales managers and product managers.
Company tiers are based on the value chain; revenue from the company is not considered.
To know about the assumptions considered for the study, download the pdf brochure
Market Size Estimation
Both top-down and bottom-up approaches have been used to estimate and validate the total size of the occupant classification system market. These methods have also been used extensively to estimate the size of various subsegments in the market. The research methodology used to estimate the market size includes the following:
Occupant Classification System (OCS) Market : Top-Down and Bottom-Up Approach
 Market Top Down and Bottom Up Approach")
Data Triangulation
All percentage shares, splits, and breakdowns have been determined using secondary sources and verified by primary sources. All parameters that affect the markets covered in this research study have been accounted for, viewed in extensive detail, and analyzed to obtain the final quantitative and qualitative data. This data has been consolidated and enhanced with detailed inputs and analysis from MarketsandMarkets and presented in the report. The following figure is an illustrative representation of the overall market size estimation process employed for this study.
Market Definition
An OCS encompasses a safety system that uses sensors to detect and classify front-seat passengers, determining whether the airbag should be enabled or disabled. It enhances vehicle safety by preventing airbag deployment when a non-living object or improperly seated passenger is detected. According to Volvo, an OCS works in conjunction with seat sensors to ensure airbags deploy based on occupant classification.
Stakeholders
- Airbag Control Unit Manufacturers
- Automakers
- Automotive Industry Associations, Government Authorities, and Research Organizations
- Automotive Parts Distributors
- Automotive Pressure Sensor Manufacturers
- Country-specific Automotive Associations
- European Automobile Manufacturers Association (ACEA)
- Government and Research Organizations
- National Highway Traffic Safety Administration (NHTSA)
- Occupant Classification System Providers
- Repair and Service Centers
- Transport Authorities
- Vehicle Safety Regulatory Bodies
Report Objectives
- To analyze and forecast the occupant classification system market in terms of volume (thousand units) and value (USD million) from 2025 to 2032
-
To segment the market by vehicle class, component type, sensor type, electric vehicle, propulsion, and region
- To segment and forecast the market by vehicle class (economy car, mid-size car, and luxury car)
- To segment and forecast the market by component type (airbag control unit, sensor, and others)
- To segment and forecast the market by sensor type (pressure sensor and belt tension sensor)
- To segment and forecast the market by electric vehicle (battery electric vehicle, plug-in hybrid vehicle, and fuel cell electric vehicle)
- To segment and forecast the market by propulsion (ICE and electric)
- To forecast the market by region [North America, Europe, Asia Pacific, and the Rest of the World]
- To identify and analyze key drivers, challenges, restraints, and opportunities influencing market growth
- To strategically analyze the market for individual growth trends, prospects, and contributions to the total market
-
To study the following with respect to the market
- Case study analysis
- Ecosystem Analysis
- Trade analysis
- Key conferences and events
- Key stakeholders and buying criteria
- Patent analysis
- Regulatory landscape
- Supply chain analysis
- Technology analysis
- Pricing Analysis
- To strategically profile the key players and comprehensively analyze their market share and core competencies
- To analyze the impact of AI/Generative AI (GenAI) on the market
- To analyze the impact of US tariffs on the market
- To track and analyze competitive developments such as deals, product launches/developments, expansions, and other activities undertaken by the key industry participants
Available Customizations
With the given market data, MarketsandMarkets offers customizations:
- Additional Company Profiles (Up to 5)
- Global Occupant Classification System Market, By Propulsion, at Country Level
- Global Occupant Classification System Market, By Electric Vehicle, at Country Level
Key Questions Addressed by the Report
What is the current size of the global occupant classification system market?
The global occupant classification system market is projected to reach 3.95 billion by 2032 at a CAGR of -0.2%.
Who are the key players in the global occupant classification system market?
The occupant classification system market is dominated by major players, namely Robert Bosch GmbH (Germany), Denso Corporation (Japan), ZF Friedrichshafen AG (Germany), Continental AG (Germany), IEE Smart Sensing Solutions (Luxembourg), and AISIN CORPORATION (Japan).
Which region is projected to account for the largest share of the occupant classification system market?
The Asia Pacific region is projected to lead the occupant classification system market during the forecast period, driven by growing vehicle production, the focus of OEMs on enhanced safety features, rising consumer safety awareness, and stringent government regulations in emerging economies.
Which country is projected to lead the occupant classification systems market in Asia Pacific during the forecast period?
China is projected to account for the largest share of the occupant classification system market due to the presence of major OEMs, policies promoting vehicle production, and the surge in demand for passenger safety features in vehicles.
What are the key market trends impacting the growth of the occupant classification system market?
Improvements in sensor technologies, intelligent fabric sensors, and camera and radar-based occupant classification are the key market trends or technologies expected to impact the occupant classification system market significantly.
Need a Tailored Report?
Customize this report to your needs
Get 10% FREE Customization
Customize This ReportPersonalize This Research
- Triangulate with your Own Data
- Get Data as per your Format and Definition
- Gain a Deeper Dive on a Specific Application, Geography, Customer or Competitor
- Any level of Personalization
Let Us Help You
- What are the Known and Unknown Adjacencies Impacting the Occupant Classification System (OCS) Market
- What will your New Revenue Sources be?
- Who will be your Top Customer; what will make them switch?
- Defend your Market Share or Win Competitors
- Get a Scorecard for Target Partners

Custom Market Research Services
We Will Customise The Research For You, In Case The Report Listed Above Does Not Meet With Your Requirements
Get 10% Free CustomisationTESTIMONIALS

JIM NAAS
PRODUCT DIRECTOR, WEASLER
Weasler Engineering, a CentroMotion organization
Global Provider of Industrial Actuation & Control Solutionswww.weasler.com
Our organization was interested in learning more about the attractiveness of a particular market space. We contacted MarketsandMarkets to help us based on previous positive experiences we had with them. The results did not disappoint! We discussed our objectives with them, and the team at MarketsandMarkets developed and executed a proposal that met our needs precisely. We were very impressed by their level of expertise, the quality of the analysis and their insightful recommendations. We would not hesitate in working with them again in the future.

Matt Kardel,
Vice President
Aptiv,
A global technology company that develops safer, greener and more connected solutions.www.aptiv.com
We contracted with
MarketsandMarkets to evaluate the value chain and potential go-to-market partners related to our
interest in the Fleet Management space. The team successfully completed the work on time and at the
pricing agreed. MarketsandMarkets listened and understood our objectives and collaborated well with
us to help us get the visibility we needed to make an investment.
We have subsequently used
MarketsandMarkets again related to Smart Cities to good results.


Growth opportunities and latent adjacency in Occupant Classification System (OCS) Market