Offshore Crane Market by Application (Oil rig cranes, Marine cranes and others), by Design Type (Knuckle, Telescopic, Lattice and Others), by Lifting Capacity (0-500mt, 500-3000mt and above 3000mt) & by Region - Global Forecast to 2020
The offshore crane market is projected to reach a market size of USD 21.64 Billion by 2020 from an estimated value of USD 14.19 Billion in 2015 at a CAGR of 8.8% during the forecast period. The offshore crane market is broken down into several segments; applications (oil rig crane, marine crane, and others), lifting capacity (0-500mt, 500-3000mt, and above 3000mt), design (Knuckle, telescopic, lattice, and others) and region (Americas, Europe, Asia-Pacific, and Middle East & Africa).
Base Year: 2014
Forecast years: 2015-estimated, 2020-predicted
Research Methodology:
- Major regions were identified along with countries contributing the maximum share
- Secondary’s were conducted to find the number of new offshore oilfields in the region, trends for offshore renewable industry, and their contribution
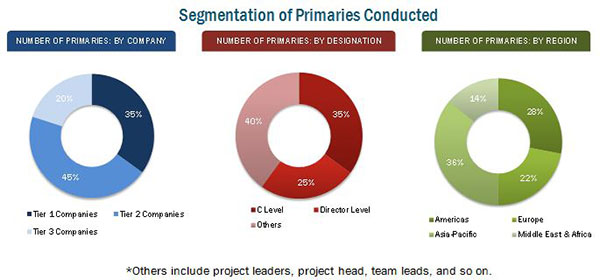
- Applications were identified on the basis of rigs contracted in the region and the split was calculated by conducting primary’s with industry participants, subject matter experts, C-level executives of key market players, and industry consultants among other experts, which helped to obtain and verify critical qualitative and quantitative information as well as assess future market prospects
- Top companies revenues (regional/global), rig pricing, and industry trends along with top-down, bottom-up, were used for estimates size
- This was further broken down into several segments and sub-segments on the basis of information gathered


Target Audience
The stakeholder’s for the report includes:
- Offshore Crane Manufacturing Companies
- Crane Distributors, Suppliers, and Wholesalers
- Shipping Associations
- Associations of Equipment Manufacturers
- Investment Banks
- Equipment Consulting & Research Companies
Scope of the Report:
- This study estimates the global market of offshore cranes, in terms of dollar value, till 2020
- It offers a detailed qualitative and quantitative analysis of this market
- It provides a comprehensive review of major market drivers, restraints, opportunities, challenges, winning imperatives, and key issues of the market
- It covers various important aspects of the market. These include analysis of value chain, Porter’s Five Forces model, competitive landscape, market dynamics, market estimates in terms of value, and future trends in the offshore crane market.
The market has been segmented into -
On the basis of Application
- Oil rig crane
- Marine crane
- Other cranes (Cranes used for wind turbine installation and on FPSOs)
On the basis of Design type
- Knuckle boom
- Telescopic
- Lattice
- Others ( Fixed and hybrid stiff booms)
On the basis of Lifting Capacity
- 0-500mt
- 500-3000mt
- Above 3000mt
On the basis of Region
- Americas
- Europe
- Asia-Pacific
- Middle East & Africa
Available Customization
With the market data provided above, MarketsandMarkets offers customizations as per the company’s specific needs. The following customization options are available for the report:
- Detailed analysis and profiling of additional market players (Up to 5)
- Country-wise analysis can be extended by one country for every region
The global offshore crane market is projected to reach USD 21.64 Billion by 2020 from an estimated USD 14.19 Billion in 2015. The worldwide growing offshore E&P activities will increase the demand for oil rigs. With increase in oil rigs, the market for rig construction equipment and construction vessels will also increase. This in turn, will propel the market for cranes on oil rig. These factors expected to drive the growth of the offshore crane market.
Increasing oil discoveries in emerging economies such as Asia and Africa are major drivers for this market. The growth in emerging economies is attributed to increasing capital expenditures in the countries such as China, India, Nigeria, Angola, Ghana, and Equatorial Guinea. Kenya, Tanzania, and Mozambique also provide exciting market opportunities for oil operators in the near future. Increasing deep water drilling activities all around the globe is another major driver for the offshore crane market.
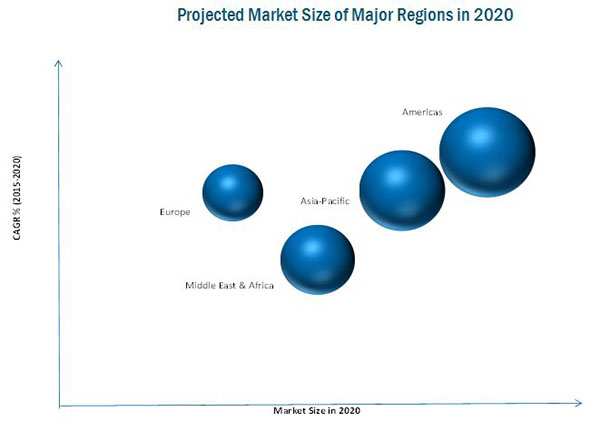
The Asia-Pacific region dominates the offshore crane market and is estimated to grow at a good pace in the next five years. The growth is attributed to the increase in offshore E&P activities in China, Malaysia, Australia, and Thailand.
The American offshore crane market rated second after Asia-Pacific. This market is projected to grow at a highest growth rate. The growth is attributed to the increase in the offshore vessel demand in offshore regions of the U.S., Gulf of Mexico, and Brazil. Secondly, liberalization of Mexican oil & gas industry is another key driver fueling the demand for the offshore crane market.
The offshore crane market in Europe is driven by the increase in the offshore wind power generation. High capacity tower cranes are required to install wind turbines. With the increase in offshore wind power generation capacity, the market for offshore cranes will also increase.
Nearly half of the offshore crane market is covered by marine cranes applications, but with the advent of advanced technology, the operators are entering into deepwater and ultra-deepwater oil & gas zones. This will also propel the market further for oil rig application.
Moreover, decreasing production in shallow water basins and large potential of untapped subsea hydrocarbon reserves are contributing in the increased focus in deepwater drilling. There has been increasing deepwater oil discoveries in India, Africa, Australia, the U.S., Russia, and Norway. Oil discoveries in African region especially in Ghana, Congo, Mozambique, and Angola are creating lucrative business opportunities, where offshore drilling market players are trying to focus to enhance their revenue.

Some of the leading players in the offshore crane market include Liebherr (Switzerland), Cargotec (Finland), Terex Corporation (France), Konecranes (France), and Zoomlion (U.S.) among others. Award recognition was the most commonly used strategy by top players in the market, constituting half of the total development share. It was followed by new product launches, expansion, and other developments.
The major player of offshore crane market also faces some challenges into the market like high environmental risk, decline in offshore support vessel demand, and others.

Table of Contents
1 Introduction (Page No. - 13)
1.1 Objectives of the Study
1.2 Market Definition
1.3 Market Scope
1.3.1 Markets Covered
1.3.2 Years Considered for the Study
1.4 Currency
1.5 Limitations
1.6 Stakeholders
2 Research Methodology (Page No. - 18)
2.1 Research Data
2.1.1 Secondary Data
2.1.1.1 Key Data From Secondary Sources
2.1.2 Primary Data
2.1.2.1 Key Data From Primary Sources
2.1.2.2 Key Industry Insights
2.1.2.3 Breakdown of Primaries
2.2 Market Size Estimation
2.3 Market Breakdown and Data Triangulation
2.4 Research Assumptions & Limitations
2.4.1 Assumptions
2.4.2 Limitations
3 Executive Summary (Page No. - 27)
4 Premium Insights (Page No. - 33)
4.1 Attractive Market Opportunities
4.2 Asia-Pacific: the Largest Market for Offshore Crane
4.3 China to Dominate the Offshore Crane Market By Market Size in Asia–Pacific in 2014
4.4 Knuckle Boom Design Type Segment Expected to Lead the Market
4.5 Life Cycle Analysis, By Region
5 Industry Trends (Page No. - 41)
5.1 Introduction
5.2 Supply Chain Analysis
5.3 Industry Trends
5.4 Porter’s Five Forces Analysis
5.4.1 Threat From New Entrants
5.4.2 Threat of Substitute
5.4.3 Bargaining Power of Buyers
5.4.4 Bargaining Power of Suppliers
5.4.5 Industry Competition
6 Market Overview (Page No. - 49)
6.1 Introduction
6.2 Market Segmentation
6.2.1 By Application
6.2.2 By Design Type
6.2.3 By Lifting Capacity
6.2.4 By Region
6.3 Market Dynamics
6.3.1 Drivers
6.3.1.1 Offshore Renewable Industry Growth
6.3.1.2 Expansion in Offshore Exploration and Production Activities
6.3.1.3 Boost in the Subsea Construction Vessel Industry
6.3.2 Restraints
6.3.2.1 Decline in the Offshore Support Vessel Demand
6.3.2.2 High Environmental Risk
6.3.2.3 High Entry Barriers
6.3.3 Opportunities
6.3.3.1 Increase in Offshore Spending
6.3.3.2 Potential Oilfield Discovery
6.3.4 Challenges
6.3.4.1 Safety Concerns in Offshore Industry
6.3.4.2 Current Low Oil Price
7 Offshore Crane Market, By Application (Page No. - 62)
7.1 Introduction
7.2 Oil Rig Cranes
7.3 Marine Cranes
7.4 Others Cranes
8 Offshore Crane Market, By Lifting Capacity (Page No. - 73)
8.1 Introduction
8.2 0-500mt Lifting Capacity
8.2.1 500-3,000mt Lifting Capacity
8.2.2 Above 3,000mt Lifting Capacity
9 Offshore Crane Market, By Design Type (Page No. - 80)
9.1 Introduction
9.2 Knuckle Boom Design Type
9.3 Telescopic Boom Design Type
9.4 Lattice Boom Design Type
9.5 Other Boom Design Type
10 Offshore Crane Market, By Region (Page No. - 87)
10.1 Introduction
10.2 Americas
10.2.1 U.S.
10.2.2 Mexico
10.2.3 Brazil
10.2.4 Rest of Americas
10.3 Europe
10.3.1 Norway
10.3.2 U.K.
10.3.3 Rest of Europe
10.4 Asia-Pacific
10.4.1 China
10.4.2 India
10.4.3 Australia
10.4.4 Rest of Asia-Pacific
10.5 Middle East & Africa
10.5.1 UAE
10.5.2 Saudi Arabia
10.5.3 Nigeria
10.5.4 Angola
10.5.5 Rest of the Middle East & Africa
11 Competitive Landscape (Page No. - 124)
11.1 Overview
11.2 Market Share Analysis
11.3 Competitive Situation & Trends
11.3.1 Contracts & Agreements
11.3.2 New Product Development
11.3.3 Mergers & Acquisitions
11.3.4 Expansions
11.3.5 Other Developments
12 Company Profiles (Page No. - 134)
12.1 Introduction
12.2 Cargotec
12.2.1 Business Overview
12.2.2 Products Offering
12.2.3 Developments, 2013-2015
12.2.4 SWOT Analysis
12.2.5 MnM View
12.3 Konecranes
12.3.1 Business Overview
12.3.2 Products Offered
12.3.3 Developments, 2012-2015
12.3.4 SWOT Analysis
12.3.5 MnM View
12.4 Liebherr
12.4.1 Business Overview
12.4.2 Products Offered
12.4.3 Developments, 2014-2015
12.4.4 SWOT Analysis
12.4.5 MnM View
12.5 Manitowoc
12.5.1 Business Overview
12.5.2 Products Offered
12.5.3 Developments, 2014-2015
12.5.4 SWOT Analysis
12.5.5 MnM View
12.6 TEREX Corporation
12.6.1 Business Overview
12.6.2 Products Offered
12.6.3 Developments, 2013-2014
12.6.4 SWOT Analysis
12.6.5 MnM View
12.7 Huisman
12.7.1 Business Overview
12.7.2 Products Offered
12.7.3 Developments, 2011-2015
12.8 Kenz Figee
12.8.1 Business Overview
12.8.2 Products Offered
12.8.3 Developments, 2014-2015
12.9 National Oilwell Varco
12.9.1 Business Overview
12.9.2 Products Offered
12.9.3 Developments
12.10 Palfinger
12.10.1 Business Overview
12.10.2 Products Offered
12.10.3 Developments, 2012-2015
12.11 Zoomlion
12.11.1 Business Overview
12.11.2 Products Offered
12.11.3 Developments, 2011
13 Appendix (Page No. - 171)
13.1 Insights of Industry Experts
13.2 Discussion Guide
13.3 Available Customizations
13.4 Introducing RT: Real Time Market Intelligence
13.5 Related Reports
List of Tables (64 Tables)
Table 1 Offshore Renewable Industry Growth, Expansion in Offshore Exploration & Production Activities are Propelling the Growth of the Market
Table 2 High Initial Investment and Longer Startup Time Restrain Market Growth
Table 3 Increase in Offshore Spending and Discovery of New Offshore Oilfields are Opportunities for the Offshore Crane Market
Table 4 Safety Concerns and Low Oil Prices are Key Challenges for Offshore Crane Market
Table 5 Offshore Crane Market Size, By Application, 2013-2020 (USD Million)
Table 6 Oil Rig Crane Market Size, By Top Countries, 2013-2020 (USD Million)
Table 7 Offshore Rig Count, By Company & Type, 2015
Table 8 Oil Rig Crane Market Size, By Region, 2013-2020 (USD Million)
Table 9 Marine Crane Market Size, By Top Countries, 2013-2020 (USD Million)
Table 10 Marine Crane Market Size, By Region, 2013-2020 (USD Million)
Table 11 Others Cranes Market Size, By Top Countries, 2013-2020 (USD Million)
Table 12 Offshore Wind Farms From January to June 2015
Table 13 Others Cranes Market Size, By Region, 2013-2020 (USD Million)
Table 14 Offshore Crane Market Size, By Lifting Capacity, 2013-2020 (USD Million)
Table 15 0-500mt Lifting Capacity Offshore Crane Market Size, By Region, 2013-2020 (USD Million)
Table 16 500-3,000mt Lifting Capacity Offshore Crane Market Size, By Region, 2013-2020 (USD Million)
Table 17 Above 3,000mt Lifting Capacity Offshore Crane Market Size, By Region, 2013-2020 (USD Million)
Table 18 Offshore Crane Market Size, By Design Type, 2013-2020 (USD Million)
Table 19 Knuckle Boom Design Type Offshore Crane Market Size, By Region, 2013-2020 (USD Million)
Table 20 Telescopic Boom Design Type Offshore Crane Market Size, By Region, 2013-2020 (USD Million)
Table 21 Lattice Boom Design Type Offshore Crane Market Size, By Region, 2013-2020 (USD Million)
Table 22 Other Boom Design Type: Offshore Crane Market Size, By Region, 2013-2020 (USD Million)
Table 23 Offshore Crane Market Size, By Region, 2013-2020 (USD Million)
Table 24 Americas: Offshore Crane Market Size, By Country, 2013-2020 (USD Million)
Table 25 Americas : Offshore Crane Market Size, By Application, 2013-2020 (USD Million)
Table 26 Americas: Oil Rig Crane Market Size, By Country, 2013-2020 (USD Million)
Table 27 Americas: Marine Rig Crane Market Size, By Country, 2013-2020 (USD Million)
Table 28 Americas: Others Crane Market Size, By Country, 2013-2020 (USD Million)
Table 29 U.S.: Offshore Crane Market Size, By Application, 2013-2020 (USD Million)
Table 30 Mexico: Offshore Crane Market Size, By Application, 2013-2020 (USD Million)
Table 31 Brazil: Offshore Crane Market Size, By Application, 2013-2020 (USD Million)
Table 32 Rest of Americas: Offshore Crane Market Size, By Application, 2013-2020 (USD Million)
Table 33 Europe: Offshore Crane Market Size, By Country, 2013-2020 (USD Million)
Table 34 Europe: Market Size, By Application, 2013-2020 (USD Million)
Table 35 Europe: Oil Rig Cranes Market Size, By Country, 2013-2020 (USD Million)
Table 36 Europe: Marine Cranes Market Size, By Country, 2013-2020 (USD Million)
Table 37 Europe: Others Cranes Market Size, By Country, 2013-2020 (USD Million)
Table 38 Norway: Offshore Crane Market Size, By Application, 2013-2020 (USD Million)
Table 39 U.K.: Offshore Crane Market Size, By Application, 2013-2020 (USD Million)
Table 40 Rest of Europe: Market Size, By Application, 2013-2020 (USD Million)
Table 41 Asia-Pacific: Market Size, By Country, 2013-2020 (USD Million)
Table 42 Asia-Pacific: Market Size, By Application, 2013-2020 (USD Million)
Table 43 Asia-Pacific: Oil Rig Crane Market Size, By Country, 2013-2020 (USD Million)
Table 44 Asia-Pacific: Marine Crane Market Size, By Country, 2013-2020 (USD Million)
Table 45 Asia-Pacific: Others Crane Market Size, By Country, 2013-2020 (USD Million)
Table 46 China: Market Size, By Application, 2013-2020 (USD Million)
Table 47 India: Market Size, By Application, 2013-2020 (USD Million)
Table 48 Australia: Market Size, By Application, 2013-2020 (USD Million)
Table 49 Rest of Asia-Pacific: By Market Size, By Application, 2013-2020 (USD Million)
Table 50 Middle East & Africa: By Market Size, By Country, 2013-2020 (USD Million)
Table 51 Middle East & Africa: By Market Size, By Application, 2013-2020 (USD Million)
Table 52 Middle East & Africa: Oil Rig Crane Market Size, By Country, 2013-2020 (USD Million)
Table 53 Middle East & Africa: By Market Size, By Country, 2013-2020 (USD Million)
Table 54 Middle East & Africa: Other Crane Market Size, By Country, 2013-2020 (USD ‘000)
Table 55 UAE: Market Size, By Application, 2013-2020 (USD Million)
Table 56 Saudi Arabia: By Market Size, By Application, 2013-2020 (USD Million)
Table 57 Nigeria: By Market Size, By Application, 2013-2020 (USD Million)
Table 58 Angola: By Market Size, By Application, 2013-2020 (USD Million)
Table 59 Rest of the Middle East & Africa: By Market Size, By Application, 2013-2020 (USD Million)
Table 60 Contracts & Agreements, 2014-2015
Table 61 New Product Development, 2014-2015
Table 62 Mergers & Acquisitions, 2013-2015
Table 63 Expansions, 2013-2015
Table 64 Other Developments, 2013-2015
List of Figures (46 Figures)
Figure 1 Markets Covered: Offshore Crane Market
Figure 2 Offshore Crane Market: Research Design
Figure 3 Breakdown of Primary Interviews: By Company Type, Designation, & Region
Figure 4 Market Size Estimation Methodology: Bottom-Up Approach
Figure 5 Market Size Estimation Methodology: Top-Down Approach
Figure 6 Data Triangulation
Figure 7 Offshore Crane Market Snapshot (2015 vs 2020): Marine Cranes Segment Expected to Occupy the Largest Market Share
Figure 8 Marine Crane Market, By Region, 2020 (USD Million)
Figure 9 Asia-Pacific Dominated the Offshore Crane Market in 2014
Figure 10 Offshore Crane Market, By Design Type, 2015–2020 (USD Million)
Figure 11 Development of Unconventional Reserves is Expected to Drive the Market During the Forecast Period
Figure 12 Americas to Be the Highest-Growing Regional Market for Offshore Crane From 2015 to 2020
Figure 13 Marine Crane Application Accounted for A Major Share (Value) in this Market in 2014
Figure 14 Knuckle Boom Segment Expected to Account for A Major Share (Value) in this Market During the Forecast Period
Figure 15 Life Cycle Analysis, By Region, From 2015 to 2020
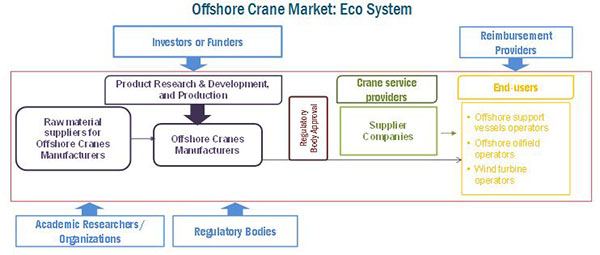
Figure 16 Offshore Cranes: Supply Chain Analysis
Figure 17 Acceleration in Offshore Wind Industry and Shift of Energy Production to the New Areas to Drive the Global Market
Figure 18 Offshore Cranes: Porter’s Five Forces Analysis
Figure 19 Market Segmentation of Offshore Crane Market
Figure 20 Market Dynamics of Market
Figure 21 Brent Crude Oil Prices, (USD Per Barrel)
Figure 22 Reliable & High Quality Make Offshore Cranes Most Favourable for Marine Usage
Figure 23 Offshore Crane Market Share (Value), By Lifting Capacity, 2014
Figure 24 Knuckle Boom Design Type is the Fastest-Growing Segment in the Global Offshore Crane Market
Figure 25 Regional Snapshot- 2015-2020 (CAGR%) – the U.S., Brazil, India, and Saudi Arabia Emerged as New Hot Spots
Figure 26 Americas: Regional Snapshot
Figure 27 Europe: Regional Snapshot
Figure 28 Companies Adopted Partnerships/Agreements/Collaborations as the Key Growth Strategy in the Past Three Years to Dominate the Market
Figure 29 Offshore Crane : Market Share Analysis, 2014
Figure 30 Market Evaluation Framework: Award Recognition, New Product Developments, Mergers & Acquisitions Have Fuelled Growth of Companies From 2012 to 2015
Figure 31 Region-Wise Revenue Mix of Top 5 Market Players
Figure 32 Cargotech : Company Snapshot
Figure 33 Cargotec: SWOT Analysis
Figure 34 Konecranes : Company Snapshot
Figure 35 Konecranes: SWOT Analysis
Figure 36 Liebherr : Company Snapshot
Figure 37 Liebherr: SWOT Analysis
Figure 38 Manitowoc : Company Snapshot
Figure 39 Manitowoc: SWOT Analysis
Figure 40 TEREX Corporation : Company Snapshot
Figure 41 TEREX Corporation: SWOT Analysis
Figure 42 Huisman : Company Snapshot
Figure 43 Kenz-Figee : Company Snapshot
Figure 44 National Oilwell Varco: Company Snapshot
Figure 45 Palfinger: Company Snapshot
Figure 46 Zoomlion : Company Snapshot


Growth opportunities and latent adjacency in Offshore Crane Market