Offshore Drilling Market by Service (Contract Drilling, Directional Drilling, Logging While Drilling, and Measurement While Drilling), by Application (Shallow, Deep, and Ultra-Deep Water) & by Region - Global Forecast to 2020


Offshore drilling includes services related to drilling wells including type of the rig required, depth and direction of well to be dug and services and expertise required to accomplish the desired goal. Offshore drilling market is estimated to be $78.57 Billion in 2014 and is projected to grow with a CAGR of 4.54% from 2015 to 2020. Crude oil prices which have witnessed a sharp decline in the last one year are expected to increase to USD 80/ barrel by 2018. This rebound in oil price will be spurred by the delay in capacity addition as the oil & gas companies are currently shelving new projects to reduce their capital expenditure. With the increase in the price of crude oil, the investments for E&P activities will also increase which will lead to new projects in regions that are looking to overturn their production decline such as Europe and Asia-Pacific. This will in turn create further demand for the offshore drilling in these regions.
Years considered for the study: 2013, 2014, 2015 and 2020
Base Year: 2014
Forecast years: 2015-estimated, 2020-predicted
Research Methodology:
- Major regions were identified along with countries contributing the maximum share
- Secondary research was conducted to find the depths (shallow, deep, ultra-deep water) of offshore oilfields in the regions and their contribution
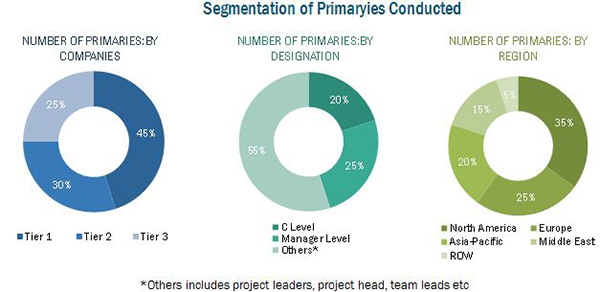
- Services were identified on the basis of rigs contracted in the region and the split was calculated by conducting primary�s with industry participants, subject matter experts, C-level executives of key market players, and industry consultants among other experts, which helped to obtain and verify critical qualitative and quantitative information as well as assess future market prospects
- Top companies revenues (regional/global), rig pricing, and industry trends along with top-down, bottom-up, and MnM KNOW were used to estimate market value
- This was further broken down into several segments and subsegments on the basis of information gathered
Study addresses several of the stakeholders which include OEMs, EPC companies, Utility service providers, Distributers & Suppliers, Consulting firms, Private Equity groups, investment houses, equity research firms and other stakeholders. It gives them information about market segments to focus in next two to five years for prioritizing the efforts and investments
Scope of the report:
- This study estimates the global market of offshore drilling, in terms of dollar value, till 2020
- It offers a detailed qualitative and quantitative analysis of this market
- It provides a comprehensive review of major market drivers, restraints, opportunities, challenges, winning imperatives, and key issues of the market
- It covers various important aspects of the market. These include analysis of value chain, Porter�s Five Forces model, competitive landscape, market dynamics, market estimates in terms of value, and future trends in the offshore drilling market.
The market has been segmented into -
On the basis of Service Type
- Contract Drilling
- Directional Drilling
- Logging While Drilling
- Measurement While Drilling
On the basis of Application
- Shallow Water
- Deep Water
- Ultra-Deep Water
On the basis of Region
- North America
- South America
- Asia-Pacific
- Middle East
- Europe
- Africa
Available Customization
With the market data provided above, MarketsandMarkets offers customizations as per the company�s specific needs. The following customization options are available for the report:
- Detailed analysis and profiling of additional market players (Up to 5)
- Country-wise analysis can be extended by one country for every region
The increase in the global oil and gas production in North America and the Middle East accompanied by the maturing onshore oilfields shifted the focus of operators towards offshore for new E&P activities. However, due to the recent crude oil price slump, offshore drilling companies will see weaker revenues over the next few quarters. This downfall is a result of the spending cuts and increase in demand for better pricing and terms of the contract negotiations and renewals. Offshore drilling companies are likely to face a dip in the demand and pricing for services. These companies are therefore trying to capitalize on scale, improve their operational efficiency and their cost bases.
Global offshore drilling market is expected to grow from USD 78.6 Billion in 2014 to USD 89.8 Billion by 2020, at a CAGR of 4.54% during 2015-2020. Asia-Pacific accounted for the largest market share in 2014 and is projected to grow at a CAGR of 4.49% during 2015-2020.
Offshore drilling market has been classified on the basis of applications such as shallow water, deepwater and ultra-deepwater based operations.
Nearly half of the offshore drilling market is covered by shallow water applications, but with the advent of advanced technology, the operators are entering into deepwater and ultra-deepwater zones. Moreover, due to decreasing production in shallow water basins, the large potential of untapped subsea hydrocarbon reserves is driving increased focus in deep water drilling. There have been increasing deep water oil discoveries in India, Africa, Australia, the U.S., Russia, and Norway. Oil discoveries in Africa especially in Ghana, Congo, Mozambique, and Angola are creating lucrative business opportunities where offshore drilling market players are trying to focus to enhance their revenue.
Offshore drilling market has also been classified on the basis of service type into offshore contract drilling, directional drilling, logging-while-drilling and measurement while drilling. More than half of the offshore drilling market is captured by offshore contract drilling services. The market is also witnessing an increase in directional drilling. However due to continuous decline of oil price since mid-2014, the market has witnessed a drastic setback leading to retirement/cold stacking of many of the rigs and delay in the delivery of new rigs. Several operators have either cancelled or postponed their contracts leading to lower day rates.
Asia-Pacific is the leading market in the offshore drilling owing to the offshore activities taking place in South China Sea. China, Thailand, India, Australia and Indonesia are mainly driving growth of the offshore drilling market in the region. Also, Liberalization of Mexican oil & gas industry is another key driver fueling the demand for offshore drilling market in South America. Mexico is one of the largest non-OPEC oil producers in the world. With the liberalization, state run monopoly has ended, paving way for foreign E&P companies.
The recent downturn in the crude oil prices has resulted in the decline of the exploration & production (E&P) activities all over the world. As offshore drilling is highly capital intensive industry, it was affected more as compared to onshore drilling industry. Many contracts were cancelled, postponed, or reworked by companies for rigs. Rigs still in operation are operating on very low dayrates compared to the rates in 2013-14.The current expenditure in E&P has fallen since 2014 but the current capacity reduction is expected to resolve the current demand and supply imbalance of oil and gas. Thus, the price of oil and gas is expected to rise in the future amounting to more capital expenditure on oil and gas E&P activities. As a result, the expected increase in the demand for energy in the future is expected to push the need for optimum exploration & production, thus boosting the demand for the offshore drilling across the globe.
 Exclusive indicates content/data unique to MarketsandMarkets and not available with any competitors.
Table of Contents
1 Introduction (Page No. - 16)
1.1 Objectives of the Study
1.2 Market Definition
1.3 Market Scope
1.3.1 Markets Covered
1.3.2 Years
1.4 Currency
1.5 Limitations
1.6 Stakeholders
2 Research Methodology (Page No. - 19)
2.1 Research Data
2.1.1 Secondary Data
2.1.1.1 Key Data From Secondary Sources
2.1.2 Primary Data
2.1.2.1 Key Data From Primary Sources
2.1.3 Key Industry Insights
2.1.4 Breakdown of Primaries
2.2 Market Size Estimation
2.2.1 Bottom-Up Approach
2.2.2 Top Down Approach
2.3 Market Breakdown and Data Triangulation
2.4 Research Assumptions & Limitations
2.4.1 Assumptions
2.4.2 Limitations
3 Executive Summary (Page No. - 30)
4 Premium Insights (Page No. - 34)
4.1 Attractive Market Opportunities in the Offshore Drilling Services Market
4.2 Offshore Drilling Market , By Region
4.3 Offshore Drilling Market in the Asia_Pacific Region
4.4 Asia-Pacific, the Largest Offshore Drilling Market in 2014
4.5 Offshore Drilling Market: By Services
5 Industry Trends (Page No. - 39)
5.1 Introduction
5.2 Supply Chain Analysis
5.3 Porter�s Five Forces Analysis
5.3.1 Threat of New Entrants
5.3.2 Threat of Substitutes
5.3.3 Bargaining Power of Suppliers
5.3.4 Bargaining Power of Buyers
5.3.5 Intensity of Competitive Rivalry
6 Market Overview (Page No. - 44)
6.1 Introduction
6.2 Market Dynamics
6.2.1 Drivers
6.2.1.1 Rising Investments in Emerging Economies
6.2.1.2 Liberalization of Mexican Oil & Gas Industry
6.2.1.3 Rapid Technological Advancements
6.2.2 Restraints
6.2.2.1 Capital Intensive
6.2.2.2 Oil Price Slump
6.2.3 Opportunities
6.2.3.1 Arctic Discoveries
6.2.3.2 Growing Focus on Deep Water Drilling
6.2.4 Challenges
6.2.4.1 Rising Environmental Concerns
6.2.4.2 Strict Government Regulations
6.3 Impact of Market Dynamics
7 An Overview of the Offshore Oil & Gas Industry (Page No. - 57)
7.1 Introduction
7.2 Global Oil & Gas Reserves
7.2.1 Global Oil & Gas Reserves, By Regions
7.3 Global Offshore Oil & Gas Production
7.3.1 Global Offshore Oil Production
7.3.2 Global Offshore Gas Production
7.4 Offshore Drilling Activity
7.4.1 Global Offshore Drilling Activity
7.4.2 Asia-Pacific Offshore Drilling
7.4.3 Europe Offshore Drilling
7.4.4 Middle East Offshore Drilling
7.4.5 Africa Offshore Drilling
7.4.6 North America Offshore Drilling
7.4.7 South America Offshore Drilling
8 Offshore Drilling Rig Market (Page No. - 64)
8.1 Introduction
8.1.1 Drillships
8.1.2 Semi-Submersibles
8.1.3 Jackups
8.1.4 Platform Rigs
8.1.5 Tender Assist Rig
8.2 Offshore Rig Supply Overview
8.2.1 The U.S. Gulf of Mexico (US GOM)
8.2.2 West Africa/Mediterranean
8.2.3 North Sea
8.2.4 Middle East
8.2.5 South East Asia/India
8.2.6 South America
8.2.7 Mexico
8.2.8 Others
8.3 Offshore Driller�s Market
8.3.1 Offshore Rig Count, By Company and Type
8.3.2 Jackup Newbuilds, By Company
8.3.3 Floaters Newbuilds, By Company
8.4 Offshore Rigs Newbuilds
8.4.1 Jackup Newbuilds Deliveries
8.4.1.1 Jackups New Build Deliveries, 2014
8.4.1.2 Jackup New Build Deliveries, 2015
8.4.1.3 Jackup New Build Deliveries, 2016+
8.4.2 Drillships Newbuilds Deliveries
8.4.2.1 Drillships New Build Deliveries, 2014
8.4.2.2 Drillships New Build Deliveries, 2015
8.4.2.3 Drillships New Build Deliveries, 2016
8.4.2.4 Drillships New Build Deliveries, 2017+
8.4.3 Semi-Submersibles New Builds Deliveries
8.4.3.1 Semi-Submersibles New Build Deliveries, 2014
8.4.3.2 Semi-Submersibles New Build Deliveries, 2015
8.4.3.3 Semi-Submersibles New Build Deliveries, 2016
8.4.3.4 Semi-Submersibles New Build Deliveries, 2017+
8.5 Offshore Rig Utilization Rate
8.6 Offshore Rig Day Rates
8.6.1 Jackup Day Rate
8.6.2 Floater Day Rate
9 Global Offshore Drilling Market, By Service (Page No. - 92)
9.1 Introduction
9.2 Offshore Contract Drilling Market
9.3 Offshore Directional Drilling Market
9.4 Offshore Logging While Drilling Market (LWD)
9.5 Offshore Measurement While Drilling (MWD)
10 Global Offshore Drilling Market, By Application (Page No. - 100)
10.1 Introduction
10.2 Shallow Water Drilling Market
10.3 Deepwater Drilling Market
10.4 Ultra-Deepwater Drilling Market
11 Offshore Drilling Market, By Region (Page No. - 107)
11.1 Introduction
11.2 Asia-Pacific Offshore Drilling Market
11.2.1 Thailand Offshore Drilling Market
11.2.2 China Offshore Drilling Market
11.3 North America Offshore Drilling Market
11.3.1 U.S. Offshore Drilling Market
11.3.2 Mexico Offshore Drilling Market
11.4 Europe Offshore Drilling Market
11.4.1 Norway Offshore Drilling Market
11.4.2 U.K. Offshore Drilling Market
11.5 Middle East Offshore Drilling Market
11.5.1 Uae Offshore Drilling Market
11.5.2 Saudi Arabia Offshore Drilling Market
11.6 South America Offshore Drilling Market
11.6.1 Brazil Offshore Drilling Market
11.6.2 Venezuela Offshore Drilling Market
11.7 Africa Offshore Drilling Market
11.7.1 Angola Offshore Drilling Market
11.7.2 Nigeria Offshore Drilling Market
12 Competitive Landscape (Page No. - 134)
12.1 Overview
12.2 Competitive Situation & Trends
12.3 Contracts & Agreements
12.4 New Product/Service/Technology Launch
12.5 Mergers & Acquisitions
12.6 Expansion
12.7 Other Developments
13 Company Profiles (Page No. - 144)
13.1 Introduction
13.2 Halliburton Company
13.2.1 Business Overview
13.2.2 Products & Services
13.2.3 Developments, 2012-2015
13.2.4 SWOT Analysis
13.2.5 MnM View
13.3 Schlumberger Limited
13.3.1 Business Overview
13.3.2 Products & Services
13.3.3 Developments, 2012-2015
13.3.4 SWOT Analysis
13.3.5 MnM View
13.4 Seadrill Limited
13.4.1 Business Overview
13.4.2 Products & Services
13.4.3 Developments, 2012-2015
13.4.4 SWOT Analysis
13.4.5 MnM View
13.5 Transocean Ltd.
13.5.1 Business Overview
13.5.2 Products & Services
13.5.3 Developments, 2012-2015
13.5.4 SWOT Analysis
13.5.5 MnM View
13.6 Weatherford International Ltd
13.6.1 Business Overview
13.6.2 Products & Services
13.6.3 Developments, 2012-2015
13.6.4 SWOT Analysis
13.6.5 MnM View
13.7 Atwoods Oceanics
13.7.1 Business Overview
13.7.2 Products & Services
13.7.3 Developments, 2012-2014
13.8 Baker Hughes Incorporated
13.8.1 Business Overview
13.8.2 Products & Services
13.8.3 Developments, 2012-2014
13.9 China Oilfield Services Limited
13.9.1 Business Overview
13.9.2 Products & Services
13.9.3 Developments, 2012-2015
13.10 Diamond Offshore Drilling Inc.
13.10.1 Business Overview
13.10.2 Products & Services
13.10.3 Developments, 2012-2013
13.11 Dolphin Drilling
13.11.1 Business Overview
13.11.2 Products & Services
13.11.3 Developments, 2013
13.12 Ensco PLC.
13.12.1 Business Overview
13.12.2 Products & Services
13.12.3 Developments, 2012-2015
13.13 KCA Deutag
13.13.1 Business Overview
13.13.2 Products & Services
13.13.3 Developments, 2012-2014
13.14 Maersk Drilling
13.14.1 Business Overview
13.14.2 Products & Services
13.14.3 Developments, 2012-2015
13.15 Nabors Industries Ltd
13.15.1 Business Overview
13.15.2 Products & Services
13.15.3 Developments, 2013-2014
13.16 Noble Corporation
13.16.1 Business Overview
13.16.2 Products & Services
13.16.3 Developments, 2012-2014
13.17 Paragon Offshore PLC.
13.17.1 Business Overview
13.17.2 Products & Services
13.17.3 Developments, 2014
13.18 Scientific Drilling International
13.18.1 Business Overview
13.18.2 Products & Services
13.18.3 Developments, 2013-2015
13.19 Superior Energy Services
13.19.1 Business Overview
13.19.2 Products & Services
13.19.3 Developments, 2012-2014
14 Appendix (Page No. - 193)
14.1 Insights of Industry Experts
14.2 Discussion Guide
14.3 Other Developments, 2012-2014
14.4 Introducing RT: Real Time Market Intelligence
14.5 Available Customizations
14.6 Related Reports
List of Tables (127 Tables)
Table 1 Consumption of Crude Oil, By Region , 2010-2014 (Million Tonnes)
Table 2 Production of Crude Oil, By Region , 2010-2014 ( Million Tonnes)
Table 3 Consumption of Natural Gas, By Region , 2010-2014 ( Million Tonnes)
Table 4 Production of Natural Gas, By Region , 2010-2014 ( Million Tonnes)
Table 5 Impact of Market Dynamics
Table 6 Offshore Wells Drilled, By Regions, 2012�2014
Table 7 Asia-Pacific: Offshore Wells Drilled, By Countries, 2012�2014
Table 8 Europe: Offshore Wells Drilled, By Countries, 2012�2014
Table 9 Middle East: Offshore Wells Drilled, By Countries, 2012�2014
Table 10 Africa: Offshore Wells Drilled, By Countries, 2012�2014
Table 11 North America: Offshore Wells Drilled, By Countries, 2012�2014
Table 12 South America: Offshore Wells Drilled, By Countries, 2012�2014
Table 13 Us Gulf of Mexico: Mobile Offshore Drilling Rig Count, 2012�2015
Table 14 West Africa/Mediterranean: Mobile Offshore Drilling Rig Count, 2012�2015
Table 15 North Sea: Mobile Offshore Drilling Rig Count, 2012�2015
Table 16 Middle East: Mobile Offshore Drilling Rig Count, 2012�2014
Table 17 South East Asia/India: Mobile Offshore Drilling Rig Count, 2012�2015
Table 18 South America: Mobile Offshore Drilling Rig Count, 2012�2015
Table 19 Mexico: Mobile Offshore Drilling Rig Count, 2012�2015
Table 20 Others: Mobile Offshore Drilling Rig Count, 2012�2015
Table 21 Offshore Rig Count, By Company and Type, 2015
Table 22 Jackup Newbuilds, By Company, 2014�2017+
Table 23 Floater Newbuilds, By Company, 2014�2017+
Table 24 Jackup Newbuild Deliveries, 2014�2017+
Table 25 Jackup Newbuild Deliveries, 2014
Table 26 Jackup Newbuild Deliveries, 2015
Table 27 Jackup Newbuild Deliveries, 2016+
Table 28 Global Drillship Newbuild Deliveries, 2014�2017+
Table 29 Drillship Newbuild Deliveries, 2014
Table 30 Drillship Newbuild Deliveries, 2015
Table 31 Drillship Newbuild Deliveries, 2016
Table 32 Drillship Newbuild Deliveries, 2017+
Table 33 Semi-Submersibles Newbuild Deliveries, 2014�2017+
Table 34 Semi-Submersibles Newbuild Deliveries, 2014
Table 35 Semisubmersibles Newbuild Deliveries, 2015
Table 36 Semi-Submersibles Newbuild Deliveries, 2016
Table 37 Semi-Submersibles Newbuild Deliveries, 2017
Table 38 Offshore Rig Utilization Rate, By Type, Aug 2015�Oct 2015
Table 39 Jackup Day Rate, Q2 2015�Q1 2017 (Thousand USD Per Day)
Table 40 Floater Day Rate, Q2 2015�Q1 2017 (Thousand USD Per Day)
Table 41 Offshore Drilling Market Size, By Service, 2013-2020 (USD Million)
Table 42 Offshore Contract Drilling Market Size, By Region, 2013-2020 (USD Million)
Table 43 Offshore Contract Drilling Market Size, By Application, 2013-2020 (USD Million)
Table 44 Offshore Directional Drilling Market Size, By Region, 2013-2020 (USD Million)
Table 45 Offshore Directional Drilling Market Size, By Application, 2013-2020 (USD Million)
Table 46 Offshore Logging While Drilling Market Size, By Region, 2013-2020 (USD Million)
Table 47 Offshore Logging While Drilling Market Size, By Application, 2013-2020 (USD Million)
Table 48 Offshore Measurement While Drilling Market Size, By Region, 2013-2020 (USD Million)
Table 49 Offshore Measurement While Drilling Market Size, By Application, 2013-2020 (USD Million)
Table 50 Offshore Drilling Market Size, By Application, 2013-2020 (USD Million)
Table 51 Shallow Water Drilling Market Size, By Region, 2013-2020 (USD Million)
Table 52 Shallow Water Drilling Market Size, By Service, 2013-2020 (USD Million)
Table 53 Deepwater Drilling Market Size, By Region, 2013-2020 (USD Million)
Table 54 Deepwater Drilling Market Size, By Service, 2013-2020 (USD Million)
Table 55 Ultra-Deepwater Drilling Market Size, By Region, 2013-2020 (USD Million)
Table 56 Ultra-Deepwater Drilling Market Size, By Service, 2013-2020 (USD Million)
Table 57 Offshore Drilling Market Size, By Region, 2013-2020 (USD Million)
Table 58 Asia-Pacific: Offshore Drilling Market Size, By Service, 2013-2020 (USD Million)
Table 59 Asia-Pacific: Offshore Drilling Market Size, By Application, 2013-2020 (USD Million)
Table 60 Asia-Pacific: Offshore Drilling Market Size, By Country, 2013-2020 (USD Million)
Table 61 Thailand: Offshore Drilling Market Size, By Service, 2013-2020 (USD Million)
Table 62 Thailand: Offshore Drilling Market Size, By Application, 2013-2020 (USD Million)
Table 63 China: Offshore Drilling Market Size, By Service, 2013-2020 (USD Million)
Table 64 China: Offshore Drilling Market Size, By Application, 2013-2020 (USD Million)
Table 65 North America: Offshore Drilling Market Size, By Service, 2013-2020 (USD Million)
Table 66 North America: Offshore Drilling Market Size, By Application, 2013-2020 (USD Million)
Table 67 North America: Offshore Drilling Market Size, By Country, 2013-2020 (USD Million)
Table 68 U.S.: Offshore Drilling Market Size, By Service, 2013-2020 (USD Million)
Table 69 U.S.: Offshore Drilling Market Size, By Application, 2013-2020 (USD Million)
Table 70 Mexico: Offshore Drilling Market Size, By Service, 2013-2020 (USD Million)
Table 71 Mexico: Offshore Drilling Market Size, By Application, 2013-2020 (USD Million)
Table 72 Europe: Offshore Drilling Market Size, By Service, 2013-2020 (USD Million)
Table 73 Europe: Offshore Drilling Market Size, By Application, 2013-2020 (USD Million)
Table 74 Europe: Offshore Drilling Market Size, By Country, 2013-2020 (USD Million)
Table 75 Norway: Offshore Drilling Market Size, By Service, 2013-2020 (USD Million)
Table 76 Norway: Offshore Drilling Market Size, By Application, 2013-2020 (USD Million)
Table 77 U.K.: Offshore Drilling Market Size, By Service, 2013-2020 (USD Million)
Table 78 U.K.: Offshore Drilling Market Size, By Application, 2013-2020 (USD Million)
Table 79 Middle East: Offshore Drilling Market Size, By Service, 2013-2020 (USD Million)
Table 80 Middle East: Offshore Drilling Market Size, By Application, 2013-2020 (USD Million)
Table 81 Middle East: Offshore Drilling Market Size, By Country, 2013-2020 (USD Million)
Table 82 Uae: Offshore Drilling Market Size, By Service, 2013-2020 (USD Million)
Table 83 Saudi Arabia: Offshore Drilling Market Size, By Application, 2013-2020 (USD Million)
Table 84 Saudi Arabia: Offshore Drilling Market Size, By Service, 2013-2020 (USD Million)
Table 85 Saudi Arabia: Offshore Drilling Market Size, By Application, 2013-2020 (USD Million)
Table 86 South America: Offshore Drilling Market Size, By Service, 2013-2020 (USD Million)
Table 87 South America: Offshore Drilling Market Size, By Application, 2013-2020 (USD Million)
Table 88 South America: Offshore Drilling Market Size, By Country, 2013-2020 (USD Million)
Table 89 Brazil: Offshore Drilling Market Size, By Service, 2013-2020 (USD Million)
Table 90 Brazil: Offshore Drilling Market Size, By Application, 2013-2020 (USD Million)
Table 91 Venezuela: Offshore Drilling Market Size, By Service, 2013-2020 (USD Million)
Table 92 Venezuela: Offshore Drilling Market Size, By Application, 2013-2020 (USD Million)
Table 93 Africa: Offshore Drilling Market Size, By Service, 2013-2020 (USD Million)
Table 94 Africa: Offshore Drilling Market Size, By Application, 2013-2020 (USD Million)
Table 95 Africa: Offshore Drilling Market Size, By Country, 2013-2020 (USD Million)
Table 96 Angola: Offshore Drilling Market Size, By Service, 2013-2020 (USD Million)
Table 97 Angola: Offshore Drilling Market Size, By Application, 2013-2020 (USD Million)
Table 98 Nigeria: Offshore Drilling Market Size, By Service, 2013-2020 (USD Million)
Table 99 Nigeria: Offshore Drilling Market Size, By Application, 2013-2020 (USD Million)
Table 100 Contracts & Agreements, 2012-2015
Table 101 New Product Developments, 2012-2015
Table 102 Mergers & Acquisitions, 2012-2015
Table 103 Expansions, 2012-2015
Table 104 Other Developments, 2012-2015
Table 105 Products & Services
Table 106 Products & Services
Table 107 Seadrill Limited.: Products & Services
Table 108 Transocean Limited: Products & Services
Table 109 Weatherford International Ltd.: Products & Services
Table 110 Atwoods Oceanics: Products & Services
Table 111 Baker Hughes: Products & Services
Table 112 China Oilfield Services Limited: Products & Services
Table 113 Diamond Offshore Drilling Inc.: Products & Services
Table 114 Dolphin Drilling: Products & Services
Table 115 Ensco PLC. : Products & Services
Table 116 KCA Deutag: Products & Services
Table 117 Maersk Drilling: Products & Services
Table 118 Nabors Industries Ltd: Products & Services
Table 119 Noble Corporation: Products & Services
Table 120 Paragon Offshore PLC..: Products & Services
Table 121 Scientific Drilling International: Products & Services
Table 122 Superior Energy Services: Products & Services
Table 123 Mergers & Acquisitions
Table 124 Contracts & Agreements
Table 125 Joint Ventures/Partnerships
Table 126 New Product/ Service Launch
Table 127 Expansions
List of Figures (51 Figures)
Figure 1 Research Design: Offshore Drilling Market
Figure 2 Bottom-Up Approach
Figure 3 Top-Down Approach
Figure 4 Assumptions of the Research Study
Figure 5 Limitations of the Research Study
Figure 6 Shallow-Water Application Accounted for the Largest Market Share (Value) in Asia-Pacific in 2014
Figure 7 Offshore Drilling Market, By Application, During the Forecast Period
Figure 8 Europe & Asia-Pacific Expected to Dominate the Offshore Contract Drilling Services Market During the Forecast Period
Figure 9 Shallow Water Drilling Market, By Services, 2015-2020 (USD Million)
Figure 10 Increase in Oil & Gas Production From North America & Opec Nations to Create Growth in Offshore Drilling Market
Figure 11 Asia-Pacific is Expected to Account for A Major Share (By Value) of the Offshore Drilling Market During the Forecast Period
Figure 12 Shallow-Water Application Accounted for A Major Share (By Value) in the Offshore Drilling Market in 2014
Figure 13 Asia-Pacific Held Major Share in the Offshore Drilling Market, in 2014
Figure 14 Offshore Contract Drilling Services Estimated to Account for Largest Market Share (Value) in the Offshore Drilling Market By 2020
Figure 15 Offshore Drilling Market: Supply Chain Analysis
Figure 16 Porter�s Five Forces Analysis: Offshore Drilling Market
Figure 17 Brent Crude Oil Prices, (USD Per Barrel)
Figure 18 Regional Distribution of Undiscovered Arctic Region Oil Resources
Figure 19 Crude Oil & Natural Gas Reserves, By Regions, 2014
Figure 20 Offshore Oil Production, By Region, 2014 (Thousand Barrels Per Day)
Figure 21 Offshore Gas Production, By Region, 2014 (Billion Cubic Meters Per Day)
Figure 22 Offshore Drilling Market Share (Value), By Service, 2014
Figure 23 Offshore Drilling Market Share (Value), By Application, 2014
Figure 24 Offshore Drilling Market Share (Value), By Region, 2014
Figure 25 Companies Adopted Contracts & Agreements and New Product/Service/Technology Development to Capture the Markets
Figure 26 Market Evaluation Framework: Top Companies on the Basis of Market Share
Figure 27 Market Evaluation Framework: Top Companies on the Basis of Developments
Figure 28 Market Evaluation Framework: New Product Launches, Contracts & Agreements, and Mergers & Acquisitions Have Fuelled the Growth of Companies During 2012-2015
Figure 29 Region-Wise Revenue Mix of Top 5 Market Players
Figure 30 Halliburton Company: Company Snapshot
Figure 31 Halliburton Company: SWOT Analysis
Figure 32 Schlumberger Limited: Company Snapshot
Figure 33 Schlumberger: SWOT Analysis
Figure 34 Seadrill Limited: Company Snapshot
Figure 35 Transocean Ltd.: Company Snapshot
Figure 36 Transocean Ltd.: SWOT Analysis
Figure 37 Weatherford International Ltd.: Company Snapshot
Figure 38 Weatherford International Ltd.: SWOT Analysis
Figure 39 Atwoods Oceanics.: Company Snapshot
Figure 40 Baker Hughes Incorporated: Company Snapshot
Figure 41 China Oilfield Services Limited.: Company Snapshot
Figure 42 Diamond Offshore Drilling Inc.: Company Snapshot
Figure 43 Dolphin Drilling: Company Snapshot
Figure 44 Ensco PLC.: Company Snapshot
Figure 45 KCA Deutag: Company Snapshot
Figure 46 Maersk Drilling: Company Snapshot
Figure 47 Nabors Industries Ltd.: Company Snapshot
Figure 48 Noble Corporation: Company Snapshot
Figure 49 Paragon Offshore PLC.: Company Snapshot
Figure 50 Scientific Drilling International: Company Snapshot
Figure 51 Superior Energy Services Inc.: Company Snapshot


Growth opportunities and latent adjacency in Offshore Drilling Market