Offshore ROV Market by Type (Observation, Work, and Intervention), Depth (< 5,000, 5,000–10,000, and >10,000 Feet), Application (Completion, Construction, Repair & Maintenance, Design & Build, and Engineering), AUV, and Region - Global Forecast to 2023


[125 Pages Report] The global offshore ROV market was valued at USD 777.5 million in 2017 and is expected to grow at a CAGR of 3.27% during the forecast period, to reach USD 943.1 million by 2023. Offshore oil and gas discoveries in prominent countries and rise in demand for oil and gas are the major drivers that would trigger growth in the offshore ROV market.
The years considered for the study are as follows:
- Base Year: 2017
- Estimated Year: 2018
- Projected Year: 2023
- Forecast Period: 2018 to 2023
The base year considered for company profiles is 2017. Whenever information was unavailable for the base year, the prior year has been considered.
Objectives of the Study
- To define, describe, and forecast the global offshore ROV market by type, depth, application, and region
- To provide detailed information on major factors influencing the growth of the offshore ROV market (drivers, restraints, opportunities, and industry-specific challenges)
- To strategically analyze the offshore ROV market with respect to individual growth trends, future prospects, and contribution of each segment to the market
- To analyze market opportunities for stakeholders and details of a competitive landscape for market leaders
- To strategically profile key players and comprehensively analyze their market rankings and core competencies
- To track and analyze competitive developments, such as contracts & agreements, new product launches, mergers and acquisitions, and expansions and partnerships in the offshore ROV market
Research Methodology
This research study involved the use of extensive secondary sources, directories, and databases, such as Hoover’s, Bloomberg BusinessWeek, Factiva, and OneSource, to identify and collect information useful for a technical, market-oriented, and commercial study of the global offshore ROV market. Primary sources are mainly industry experts from core and related industries, OEMs, vendors, suppliers, technology developers, alliances, and organizations related to all the segments of this industry’s value chain. The points given below explain the research methodology.
- Study of the annual revenue and market developments of the major players providing offshore ROV
- Analysis of demand for offshore ROV by application
- Assessment of future trends and growth of applications in the offshore ROV market
- Assessment of the market with respect to type by various applications
- Study of market trends in various regions and countries, by application, of the market
- Study of contracts and developments related to the market by key players across different regions
- Finalization of overall market sizes by triangulating the supply-side data, which includes product developments and annual revenues of companies supplying offshore ROV across the globe
After arriving at the overall market size, the total market has been split into several segments and sub-segments. The figure given below illustrates the breakdown of primaries conducted during the research study on the basis of company type, designation, and region.
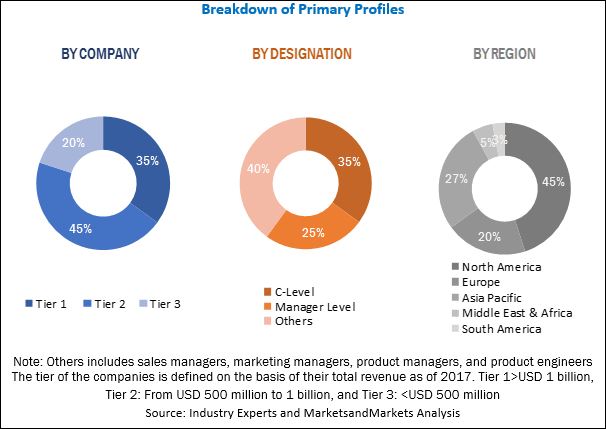
To know about the assumptions considered for the study, download the pdf brochure
Market Ecosystem:
The offshore ROV ecosystem comprises equipment manufacturers, such as Oceaneering (US), Subsea 7 (UK), Fugro (Netherlands), TechnipFMC (UK), Saipem (Italy), Forum (US), DOF (Norway), ECA (France), Deep Ocean Group (Norway), ISE (Canada), Deep Ocean Engineering (US), and AC-CESS (Scotland), among others.
Target Audience:
The target audience of this report includes:
- Oil & gas organizations
- Oil & gas rig operators
- Offshore ROV manufacturers
- Offshore ROV service companies
- Offshore ROV distributors and suppliers
- Governments, research organizations, and consulting companies
- Regional oil drilling companies
- Technology standards organizations, forums, alliances, and associations
- Venture capitalists, private equity firms, and start-up companies
Scope of the Report:
- By Type
- Observation Class
- Work Class
- Intervention Class
- By Depth
- Less than 5,000 Feet
- 5,000 to 10,000 Feet
- Above 10,000 Feet
- By Application
- Drilling and Well Completion Support
- Construction Support
- Inspection, Repair and Maintenance Services
- Remote Subsea Intervention Tooling Design and Build
- Subsea Engineering Services
- By Region
- Asia Pacific
- Europe
- North America
- South America
- Middle East & Africa
Available Customizations:
With the given market data, MarketsandMarkets offers customizations as per the client’s specific needs. The following customization options are available for this report:
Regional Analysis
Further breakdown of region or country-specific analysis
Company Information
Detailed analysis and profiling of additional market players (up to five)
The global offshore ROV market is estimated to be USD 802.9 million in 2018 and is projected to reach USD 943.1 million by 2023, growing at a CAGR of 3.27% from 2018 to 2023. Offshore oil and gas discoveries in prominent countries and rise in demand for oil and gas are driving the offshore ROV market globally.
The offshore ROV market has been segmented, by type, into Observation class, Work Class, and Intervention Class. The observation class segment is expected to be the largest because it can be used in all kinds of offshore applications for observing the process during drilling and completion work.
The offshore ROV market has been segmented, by depth, into Less than 5,000 feet, 5,000–10,000 feet, and Above 10,000 feet. The 5,000–10,000 feet segment is estimated to hold the largest share of the market during the forecast period. Operators are undertaking complicated offshore field development reserves in order to access marginal reserves in deep and ultra-deep water, particularly in the deep-water ‘Golden Triangle’ regions of Africa, Latin America, and North America.
The offshore ROV market has been segmented, by application, into Drilling and Well Completion Support, Construction Support, Inspection Repair & Maintenance Services, Remote Subsea Intervention Tooling Design and Build, and Subsea Engineering Services. The Drilling and Well Completion Support segment is estimated to hold the largest market share by 2023. The market growth in the segment is driven by the increase in deep water offshore activities in Angola and ultradeep water in Brazil.
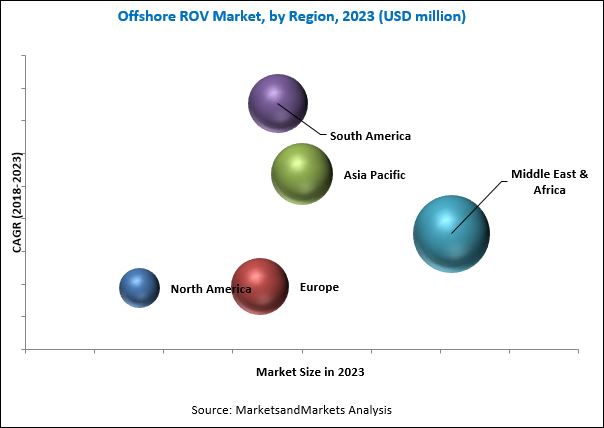
The offshore ROV market has been analyzed with respect to five regions, namely, Asia Pacific, Europe, North America, South America, and the Middle East & Africa. The Middle East & Africa is expected to dominate the offshore ROV market during the forecast period. The rise in offshore deep and ultradeep water activities is driving the offshore ROV market in the Middle East & Africa region.
High capital investments can restrain the growth of the offshore ROV market, particularly in the Asia Pacific region.
Some of the leading players in the offshore ROV market are Oceaneering (US), Subsea 7 (UK), Fugro (Netherlands), TechnipFMC (UK), Saipem (Italy), Forum (US), DOF (Norway), ECA (France), Deep Ocean Group (Norway), ISE (Canada), Deep Ocean Engineering (US), and AC-CESS (Scotland). Contracts and agreements is the most commonly adopted strategy by the leading players in the market from 2014 to 2018. It was followed by new product launches and expansions & partnerships.
To speak to our analyst for a discussion on the above findings, click Speak to Analyst
 Exclusive indicates content/data unique to MarketsandMarkets and not available with any competitors.
Table of Contents
1 Introduction (Page No. - 14)
1.1 Objectives of the Study
1.2 Market Definition
1.3 Market Scope
1.3.1 Markets Covered
1.3.2 Regional Scope
1.3.3 Years Considered for the Study
1.4 Currency
1.5 Stakeholders
2 Research Methodology (Page No. - 17)
2.1 Research Data
2.1.1 Secondary Data
2.1.1.1 Key Data From Secondary Sources
2.1.2 Primary Data
2.1.2.1 Key Data From Primary Sources
2.1.2.2 Key Industry Insights
2.1.2.3 Breakdown of Primary Interviews
2.2 Market Size Estimation
2.3 Market Breakdown and Data Triangulation
2.4 Research Assumptions
2.5 Limitations
3 Executive Summary (Page No. - 25)
4 Premium Insights (Page No. - 29)
4.1 Attractive Opportunities in the Offshore ROV Market
4.2 Market, By Type/Class
4.3 Market, By Application
4.4 Market, By Depth
4.5 Middle East & Africa: Market, By Country & Type/Class
4.6 Market, By Country
5 Market Overview (Page No. - 33)
5.1 Introduction
5.1.1 Drivers
5.1.1.1 Offshore Oil & Gas Discoveries in Prominent Countries
5.1.1.2 Rise in Demand for Oil & Gas
5.1.2 Restraints
5.1.2.1 Capital-Intensive Market
5.1.3 Opportunities
5.1.3.1 Arctic Discoveries
5.1.4 Challenges
5.1.4.1 High Operational Risk
5.1.4.2 Lack of Technical Expertise
5.2 Recent Trends
5.2.1 Automated ROV/Smart ROV
6 Offshore ROV Market, By Type/Class (Page No. - 38)
6.1 Introduction
6.2 Observation Class
6.3 Work Class
6.4 Intervention/Inspection Class
7 Offshore ROV Market, By Application (Page No. - 42)
7.1 Introduction
7.2 Drilling and Well Completion Support
7.3 Construction Support
7.4 Inspection, Repair, and Maintenance Service
7.5 Remote Subsea Intervention Tooling Design and Build
7.6 Subsea Engineering Services
8 Offshore ROV Market, By Depth (Page No. - 48)
8.1 Introduction
8.2 Less Than 5,000 Feet
8.3 5,000–10,000 Feet
8.4 Above 10,000 Feet
9 AUV Market, By Type (Page No. - 52)
9.1 Introduction
9.2 Small AUV (Depth Up to 100 M)
9.3 Medium AUV (Depth Up to 1,000 M)
9.4 Large AUV (Depth More Than 1,000 M)
10 Offshore ROV Market, By Region (Page No. - 55)
10.1 Introduction
10.2 Middle East & Africa
10.2.1 By Type/Class
10.2.2 By Application
10.2.3 By Depth
10.2.4 By Country
10.2.4.1 The Kingdom of Saudi Arabia
10.2.4.2 UAE
10.2.4.3 Angola
10.2.4.4 Qatar
10.2.4.5 Rest of Middle East & Africa
10.3 Europe
10.3.1 By Type/Class
10.3.2 By Application
10.3.3 By Depth
10.3.4 By Country
10.3.4.1 Norway
10.3.4.2 Uk
10.3.4.3 Russia
10.3.4.4 Rest of Europe
10.4 Asia Pacific
10.4.1 By Type/Class
10.4.2 By Application
10.4.3 By Depth
10.4.4 By Country
10.4.4.1 Thailand
10.4.4.2 China
10.4.4.3 India
10.4.4.4 Australia
10.4.4.5 Rest of Asia Pacific
10.5 South America
10.5.1 By Type/Class
10.5.2 By Application
10.5.3 By Depth
10.5.4 By Country
10.5.4.1 Brazil
10.5.4.2 Trinidad
10.5.4.3 Rest of South America
10.6 North America
10.6.1 By Type/Class
10.6.2 By Application
10.6.3 By Depth
10.6.4 By Country
10.6.4.1 US
10.6.4.2 Canada
10.6.4.3 Mexico
11 Competitive Landscape (Page No. - 84)
11.1 Introduction
11.2 Market Ranking Analysis
11.3 Competitive Scenario
11.3.1 New Product Launches
11.3.2 Contracts & Agreements
11.3.3 Others
12 Company Profiles (Page No. - 88)
12.1 Competitive Benchmarking
(Business Overview, Products Offered, Recent Developments, and MnM View)*
12.2 Oceaneering International
12.3 Subsea 7
12.4 Fugro
12.5 Technipfmc
12.6 Saipem
12.7 Forum Energy Technologies
12.8 DOF Subsea
12.9 ECA Group
12.10 Deepocean
12.11 International Submarine Engineering
12.12 Deep Ocean Engineering
12.13 Ac-Cess
*Details on Business Overview, Products Offered, Recent Developments, and MnM View Might Not Be Captured in Case of Unlisted Companies.
13 Appendix (Page No. - 117)
13.1 Insights From Industry Experts
13.2 Discussion Guide
13.3 Knowledge Store: Marketsandmarkets’ Subscription Portal
13.4 Introducing RT: Real-Time Market Intelligence
13.5 Available Customizations
13.6 Related Reports
13.7 Author Details
List of Tables (65 Tables)
Table 1 Offshore ROV Market Share Snapshot
Table 2 Offshore ROV Market Size, By Type/Class, 2016–2023 (USD Million)
Table 3 Observation Class: Market Size, By Region, 2016–2023 (USD Million)
Table 4 Work Class: Market Size, By Region, 2016–2023 (USD Million)
Table 5 Intervention/Inspection Class: Market Size, By Region, 2016–2023 (USD Million)
Table 6 Offshore ROV Market Size, By Application, 2016–2023 (USD Million)
Table 7 Drilling and Well Comletion Support: Market Size, By Region, 2016–2023 (USD Million)
Table 8 Construction Support: Market Size, By Region, 2016–2023 (USD Million)
Table 9 Inspection, Repair, and Maintenance Service: Market Size, By Region, 2016–2023 (USD Million)
Table 10 Remote Subsea Intervention Tooling Design and Build: Market Size, By Region, 2016–2023 (USD Million)
Table 11 Subsea Engineering Services: Market Size, By Region, 2016–2023 (USD Million)
Table 12 Offshore ROV Market Size, By Depth, 2016–2023 (USD Million)
Table 13 Less Than 5,000 Feet: Market Size, By Region, 2016–2023 (USD Million)
Table 14 5,000–10,000 Feet: Market Size, By Region, 2016–2023 (USD Million)
Table 15 Above 10,000 Feet: Market Size, By Region, 2016–2023 (USD Million)
Table 16 AUV Market Size, By Type, 2016–2023 (USD Million)
Table 17 Offshore ROV Market Size, By Region, 2016–2023 (USD Million)
Table 18 Offshore ROV and AUV Market Size, By Region, 2016–2023 (USD Million)
Table 19 Top Five Largest Countries: Offshore ROV Market Size, 2016–2023 (USD Million)
Table 20 Top Five Fastest Growing Countries: Market, 2016–2023 (USD Million)
Table 21 Largest Market in Every Region: Market Size, 2016–2023 (USD Million)
Table 22 Middle East & Africa: Offshore ROV Market Size, By Country, 2016–2023 (USD Million)
Table 23 Middle East & Africa: Market Size, By Type/Class, 2016–2023 (USD Million)
Table 24 Middle East & Africa: Market Size, By Application 2016–2023 (USD Million)
Table 25 Middle East & Africa: Market Size, By Depth, 2016–2023 (USD Million)
Table 26 The Kingdom of Saudi Arabia: Offshore ROV Market Size, By Type/Class, 2016–2023 (USD Million)
Table 27 UAE: Offshore ROV Market Size, By Type/Class, 2016–2023 (USD Million)
Table 28 Angola: Market Size, By Type/Class, 2016–2023 (USD Million)
Table 29 Qatar: Market Size, By Type/Class, 2016–2023 (USD Million)
Table 30 Rest of the Middle East & Africa: Offshore ROV Market Size, By Type/Class, 2016–2023 (USD Million)
Table 31 Europe: Offshore ROV Market Size, By Type/Class, 2016–2023 (USD Million)
Table 32 Europe: Market Size, By Application, 2016–2023 (USD Million)
Table 33 Europe: Market Size, By Depth, 2016–2023 (USD Million)
Table 34 Europe: Market Size, By Country,2016–2023 (USD Million)
Table 35 Norway: Offshore ROV Market Size, By Type/Class, 2016–2023 (USD Million)
Table 36 UK: Market Size, By Type/Class,2016–2023 (USD Million)
Table 37 Russia: Offshore ROV Market Size, By Type/Class, 2016–2023 (USD Million)
Table 38 Rest of Europe: Market Size, By Type/Class, 2016–2023 (USD Million)
Table 39 Asia Pacific: Offshore ROV Market Size, By Country, 2016–2023 (USD Million)
Table 40 Asia Pacific: Market Size, By Type/Class, 2016–2023 (USD Million)
Table 41 Asia Pacific: Market Size, By Application, 2016–2023 (USD Million)
Table 42 Asia Pacific: Market Size, By Depth, 2016–2023 (USD Million)
Table 43 Thailand: Offshore ROV Market Size, By Type/Class, 2016–2023 (USD Million)
Table 44 China: Market Size, By Type/Class, 2016–2023 (USD Million)
Table 45 India: Market Size, By Type/Class, 2016–2023 (USD Million)
Table 46 Australia: Market Size, By Type/Class, 2016–2023 (USD Million)
Table 47 Rest of Asia Pacific: Market Size, By Type/Class, 2016–2023 (USD Million)
Table 48 South America: Offshore ROV, By Type/Class, 2016–2023 (USD Million)
Table 49 South America: Market Size, By Application, 2016–2023 (USD Million)
Table 50 South America: Market Size, By Depth, 2016–2023 (USD Million)
Table 51 South America: Market Size, By Country, 2016–2023 (USD Million)
Table 52 Brazil: Offshore ROV Market Size, By Type/Class, 2016–2023 (USD Million)
Table 53 Trinidad: Market Size, By Type/Class, 2016–2023 (USD Million)
Table 54 Rest of Africa: Market Size, By Type/Class, 2016–2023 (USD Million)
Table 55 North America: Offshore ROV Market Size, By Type/Class, 2016–2023 (USD Million)
Table 56 North America: Market Size, By Application, 2016–2023 (USD Million)
Table 57 North America: Market Size, By Depth, 2016–2023 (USD Million)
Table 58 North America: Market Size, By Country, 2016–2023(USD Million)
Table 59 US: Market Size, By Type/Class, 2016–2023(USD Million)
Table 60 Canada: Market Size, By Type/Class, 2016–2023(USD Million)
Table 61 Mexico: Market Size, By Type/Class, 2016–2023(USD Million)
Table 62 Market Development Between 2015 and 2018
Table 63 New Product Launches, 2015–2018
Table 64 Contracts & Agreements, 2015–2018
Table 65 Others, 2015–2018
List of Figures (42 Figures)
Figure 1 Markets Covered: Market
Figure 2 Offshore ROV Market: Research Design
Figure 3 Breakdown of Primary Interviews: By Company Type, Designation, and Region
Figure 4 Bottom-Up Approach
Figure 5 Top-Down Approach
Figure 6 Data Triangulation
Figure 7 Observation Class Segment is Expected to Dominate the Market During the Forecast Period
Figure 8 Drilling and Well Completion Support Segment is Expected to Lead the Market During the Forecast Period
Figure 9 5,000–10,000 Feet Segment is Expected to Dominate the Market During the Forecast Period
Figure 10 The Middle East & Africa Led the Market in 2017
Figure 11 Increasing Offshore Oil & Gas Drilling and Exploration Activities Across the World is Driving the Market During the Forecast Period
Figure 12 Observation Class Segment is Expected to Grow at the Highest CAGR During the Forecast Period
Figure 13 Drilling and Well Completion Support Segment is Expected to Dominate the Market During the Forecast Period
Figure 14 5,000-10,000 Segment is Expected to Grow at the Highest CAGR During the Forecast Period
Figure 15 The Market in the Kingdom of Saudi Arabia Held the Largest Share of the Market in the Middle East & Africa in 2017
Figure 16 The Market in Brazil is Expected to Grow at the Highest CAGR During the Forecast Period
Figure 17 Offshore ROV: Drivers, Restraints, Opportunities, & Challenges
Figure 18 Energy Consumption By Region
Figure 19 Regional Distribution of Undiscovered Arctic Oil Resources, 2016
Figure 20 The Observation Class Segment is Expected to Dominate the Market During the Forecast Period
Figure 21 The Drilling and Well Completion Support Segment Led the Market in 2017
Figure 22 The 5,000–10,000 Feet Segment is Expected to Dominate the Market During the Forecast Period
Figure 23 AUV Market, By Type, 2017
Figure 24 Regional Snapshot: the Market in South America is Expected to Grow at the Highest CAGR During the Forecast Period
Figure 25 The Middle East & African Market is Expected to Be the Largest for the Market During the Forecast Period
Figure 26 The Middle East & African Market is Expected to Be the Largest for the Offshore ROV and AUV Market During the Forecast Period
Figure 27 Middle East & Africa Market Snapshot
Figure 28 The Kingdom of Saudi Arabia Led the Market in 2017
Figure 29 Asia Pacific Market Snapshot
Figure 30 Thailand: the Largest Market in Asia Pacific, 2017
Figure 31 Brazil is Expected to Hold the Largest Market Share in the South American Market
Figure 32 Key Developments in the Market, 2015–2018
Figure 33 Oceaneering Led the Market in 2017
Figure 34 Benchmarking of Top 6 Players
Figure 35 Oceaneering International: Company Snapshot
Figure 36 Subsea 7: Company Snapshot
Figure 37 Fugro: Company Snapshot
Figure 38 Technipfmc: Company Snapshot
Figure 39 Saipem: Company Snapshot
Figure 40 Forum Energy Technologies: Company Snapshot
Figure 41 DOF Subsea: Company Snapshot
Figure 42 ECA Group: Company Snapshot


Growth opportunities and latent adjacency in Offshore ROV Market