Oilseed Market and Grain Seed Market By Types (Oilseed and Grain Seed), Biotech Trait (Herbicide Tolerant, Insecticide Resistant, Other Stacked Trait) & Geography (North America, Europe, South America, Asia-Pacific & Rest Of The World) - Global Trends & Forecast To 2018


This report on oilseed market includes the market size of the global oilseed and grain seed in terms of value. The global oilseed and grain seed market is projected to reach $64,113.0 million by 2018. Because of the increase in demand for food, this market is growing at a CAGR of 12.0% during the period under review.
In terms of geographical distribution, the report is segmented into Asia-Pacific, Europe, North America, and Rest of the World (ROW) regions. This market is segmented for major countries from each region. North America was the largest oilseed market. More than 80.0% of the revenue in North America is generated by U.S. Latin America is the fastest growing region for this market with Brazil holding the maximum market share in 2012. Latin America was the largest producer of soybean in 2012. Asia-Pacific led the market for rice and cotton, and ROW for sorghum in 2012. China was the largest market in Asia-Pacific followed by India in 2012.
North America and Europe were major producers of corn, and oilseed and grain seed. The seed with trait is comprised of comprised herbicide resistance, insecticide resistance, and other staked seed. Herbicide resistant seed ruled the seed with trait market. U.S. was the largest market in terms of use of seed with trait. Other seed incorporated all conventionally stored and processed seed. Insect resistant is the second-most developed trait to protect crops. Genetic engineering is used to develop insect-resistant crop, currently. Other stacked trait included abiotic stress tolerance, disease resistance, modified quality pollination control systems, and several others.
Mosanto (U.S.), DuPont (U.S.), Syngenta (Switzerland), and Dow AgroSciences (U.S.) are considered the major players of oilseed market who are present in most of the parts of the world.
Oilseed market and grain seed market is considered to be fast growing crop segments of the agriculture market, due to the growing demand for food with increase in population. In response to end user�s demands for healthy and economical food products, farmers are adapting biotech-enhanced traits in seeds to boost yield more efficiently and effectively. Biotechnologically enhanced seeds are consequently seen as those products that can improve the return on investment and to respond to consumer demands for healthier agricultural products. Use of biotech seeds is spreading from developed countries and these seeds have furthered their global reach. The research & development divisions of major companies have developed a range of modified seeds so as to increase channeled production of crops of interest.
Oilseed & Grain Seed: Market Revenue & Share, By Geography, 2011 - 2018 ($Million)
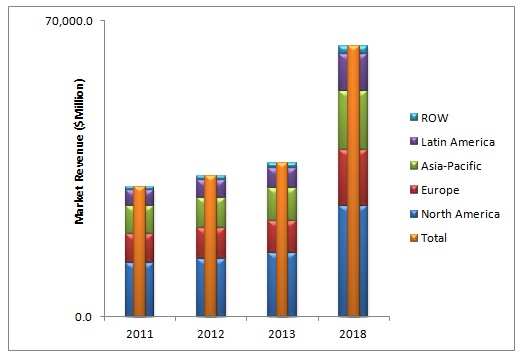
Source: Expert Interviews, Government Authorities, Related Associations/Institutes, Related Research Publication, Government Publication, Company Press Release, Company Annual Report, Company Website, Company Publication, MarketsandMarkets Analysis
The global oilseed market and grain seed market was $33,302.1 million in 2012 and is expected to reach $64,113.0 million by 2018, growing at a CAGR of 12.0% from 2013 to 2018. The global oilseed market and grain seed market was dominated by giant players like Monsanto (U.S.), DuPont (U.S.) and Syngenta (Switzerland) etc.
North American region is the largest market for oilseeds and grain seeds and continues to grow in near future. China, Brazil and India are also important countries for this market, and are adopting new technologies to grow faster. Corn controls the largest market share, followed by soybean, in terms of value.
The size of the overall market was derived using forecasting techniques based on seed types, share of biotech-enhanced seeds, area under crop production, and trade in various regions. The key players in the oilseed market and grain seed market were identified through secondary research and their market revenue was determined through primary and secondary research. It includes study of the annual reports of top market players and interviews with key opinion leaders such as CEOs, Directors, and marketing personnel.
 Exclusive indicates content/data unique to MarketsandMarkets and not available with any competitors.
- Table of Contents
1 Introduction (Page No. - 20)
1.1 Key Take-Aways
1.2 Report Description
1.3 Markets Covered
1.4 Research Methodology
1.4.1 Market Size
1.4.2 Key Data Points Taken From Secondary Sources
1.4.3 Key Data Points Taken From Primary Sources
1.4.4 Assumptions Made For This Report
1.4.5 Stake Holders
1.5 Key Questions Answered
- 2 Executive Summary (Page No. - 26)
- 3 Premium Insights (Page No. - 28)
3.1 Latin America: Fastest Growing Region
3.2 North America: Leading Oilseed Market & Grain Seed Market
3.3 U.S.: Largest Oilseed Market & Grain Seed Market
3.4 Corn: Largest Market Segment
3.5 Herbicide Tolerant Trait: Most Dominant Segment In Seed Trait
3.6 Mosanto: Most Dominating Company
3.7 Oilseed: Patent Analysis
3.8 Corn: Maximum Registered Patents
3.9 Grain Seed: Larger Market Share
3.10 Soybean: Largest Area Under Seed With Trait
4 Market Overview (Page No. - 38)
4.1 Introduction
4.2 Market Dynamics
4.2.1 Drivers
4.2.1.1 Shifting To R&D Investments
4.2.1.2 Decreasing Per Capita Farmland
4.2.1.3 Change In Farming Practices & Technology
4.2.1.4 Increased Crop Losses
4.2.1.5 Increased Farm Expenditure
4.2.1.6 High Returns On Investments With Certified Seed
4.2.2 Restrains
4.2.2.1 Duration Of New Plant Biotechnology Trait R&D Process
4.2.2.2 Reductions In Planting Rates
4.2.3 Opportunities
4.2.3.1 New Biotech Trait Seed To The Market
4.2.3.2 Growth In Developing Countries
4.3 Winning Imperative
4.3.1 Less Cost Of Bringing Product With New Biotech Trait To The Market
4.4 Market Share Analysis
4.5 Porter�s Five Forces Analysis
4.5.1 Supplier�s Power
4.5.2 Buyer�s Power
4.5.3 Threat Of Substitutes
4.5.4 Threat Of New Entrants
4.5.5 Degree Of Competition
4.6 Patent Analysis
- 5 Oilseed Market & Grain Seed Market, By Types (Page No. - 65)
5.1 Introduction
5.2 Oilseed
5.2.1 Soybean
5.2.2 Sunflower
5.2.3 Cotton
5.2.4 Rapeseed/Canola
5.3 Grains
5.3.1 Maize/Corn
5.3.2 Rice
5.3.3 Wheat
5.3.4 Sorghum
- 6 Oilseed Market & Grain Seed Market, By Biotech Trait (Page No. - 91)
6.1 Introduction
6.2 Seed With Biotech Trait
6.2.1 Herbicides Tolerant
6.2.2 Insecticide Resistant
6.2.3 Other Stacked Trait
6.2.3.1 Abiotic Stress Tolerance
6.2.3.2 Disease Resistance
6.2.3.3 Modified Product Quality
6.2.3.4 Pollination Control System
- 7 Oilseed Market & Grain Seed Market, By Geography (Page No. - 129)
7.1 Introduction
7.2 North America
7.2.1 U.S.
7.2.2 Canada
7.2.3 Mexico
7.3 Europe
7.3.1 France
7.3.2 Germany
7.3.3 Italy
7.3.4 Ukraine
7.3.5 Spain
7.4 Asia-Pacific
7.4.1 China
7.4.2 India
7.5 Latin America
7.5.1 Brazil
7.5.2 Argentina
- 8 Competitive Landscape (Page No. - 166)
8.1 Introduction
8.2 Agreements, Partnerships, Collaborations & Joint Ventures: Most Preferred Strategy
8.3 Key Market Strategies
8.4 Dupont, Dow Agro Sciences Mosanto & Syngenta: Most Active Companies
8.5 Swot Analysis
- 9 Company Profiles(Overview, Financials, Products & Services, Strategy, And Developments)* (Page No. - 205)
9.1 Bayer Cropscience AG
9.2 Burrus Seed Farm
9.3 Dow Agrosciences LLC
9.4 E.I. DU Pont Denemours And Company
9.5 Gansu Dunhuang Seed Co. Ltd
9.6 Hefei Fengle Seed Co. Ltd
9.7 Krishidhan Seeds Pvt. Ltd
9.8 KWS Saat AG
9.9 Land O�Lakes Inc.
9.10 Limagrain
9.11 Mahyco Seeds Company Limited
9.12 Monsanto
9.13 Nuziveedu Seeds Ltd
9.14 Rallis India Limited
9.15 Seed Co. Limited
9.16 Stine Seed Company
9.17 Syngenta AG
*Details On Overview, Financials, Product & Services, Strategy, And Developments Might Not Be Captured In Case Of Unlisted Companies.
- Appendix (Page No. - 293)
U.S. Patents
Europe Patents
Japan Patents
List of Tables (151 Tables)
Table 1 Oilseed Market & Grain Seed: Market Revenue, By Geography, 2011 - 2018 ($Million)
Table 2 Agrochemical Companies: R&D Expenditures,2011 ($Million)
Table 3 U.S: Farm Expenditures, 2007 Vs 2011 ($Million)
Table 4 GM Cotton Vs Non-GM Cotton
Table 5 Seed Companies: Input Traits, 2010 � 2011
Table 6 Oilseed & Its Applications
Table 7 Oilseed: Market Revenue, By Types, 2011 - 2018 ($Million)
Table 8 Oilseed Seed: Market Revenue, By Geography, 2011 - 2018 ($Million)
Table 9 Soybean Seed: Market Revenue, By Types, 2011 - 2018 ($Million)
Table 10 Soybean Seed: Market Revenue, By Geography, 2011 - 2018 ($Million)
Table 11 Soybean: Area Under Cultivation, 2009 - 2011 (000'ha)
Table 12 Sunflower Seed: Market Revenue, By Geography, 2011 - 2018 ($Million)
Table 13 Sunflower : Area Under Cultivation, 2009 - 2011 (000'ha)
Table 14 Cotton Seed: Market Revenue, By Types, 2011 - 2018 ($Million)
Table 15 Cotton Seed: Market Revenue, By Geography, 2011 - 2018 ($Million)
Table 16 Cotton: Area Under Cultivation, 2009 - 2011 (000'ha)
Table 17 Canola Seed: Market Revenue, By Types, 2011- 2018 ($Million)
Table 18 Canola Seed: Market Revenue, By Geography, 2011 - 2018 ($Million)
Table 19 Canola: Area Under Cultivation, 2009 - 2011 (000'ha)
Table 20 Grain Seed: Market Revenue, By Types, 2011 - 2018 ($Million)
Table 21 Grain Seed: Market Revenue, By Geography, 2011 - 2018 ($Million)
Table 22 Maize/Corn Seed: Market Revenue, By Geography, 2011 - 2018 ($Million)
Table 23 Maize/Corn: Area Under Cultivation, 2009 - 2011 (000'ha)
Table 24 Rice Seed: Market Revenue, By Geography, 2011 - 2018 ($Million)
Table 25 Rice: Area Under Cultivation, 2009 - 2011 (000'ha)
Table 26 Wheat Seed: Market Revenue, By Geography, 2011 - 2018 ($Million)
Table 27 Wheat: Area Under Cultivation, 2009 � 2011 (000'ha)
Table 28 Sorghum Seed: Market Revenue, By Geography, 2011 - 2018 ($Million)
Table 29 Sorghum: Area Under Cultivation, 2009 - 2011 (000'ha)
Table 30 Seed: Market Revenue, By Types, 2011 - 2018 ($Million)
Table 31 Seed With Trait: Market Revenue, By Crop, 2011 - 2018 ($Million)
Table 32 Area Under Seed With Trait, By Crop, 2011 - 2018 (Mn Ha)
Table 33 Seed With Trait: Market Revenue, By Crop Types, 2011 - 2018 ($Million)
Table 34 Area Under Seed With Trait, By Crop Types, 2011 - 2018 (Mn Ha)
Table 35 Seed With Trait: Market Revenue, By Geography, 2011 - 2018 ($Million)
Table 36 Area Under Seed With Trait, By Geography, 2011 - 2018 (Mn Ha)
Table 37 Seed With Trait: Market Revenue, By Traits, 2011 - 2018 ($Million)
Table 38 Area Under Seed With Trait, By Traits, 2011 - 2018 (MN HA)
Table 39 Trait: 2,4-D Herbicide Tolerant Seed Technical Information
Table 40 Trait: Dicamba Herbicide Tolerance Seed Technical Information
Table 41 Trait: Glufosinate Herbicide Tolerance Seed Technical Information
Table 42 Trait: Glyphosate Herbicide Tolerance Seed Technical Information
Table 43 Trait: Isoxaflutole Herbicide Tolerance Seed Technical Information
Table 44 Trait: Oxynil Herbicide Tolerance Seed Technical Information
Table 45 Trait: Sulfonylurea Herbicide Tolerance Seed Technical Information
Table 46 Commercial Trait: Herbicide Tolerance
Table 47 Trait: Coleopteran Insecticide Resistant Seed Technical Information
Table 48 Trait: Lepidopteran Insect Resistance Resistant Seed Technical Information
Table 49 Trait: Male Sterility Resistant Seed Technical Information
Table 50 Trait: Mannose Metabolism Resistant Seed Technical Information
Table 51 Trait: Multiple Insect Resistance Resistant Seed Technical Information
Table 52 Commercial Trait: Insect Resistance
Table 53 Trait: Anti-Allergy Stacked Seed Technical Information
Table 54 Trait: Antibiotic Resistance Stacked Seed Technical Information
Table 55 Trait: Delayed Fruit Softening Stacked Seed Technical Information
Table 56 Trait: Delayed Ripening/Senescence Stacked Seed Technical Information
Table 57 Trait: Drought Stress Tolerance Stacked Seed Technical Information
Table 58 Trait: Fertility Restoration Stacked Seed Technical Information
Table 59 Trait: Mannose Metabolism Stacked Seed Technical Information
Table 60 Trait: Modified Alpha Amylase Stacked Seed Technical Information
Table 61 Trait: Modified Amino Acid Stacked Seed Technical Information
Table 62 Trait: Modified Flower Color Stacked Seed Technical Information
Table 63 Trait: Modified Oil/Fatty Acid Stacked Seed Technical Information
Table 64 Trait: Modified Starch/Carbohydrate Stacked Seed Technical Information
Table 65 Trait: Nicotine Reduction Stacked Seed Technical Information
Table 66 Trait: Nopaline Synthesis Stacked Seed Technical Information
Table 67 Trait: Phytase Production Stacked Seed Technical Information
Table 68 Abiotic Stress Tolerant Seed Technical Information
Table 69 Trait: Viral Disease Resistance Seed Technical Information
Table 70 Trait: Visual Marker Disease Resistance Seed Technical Information
Table 71 Commercial Trait: Modified Product Quality
Table 72 Trait: Pollination Control System
Table 73 Oilseed & Grain Seed: Market Revenue, By Geography, 2011 - 2018 ($Million)
Table 74 North America: Oilseed & Grain Seed Market Revenue, By Countries, 2011 � 2018 ($Million)
Table 75 North America: Oilseed & Grain Seed Market Revenue, By Crop Types, 2011 - 2018 ($Million)
Table 76 U.S: Oilseed Market & Grain Seed Market Revenue, By Crop Types, 2011 - 2018 ($Million)
Table 77 U.S: Area Under Oilseed & Grain Crop 2009 - 2011 (000'ha)
Table 78 Canada: Oilseed Market & Grain Seed Market Revenue, By Crop Types, 2011 - 2018 ($Million)
Table 79 Canada: Area Under Major Oilseed & Grain Crop, 2009 - 2011 (000'ha)
Table 80 Mexico: Oilseed Market & Grain Seed Market Revenue, By Crop Types, 2011 - 2018 ($Million)
Table 81 Mexico: Area Under Major Oilseed & Grain Crop, 2009 - 2011 (000'ha)
Table 82 Europe: Oilseed Market & Grain Seed Market Revenue, By Countries, 2011 - 2018 ($Million)
Table 83 Europe: Oilseed Market & Grain Seed Market Revenue, By Crop Types, 2011 - 2018 ($Million)
Table 84 France: Oilseed Market & Grain Seed Market Revenue, By Crop Types, 2011 - 2018 ($Million)
Table 85 France: Area Under Oilseed & Grain Crop 2009 - 2011 (000'ha)
Table 86 Germany: Oilseed Market & Grain Seed Market Revenue, By Crop Types, 2011 - 2018 ($Million)
Table 87 Germany: Area Under Oilseed & Grain Crop 2009 - 2011 (000'ha)
Table 88 Italy: Oilseed Market & Grain Seed Market Revenue, By Crop Types, 2011 - 2018 ($Million)
Table 89 Italy: Area Under Oilseed & Grain Crop, 2009 - 2011 (000'ha)
Table 90 Ukraine: Oilseed Market & Grain Seed Market Revenue, By Crop Types, 2011 - 2018 ($Million)
Table 91 Ukraine: Area Under Oilseed & Grain Crop 2009 - 2011 (000'ha)
Table 92 Spain: Oilseed Market & Grain Seed Market Revenue, By Crop Types, 2011 - 2018 ($Million)
Table 93 Spain: Area Under Oilseed & Grain Crop 2009 - 2011 (000'ha)
Table 94 Asia-Pacific: Oilseed & Grain Seed Market Revenue, By Countries, 2011 � 2018 ($Million)
Table 95 Asia-Pacific: Oilseed And Grain Seed Market Revenue, By Crop Types, 2011 - 2018 ($Million)
Table 96 China: Oilseed & Grain Seed Market Revenue, By Crop Types, 2011 - 2018 ($Million)
Table 97 China: Area Under Oilseed & Grain Crop, 2009 - 2011 (000'ha)
Table 98 India: Oilseed And Grain Seed Market Revenue, By Crop Types, 2011 - 2018 ($Million)
Table 99 India: Area Under Oilseed & Grain Crop, 2009 - 2011 (000'ha)
Table 100 Latin America: Countries & Potential Arable Land
Table 101 Latin America: Oilseed & Grain Seed Market Revenue, By Countries, 2011 � 2018 ($Million)
Table 102 Latin America: Oilseed & Grain Seed Market Revenue, By Crop Types, 2011 - 2018 ($Million)
Table 103 Brazil: Oilseed & Grain Seed Market Revenue, By Crop Types, 2011 - 2018 ($Million)
Table 104 Brazil: Area Under Oilseed & Grain Crop 2009 - 2011 (000'ha)
Table 105 Argentina: Oilseed And Grain Seed Market Revenue, By Crop Types, 2011 - 2018 ($Million)
Table 106 Argentina: Area Under Oilseed & Grain Crop, 2009 - 2011 (000'ha)
Table 107 Swot Analysis: Top Market Players
Table 108 Mergers And Acquisitions, 2009 � 2013
Table 109 Agreements, Partnerships, Collaborations & Joint Ventures, 2009 � 2013
Table 110 New Product Launches, 2009 � 2013
Table 111 Investment, Expansion & Other Developments, 2009 � 2013
Table 112 Bayer Cropscience: Annual Revenue, By Business Segments, 2011 � 2012 ($Million)
Table 113 Bayer Cropscience: Annual Revenue, By Geography, 2011 � 2012 ($Million)
Table 114 Bayer Cropscience: Oilseeds & Grain Seed Products & Its Descriptions
Table 115 Burrus Seed Farm: Oilseed & Grain Seed Products & Its Descriptions
Table 116 dow Agrosciences: Annual Revenue, By Business Segments, 2011 � 2012 ($Million)
Table 117 dow Agrosciences: Oilseeds & Its Product Descriptions
Table 118 dow Agrosciences: Grain Seed Products & Its Descriptions
Table 119 Dupont: Annual Revenue, By Business Segments, 2011 � 2012 ($Million) 223
Table 120 Dupont: Annual Revenue, By Geography, 2011 - 2012 ($Million)
Table 121 Dupont: Oilseed Products & Its Descriptions
Table 122 Dupont: Grain Seed Products & Its Descriptions
Table 123 Gansu Dunhuang: Oilseed & Grain Seed Products & Its Descriptions
Table 124 Hefei Fengle Seed: Oilseed & Grain Seed Products & Its Descriptions
Table 125 Krishidhan: Oilseed Products & Its Descriptions
Table 126 Krishidhan: Grain Products & Its Descriptions
Table 127 KWS: Annual Revenue, By Business Segments, 2011 � 2012 ($Million)
Table 128 KWS: Annual Revenue, By Geography, 2011 - 2012 ($Million)
Table 129 KWS: Oilseed Products & Its Descriptions
Table 130 KWS: grain Products & Its descriptions
Table 131 Land O�Lakes: Annual Revenue, By Business Segments, 2011 � 2012 ($Million)
Table 132 Land O�Lakes: Oilseed Products & Its Descriptions
Table 133 Land O�Lakes: Grain Seed Products & Its Descriptions
Table 134 Limagrain: Annual Revenue, By Business Segments, 2011 � 2012 ($Million)
Table 135 Limagrain: Annual Revenue, By Geography, 2011 - 2012 ($Million)
Table 136 Limagrain: Oilseed & Grain Seed Products & Its Descriptions
Table 137 Mahyco: Oilseed Products & Its Descriptions
Table 138 Mahyco: Grain Products & Its Descriptions
Table 139 Monsanto: Annual Revenue, By Business Segments, 2011 � 2012 ($Million)
Table 140 Monsanto: Annual Revenue, By Geography, 2011 - 2012 ($Million)
Table 141 Monsanto: Oilseed Products & Its Descriptions
Table 142 Monsanto: Grain Products & Its Descriptions
Table 143 Nuziveed Seeds: Oilseed Products & Its Descriptions
Table 144 Nuziveed Seeds: Grain Seed Products & Its Descriptions
Table 145 Rallis India: Oilseed & Grain Seed Products & Its Descriptions
Table 146 Seed Co: Oilseed Products & Its Descriptions
Table 147 Seed Co: Grain Products & Its Descriptions
Table 148 Stine Seed: Products & Its Descriptions
Table 149 Syngenta: Annual Revenue, By Business Segments, 2011 � 2012 ($Million)
Table 150 Syngenta: Annual Revenue, By Geography, 2011 - 2012 ($Million)
Table 151 Syngenta: Oilseed & Grain Seed Products& Its Descriptions
List of Figures (29 Figures)
Figure 1 Oilseed & Grain Seed: Market Revenue, 2012 ($Million)
Figure 2 Oilseed & Grain Seed: Market Revenue,By Geography, 2012 ($Million)
Figure 3 Oilseed & Grain Seed: Market Revenue, By Countries, 2012($Million)
Figure 4 Oilseed & Grain Seed: Market Revenue, By Geography, By Crop, 2012 ($Million)
Figure 5 Oilseed & Grain Seed: Market Revenue, By Trait, 2012 ($Million)
Figure 6 Oilseed & Grain Seed: Patent Analysis, By Crop & By Comapnies, 2012
Figure 7 Oilseed: Patents Analysis, By Companies, 2009 - 2013
Figure 8 Grain Seed: Patents Registration Trends, By Companies, 2009 � 2013
Figure 9 Oilseed & Grain Seed: Market Share, By Countries, 2012
Figure 10 Area Under Seed With Trait, By Crop, 2012 - 2018 (Mn Ha)
Figure 11 Global Oilseed & Grain Seed Market, By Segments
Figure 12 Impact Analysis: Drivers & Restrains
Figure 13 Arable Land, 1950 � 2020 (Ha/Person)
Figure 14 Cost Of Bringing A New Product To The Market
Figure 15 Oilseed & Grain Seed: Market Share Analysis, 2011
Figure 16 Porter�s Five Forces Analysis
Figure 17 Patent Analysis, By Regions/Country, 2009 � 2013
Figure 18 Patent Analysis, By Year & By Country, 2009 � 2013
Figure 19 Patent Analysis, By Crop, 2009 � 2013
Figure 20 Canola: Patent Analysis, By Companies, 2009 � 2013
Figure 21 Corn: Patent Analysis, By Companies, 2009 � 2013
Figure 22 Cotton: Patent Analysis, By Companies, 2009 � 2013
Figure 23 Rice: Patent Analysis, By Companies, 2009 � 2013
Figure 24 Soybean: Patent Analysis, By Companies, 2009 � 2013
Figure 25 Sunflower: Patent Analysis, By Companies, 2009 � 2013
Figure 26 Wheat: Patent Analysis, By Companies, 2009 � 2013
Figure 27 Oilseed & Grain Seeds: Market Growth Strategies, 2009 � 2013
Figure 28 Oilseed & Grain Seeds: Market Development Strategies, 2009 � 2013
Figure 29 Oilseed & Grain Seed: Growth Strategies, By Companies, 2009 � 2013


Growth opportunities and latent adjacency in Oilseed Market