Opaque Polymers Market by Type (Solid Content 30% and Solid Content 40%), Application (Paints & Coatings, Personal Care, and Detergents), and Region (North America, Europe, Asia Pacific, Middle East & Africa, and South America) - Global Forecast to 2022


[118 Pages Report] Opaque Polymers Market size was valued at USD 1.52 Billion in 2016 and is projected to reach USD 2.82 Billion by 2022, at a CAGR of 10.7% from 2017 to 2022. This market has been segmented on the basis of type, application, and region. Based on type, the opaque polymers market has been segmented into solid content 30% and solid content 40%. Based on application, the market has been segmented into paints & coatings, personal care, and detergents. Based on region, the market has been segmented into Asia Pacific, North America, Europe, South America, and the Middle East & Africa. The base year considered for the study is 2016 and forecast period is between 2017 and 2022.
Objectives of the Study:
- To define, describe, and forecast the opaque polymers market on the basis of type, application, and region
- To provide detailed information regarding key factors, such as drivers, restraints, opportunities, and challenges, influencing the growth of the market
- To strategically analyze micromarkets with respect to individual growth trends, future prospects, and contribution to the total market
- To analyze opportunities in the market for stakeholders and provide details of a competitive landscape for market leaders
- To strategically profile key players and comprehensively analyze their market shares and core competencies
Both top-down and bottom-up approaches were used to estimate and validate the size of the opaque polymers market and estimate the sizes of various other dependent submarkets. The research study involved the extensive use of secondary sources, directories, and databases such as Hoovers, Bloomberg, Factiva, Securities and Exchange Commission (SEC), and American National Standards Institute (ANSI) to identify and collect information useful for the technical, market-oriented, and commercial study of the opaque polymers market.
To know about the assumptions considered for the study, download the pdf brochure
�This study answers several questions for various market players across the value chain, primarily which market segments to focus in the next two to five years for prioritizing the efforts and investments.�
Key players operating in the opaque polymers market include The Dow Chemical Company (US), Arkema (France), Ashland (US), Interpolymer Corporation (US), Organik Kimya (Turkey), and Hankuck Latices (South Korea).
Key Target Audience:
- Manufacturers of Opaque Polymers
- Traders, Distributors, and Suppliers of Opaque Polymers
- Regional Manufacturers Associations and General Chemical Associations
- Government & Regional Agencies and Research Organizations
- Investment Research Firms
Scope of the report:
This research report categorizes the opaque polymers market on the basis of type, application, and region.
On the basis of Type:
- Solid Content 30%
- Solid Content 40%
On the basis of Application:
- Paints & Coatings
- Personal Care
- Detergents
On the basis of Region:
- North America
- Asia Pacific
- Europe
- South America
- Middle East & Africa
The market is further analyzed on the basis of key countries in each of these regions.
Available Customizations:
With the given market data, MarketsandMarkets offers customizations according to the specific needs of the company. The following customization options are available for the report:
Regional Analysis:
- Country-level analysis of the opaque polymers market
Company Information:
- Detailed analysis and profiling of additional market players
The opaque polymers market is projected to grow from USD 1.70 Billion in 2017 to USD 2.82 Billion by 2022, at a CAGR of 10.7% during the forecast period. This growth is primarily driven by an increase in the prices of TiO2 pigments and rise in demand for decorative and architectural paints & coatings. Styrene acrylic-based opaque polymers are increasingly preferred for the development of paints & coatings. The increasing demand for decorative and architectural paints in the construction industry is further driving the growth of the opaque polymers market. The consumption of opaque polymers in both, developed and emerging countries, has been increasing in recent years.
The opaque polymers market has been segmented on the basis of type into solid content 30% and solid content 40%. The solid content 30% segment accounted for the largest share of 65.2% of the opaque polymers market in 2016, in terms of volume. Moreover, solid content 30% is the fastest-growing type segment of the opaque polymers market. This growth can be attributed to the high demand for solid content 30% opaque polymers in the paints & coatings application, owing to the increased drying time of these polymers. In addition, solid content 40% opaque polymers are used in detergents and personal care product formulations.
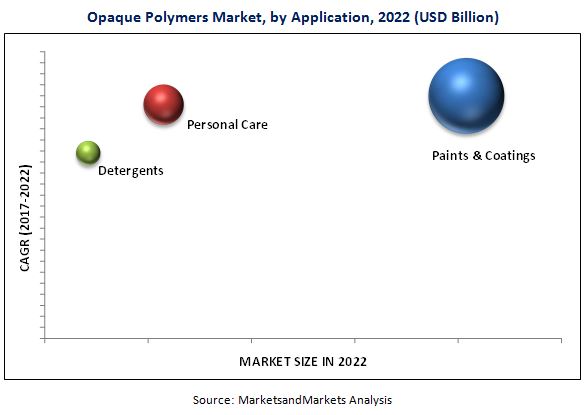
Based on application, the opaque polymers market has been segmented into paints & coatings, personal care, and detergents. The paints & coatings application segment accounted for the largest share of the opaque polymers market in 2016. This application segment is projected to grow at the highest CAGR during the forecast period both, in terms of value and volume. The rising demand for decorative paints in the construction industry is driving the growth of the opaque polymers market in paints & coatings application.
Asia Pacific, North America, Europe, South America, and the Middle East & Africa are considered as key regions in the opaque polymers market. Asia Pacific is the largest market for opaque polymers. Economic development in Asia Pacific countries and increased investments in the construction and personal care industries are key factors projected to drive the growth of the opaque polymers market in this region. The opaque polymers market in China, India, the US, and Brazil are also witnessing growth, owing to the increasing construction activity in these countries. However, lower performance of opaque polymers as compared to TiO2 pigments in manufacturing industrial paints is acting as a restraint to the growth of the opaque polymers market.
Key players operating in the opaque polymers market include The Dow Chemical Company (US), Arkema (France), Ashland (US), Interpolymer Corporation (US), and Organik Kimya (Turkey). These players are focused on the adoption of key growth strategies such as expansions, new product launches, acquisitions, and joint ventures to strengthen their market position and widen their customer base. For instance, in 2016, The Dow Chemical Company (US) established a polymer manufacturing facility in Saudi Arabia to enhance its regional presence in the opaque polymers market. Moreover, in 2017, the company merged with DuPont (US) to cater to the increased demand for opaque polymers from the construction industry. Such worthy developments undertaken by companies have contributed to the growth of the opaque polymers market.
To speak to our analyst for a discussion on the above findings, click Speak to Analyst
 Exclusive indicates content/data unique to MarketsandMarkets and not available with any competitors.
Table of Contents
1 Introduction (Page No. - 13)
1.1 Objectives of the Study
1.2 Market Definition
1.3 Market Scope
1.3.1 Years Considered for the Study
1.4 Currency
1.5 Units Considered
1.6 Stakeholders
2 Research Methodology (Page No. - 16)
2.1 Research Data
2.1.1 Secondary Data
2.1.1.1 Key Data From Secondary Sources
2.1.2 Primary Data
2.1.2.1 Key Data From Primary Sources
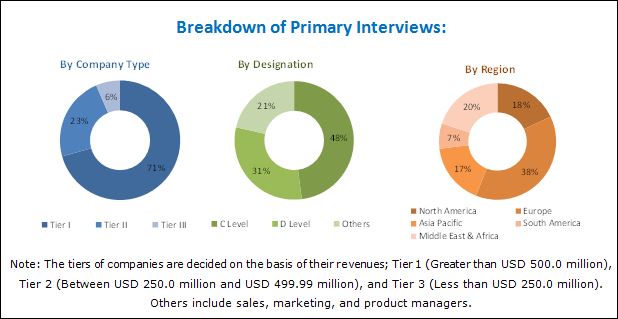
2.1.2.2 Breakdown of Primary Interviews
2.2 Market Size Estimation
2.2.1 Bottom-Up Approach
2.2.2 Top-Down Approach
2.3 Data Triangulation
2.4 Assumptions
3 Executive Summary (Page No. - 24)
4 Premium Insights (Page No. - 28)
4.1 Significant Opportunities in the Opaque Polymers Market
4.2 Opaque Polymers Market, By Application
4.3 Opaque Polymers Market in APAC, By Type, and Country
4.4 Opaque Polymers Market Size, By Country
5 Market Overview (Page No. - 31)
5.1 Introduction
5.2 Market Dynamics
5.2.1 Drivers
5.2.1.1 Increasing Prices of TIO2
5.2.1.2 Growing Demand in Construction Industry for Architectural Paints
5.2.2 Restraints
5.2.2.1 Lower Hiding Performance Than TIO2
5.2.3 Opportunities
5.2.3.1 Improvement in the Performance Efficiency to Make Them Suitable for Industrial Paint Formulations
5.2.4 Challenges
5.2.4.1 Fluctuation in the Prices of Raw Materials
5.3 Porter�s Five Forces Analysis
5.3.1 Threat of New Entrants
5.3.2 Threat of Substitutes
5.3.3 Bargaining Power of Suppliers
5.3.4 Bargaining Power of Buyers
5.3.5 Intensity of Competitive Rivalry
6 Macroeconomic Overview (Page No. - 37)
6.1 Introduction
6.2 Trends and Forecast of GDP
6.3 Trends and Forecast of the Paints & Coatings Industry
6.3.1 Trends and Forecast of the Paints & Coatings Industry in North America
6.3.2 Trends and Forecast of the Paints & Coatings Industry in Europe
6.3.3 Trends and Forecast of the Paints & Coatings Industry in APAC
6.3.4 Trends and Forecast of the Paints & Coatings Industry in Middle East & Africa
7 Opaque Polymers Market, By Type (Page No. - 43)
7.1 Introduction
7.2 Solid Content 30%
7.3 Solid Content 40%
8 Opaque Polymers Market, By Application (Page No. - 46)
8.1 Introduction
8.2 Paints & Coatings
8.3 Personal Care
8.4 Detergents
9 Opaque Polymers Market, By Region (Page No. - 50)
9.1 Introduction
9.2 North America
9.2.1 US
9.2.2 Canada
9.2.3 Mexico
9.3 Europe
9.3.1 Russia
9.3.2 Germany
9.3.3 UK
9.3.4 Italy
9.3.5 France
9.3.6 Rest of Europe
9.4 APAC
9.4.1 China
9.4.2 India
9.4.3 South Korea
9.4.4 Japan
9.4.5 Rest of APAC
9.5 Middle East & Africa
9.5.1 Saudi Arabia
9.5.2 South Africa
9.5.3 Rest of Middle East & Africa
9.6 South America
9.6.1 Brazil
9.6.2 Rest of South America
10 Competitive Landscape (Page No. - 90)
10.1 Overview
10.2 Market Ranking of Key Players
10.3 Competitive Situations and Trends
10.3.1 Mergers, Joint Ventures, and Acquisitions
10.3.2 New Product Launches
11 Company Profiles (Page No. - 94)
(Business Overview, Products Offered, Recent Developments, MnM View, SWOT Analysis)*
11.1 The DOW Chemical Company
11.2 Arkema
11.3 Ashland Global Holdings Inc.
11.4 Interpolymer Corporation
11.5 Organik Kimya A.S.
11.6 Croda International PLC
11.7 En-Tech Polymer Co., Ltd
11.8 Hankuck Latices Co., Ltd.
11.9 Indulor Chemie GmbH
11.10 Junneng Chemical
11.11 Paras Enterprises
11.12 Visen Industries Limited
*Business Overview, Products Offered, Recent Developments, MnM View, SWOT Analysis Might Not Be Captured in Case of Unlisted Companies.
12 Appendix (Page No. - 111)
12.1 Insights From Industry Experts
12.2 Discussion Guide
12.3 Knowledge Store: Marketsandmarkets� Subscription Portal
12.4 Introducing RT: Real-Time Market Intelligence
12.5 Related Reports
12.6 Author Details
List of Tables (82 Tables)
Table 1 Trends and Forecast of GDP, 2016�2022 (USD Billion)
Table 2 Contribution of Paints & Coatings Industry to GDP of North America, 2015�2022 (USD Million)
Table 3 Contribution of Paints & Coatings Industry to GDP of Europe, 2015�2022 (USD Million)
Table 4 Contribution of Paints & Coatings Industry to GDP of APAC, 2015�2022 (USD Million)
Table 5 Contribution of Paints & Coatings Industry to GDP of Middle East & Africa, 2015�2022 (USD Million)
Table 6 Opaque Polymers Market Size, By Type, 2015�2022 (Kiloton)
Table 7 Opaque Polymers Market Size, By Type, 2015�2022 (USD Million)
Table 8 Opaque Polymers Market Size, By Application, 2015�2022 (Kiloton)
Table 9 Opaque Polymers Market Size, By Application, 2015�2022 (USD Million)
Table 10 Opaque Polymers Market Size, By Region, 2015�2022 (Kiloton)
Table 11 Opaque Polymers Market Size, By Region, 2015�2022 (USD Million)
Table 12 North America: Opaque Polymers Market Size, By Country, 2015�2022 (Kiloton)
Table 13 North America: By Market Size, By Country, 2015�2022 (USD Million)
Table 14 North America: By Market Size, By Type, 2015�2022 (Kiloton)
Table 15 North America: By Market Size, By Type, 2015�2022 (USD Million)
Table 16 North America: By Market Size, By Application, 2015�2022 (Kiloton)
Table 17 North America: By Market Size, By Application, 2015�2022 (USD Million)
Table 18 US: By Market Size, By Application, 2015�2022 (Kiloton)
Table 19 US: By Market Size, By Application, 2015�2022 (USD Million)
Table 20 Canada: By Market Size, By Application, 2015�2022 (Kiloton)
Table 21 Canada: By Market Size, By Application, 2015�2022 (USD Million)
Table 22 Mexico: By Market Size, By Application, 2015�2022 (Kiloton)
Table 23 Mexico: By Market Size, By Application, 2015�2022 (USD Million)
Table 24 Europe: By Market Size, By Country, 2015�2022 (Kiloton)
Table 25 Europe: By Market Size, By Country, 2015�2022 (USD Million)
Table 26 Europe: By Market Size, By Type, 2015�2022 (Kiloton)
Table 27 Europe: By Market Size, By Type, 2015�2022 (USD Million)
Table 28 Europe: By Market Size, By Application, 2015�2022 (Kiloton)
Table 29 Europe: By Market Size, By Application, 2015�2022 (USD Million)
Table 30 Russia: By Market Size, By Application, 2015�2022 (Kiloton)
Table 31 Russia: By Market Size, By Application, 2015�2022 (USD Million)
Table 32 Germany: By Market Size, By Application, 2015�2022 (Kiloton)
Table 33 Germany: By Market Size, By Application, 2015�2022 (USD Million)
Table 34 UK: By Market Size, By Application, 2015�2022 (Kiloton)
Table 35 UK: By Market Size, By Application, 2015�2022 (USD Million)
Table 36 Italy: By Market Size, By Application, 2015�2022 (Kiloton)
Table 37 Italy: By Market Size, By Application, 2015�2022 (USD Million)
Table 38 France: By Market Size, By Application, 2015�2022 (Kiloton)
Table 39 France: By Market Size, By Application, 2015�2022 (USD Million)
Table 40 Rest of Europe: By Market Size, By Application, 2015�2022 (Kiloton)
Table 41 Rest of Europe: By Market Size, By Application, 2015�2022 (USD Million)
Table 42 APAC: By Market Size, By Country, 2015�2022 (Kiloton)
Table 43 APAC: By Market Size, By Country, 2015�2022 (USD Million)
Table 44 APAC: By Market Size, By Type, 2015�2022 (Kiloton)
Table 45 APAC: By Market Size, By Type, 2015�2022 (USD Million)
Table 46 APAC: By Market Size, By Application, 2015�2022 (Kiloton)
Table 47 APAC: By Market Size, By Application, 2015�2022 (USD Million)
Table 48 China: By Market Size, By Application, 2015�2022 (Kiloton)
Table 49 China: By Market Size, By Application, 2015�2022 (USD Million)
Table 50 India: By Market Size, By Application, 2015�2022 (Kiloton)
Table 51 India: By Market Size, By Application, 2015�2022 (USD Million)
Table 52 South Korea: By Market Size, By Application, 2015�2022 (Kiloton)
Table 53 South Korea: By Market Size, By Application, 2015�2022 (USD Million)
Table 54 Japan: By Market Size, By Application, 2015�2022 (Kiloton)
Table 55 Japan: By Market Size, By Application, 2015�2022 (USD Million)
Table 56 Rest of APAC: By Market Size, By Application, 2015�2022 (Kiloton)
Table 57 Rest of APAC: By Market Size, By Application, 2015�2022 (USD Million)
Table 58 Middle East & Africa: By Market Size, By Country, 2015�2022 (Kiloton)
Table 59 Middle East & Africa: By Market Size, By Country, 2015�2022 (USD Million)
Table 60 Middle East & Africa: By Market Size, By Type, 2015�2022 (Kiloton)
Table 61 Middle East & Africa: By Market Size, By Type, 2015�2022 (USD Million)
Table 62 Middle East & Africa: By Market Size, By Application, 2015�2022 (Kiloton)
Table 63 Middle East & Africa: By Market Size, By Application, 2015�2022 (USD Million)
Table 64 Saudi Arabia: By Market Size, By Application, 2015�2022 (Kiloton)
Table 65 Saudi Arabia: By Market Size, By Application, 2015�2022 (USD Million)
Table 66 South Africa: By Market Size, By Application, 2015�2022 (Kiloton)
Table 67 South Africa: By Market Size, By Application, 2015�2022 (USD Million)
Table 68 Rest of Middle East & Africa: By Market Size, By Application, 2015�2022 (Kiloton)
Table 69 Rest of Middle East & Africa: By Market Size, By Application, 2015�2022 (USD Million)
Table 70 South America: By Market Size, By Country, 2015�2022 (Kiloton)
Table 71 South America: By Market Size, By Country, 2015�2022 (USD Million)
Table 72 South America: By Market Size, By Type, 2015�2022 (Kiloton)
Table 73 South America: By Market Size, By Type, 2015�2022 (USD Million)
Table 74 South America: By Market Size, By Application, 2015�2022 (Kiloton)
Table 75 South America: By Market Size, By Application, 2015�2022 (USD Million)
Table 76 Brazil: By Market Size, By Application, 2015�2022 (Kiloton)
Table 77 Brazil: By Market Size, By Application, 2015�2022 (USD Million)
Table 78 Rest of South America: By Market Size, By Application, 2015�2022 (Kiloton)
Table 79 Rest of South America: By Market Size, By Application, 2015�2022 (USD Million)
Table 80 Contracts, Expansions, Agreements, and Investments 2015-2017
Table 81 Mergers, Joint Ventures, and Acquisitions, 2015-2017
Table 82 New Product Launches, 2015-2017
List of Figures (34 Figures)
Figure 1 Opaque Polymers Market Segmentation
Figure 2 Opaque Polymers Market: Research Design
Figure 3 Market Size Estimation: Bottom-Up Approach
Figure 4 Market Size Estimation: Top-Down Approach
Figure 5 Opaque Polymers: Data Triangulation
Figure 6 Paints & Coatings to Be the Largest Segment of the Opaque Polymers Market
Figure 7 Solid Content 30% to Dominate the Opaque Polymers Market
Figure 8 India to Register the Highest CAGR of the Opaque Polymers Market Between 2017 and 2022
Figure 9 APAC Led the Opaque Polymers Market in 2016, By Value
Figure 10 Attractive Market Opportunities in the Global Opaque Polymers Market 2017 vs 2022
Figure 11 Paints & Coatings to Be the Fastest-Growing Application Between 2017 and 2022
Figure 12 China to Be the Largest Market of Opaque Polymers in APAC
Figure 13 China to Be the Largest Market Between 2017 and 2022
Figure 14 Drivers, Restraints, Opportunities, and Challenges in the Opaque Polymers Market
Figure 15 Porter�s Five Forces Analysis: Opaque Polymers
Figure 16 Trends and Forecast of GDP, 2017�2022 (USD Billion)
Figure 17 Contribution of the Paints & Coatings Industry to the GDP of North America, 2017 vs 2022
Figure 18 Paints & Coatings Industry in Russia Contributes the Maximum to the GDP of Europe
Figure 19 India to Register the Highest CAGR in Paints & Coatings Industry Between 2017 and 2022
Figure 20 Saudi Arabia to Account for the Larger Market Share in Paints & Coatings Industry
Figure 21 Solid Content 30% to Be Larger Opaque Polymers Market
Figure 22 Paints & Coatings Application to Dominate the Opaque Polymers Market Between 2017 and 2022
Figure 23 India, China, Canada, and Mexico to Be Emerging Markets of Opaque Polymers During Forecast Period
Figure 24 North America Snapshot: US Accounted for the Largest Market in North America, in 2016
Figure 25 Europe Market Snapshot: Russia to Register the Highest CAGR in the Opaque Polymers Market, (2017-2022)
Figure 26 APAC Snapshot: China to Lead the Opaque Polymers Market, By Value, Between 2017 and 2022
Figure 27 Paints & Coatings to Dominate the Opaque Polymers Market in Middle East & Africa, 2017-2022
Figure 28 Opaque Polymers Market in South America
Figure 29 Companies Adopted Contracts, Expansions, Agreements, Joint Ventures, and Investments as the Key Strategies, 2015-2017
Figure 30 Market Ranking of Key Players, 2016
Figure 31 Dow: Company Snapshot
Figure 32 Arkema: Company Snapshot
Figure 33 Ashland Global Holdings Inc.: Company Snapshot
Figure 34 Croda: Company Snapshot


Growth opportunities and latent adjacency in Opaque Polymers Market