Smart Polymers Market by Type (Physical Stimuli, Chemical Stimuli, and Biological Stimuli Responsive Polymers), End-Use Industry (Biomedical & Biotechnology, Textile, Electrical & Electronics, Automotive), and Region - Global Forecast to 2028


Get the updated report with forecasts to 2028 : Inquire Now
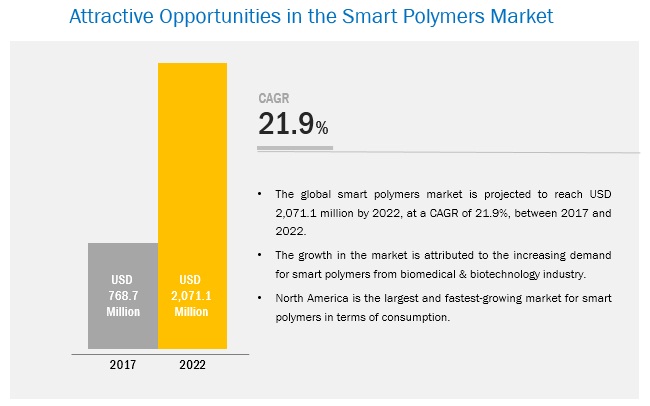
[137 Pages Report] Smart Polymers Market size was USD 634.2 Million in 2016 and is projected to reach USD 2,071.1 Million by 2022, at a CAGR of 21.9% during the forecast period. The base year considered for the study is 2016, while the forecast period is from 2017 to 2022.
The objectives of the report are as follows:
- To define, describe, and forecast the global smart polymers market size on the basis of type, end-use industry, and region
- To provide detailed information regarding major factors influencing the growth of the market (drivers, restraints, opportunities, and industry specific challenges)
- To analyze the opportunities in the market for stakeholders and details of a competitive landscape for market leaders
- To forecast the market size, in terms of value, with respect to five main regions, namely, North America, South America, Europe, Asia Pacific, and the Middle East & Africa
- To strategically profile key players and comprehensively analyze core competencies
- To track and analyze competitive developments such as joint ventures, mergers & acquisitions, new product developments, and research & developments (R&D) in the smart polymers market
Research Methodology
The top-down approach has been used to estimate and validate the size of the smart polymers market and to estimate the sizes of various other dependent submarkets in the overall smart polymers market. The research study involved the extensive use of secondary sources, directories, and databases such as Hoovers, Bloomberg, Chemical Weekly, Factiva, and other government and private websites to identify and collect information useful for the technical, market-oriented, and commercial study of the smart polymers market.
To know about the assumptions considered for the study, download the pdf brochure
The supply chain of the smart polymers market starts with sourcing raw materials, followed by the manufacture of smart polymers and supply of finished smart polymers products, and ends with the use of smart polymers in various end-use applications. The major players in the smart polymers market are BASF (Germany), Lubrizol (US), Dow Chemical (US), Evonik (Germany), Advanced Polymer Materials (Canada), Spintech (US), Merck (Germany), Akina (US), SMP Technologies (Japan), Reactive Surfaces (US) and NEI Corporation (US).
Key Target Audience:
- Smart Polymer Manufacturing Companies
- Traders, Distributors, and Retailers
- Raw Material Suppliers
- Commercial R&D Institutes
- Research Institutes, Trade Associations, and Government Agencies
Scope of the report:
This research report categorizes the smart polymers market on the basis of type, end-use industry, and region.
On the basis of Type:
-
Physical Stimuli Responsive Polymers
- Thermo-responsive Polymers
- Photo-responsive Polymers
- Pressure-responsive Polymers
- Electroactive & Magnetically-responsive Polymers
-
Chemical Stimuli Responsive Polymers
- pH-responsive Polymers
-
Biological Stimuli Responsive Polymers
- Enzymes-responsive Polymers
- Self-healing Polymers
On the basis of End-use Industry:
- Biomedical & Biotechnology
- Textiles
- Electrical & Electronics
- Automotive
- Others (Food Packaging, Footwear, Consumer Goods, Aerospace & Defense)
On the basis of Region:
- North America
- Europe
- South America
- Asia Pacific
- Middle East & Africa
The market has been further analyzed for the key countries in each of these regions.
Available Customizations:
Along with the given market data, MarketsandMarkets offers customizations as per the specific needs of the companies. The following customization options are available for the report:
Country Information:
- Smart polymers market analysis for additional countries
Company Information:
- Detailed analysis and profiles of additional market players (up to 5)
Pricing Analysis:
- Detailed pricing analysis for each type of smart polymer product
The smart polymers market was USD 634.2 Million in 2016 and projected to reach USD 2,071.1 Million by 2022, at a CAGR of 21.9% between 2017 and 2022. Increasing adoption of smart polymers in the automotive and drug delivery sectors, development of smart textiles, and rising need for efficient drug delivery systems is expected to drive the global smart polymers market during the forecast period.
Smart polymers are classified into three types based on the external environmental stimuli to which they respond. The types are physical stimuli responsive polymers, chemical stimuli responsive polymers, and biological stimuli responsive polymers. Physical stimuli responsive polymers type is the most-widely used type of smart polymers due to high demand from end-use industries such as biomedical & biotechnology, automotive, and textiles.
By end-use industry, smart polymers are classified into five segments, namely biomedical & biotechnology, textiles, electrical & electronics, automotive, and others. The biomedical & biotechnology industry is the largest end-use industry for smart polymers. The rising need for highly efficient polymers for the manufacture of effective drug delivery systems and phase separation processes is expected to drive the smart polymers market in this end-use industry during the forecast period.
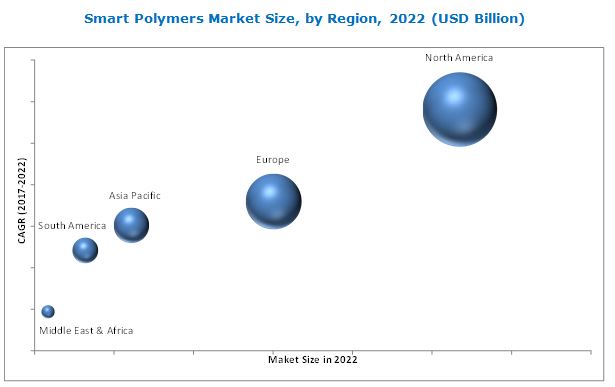
North America is expected to be the largest market for smart polymers and is also projected to register the highest CAGR during the forecast period. The US is expected to account for the largest share of the market in North America till 2022 and is also expected to be the fastest-growing market for smart polymers during the forecast period. Major producers of smart polymers such as Lubrizol (US), Dow Chemical (US), Advanced Polymer Materials (Canada), Spintech (US), Akina (US), Reactive Surfaces (US) and NEI Corporation (US) are located in North America. Europe accounts for the second-largest share of the global smart polymers market.
Companies such as Lubrizol (US), Dow Chemical (US), and Merck (Germany) adopted expansions, acquisitions, and collaborations strategies to increase their market shares and distribution networks in the smart polymers market from 2014 to 2017.
Companies are using the collaborations strategy to increase their product efficiency and customer satisfaction. For example, Dow Microbial Control, a business unit of Dow Chemical collaborated with Strategic Partners, Inc. (US), to develop the next generation medical scrubs and lab coats that will feature SILVADUR antimicrobial (SILVADUR antimicrobial is a microbial control technology). Strategic Partners, Inc. is a designer, manufacturer and distributor of comfortable, functional, and fashionable medical apparel and lab wear. With this collaboration, the company expects to increase its customer base in the smart polymers market.
To speak to our analyst for a discussion on the above findings, click Speak to Analyst
 Exclusive indicates content/data unique to MarketsandMarkets and not available with any competitors.
Table of Contents
1 Introduction (Page No. - 16)
1.1 Objectives of the Study
1.2 Market Definition
1.3 Market Scope
1.3.1 Years Considered for the Study
1.4 Currency
1.5 Stakeholders
2 Research Methodology (Page No. - 19)
2.1 Research Data
2.2 Secondary Data
2.2.1 Key Data From Secondary Sources
2.3 Primary Data
2.3.1 Key Data From Primary Sources
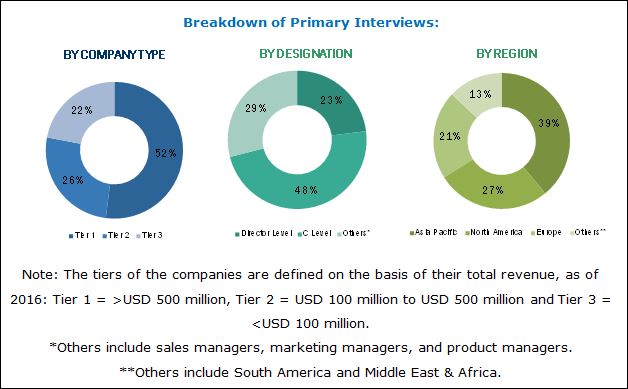
2.3.2 Breakdown of Primary Interviews
2.4 Market Size Estimation
2.5 Data Triangulation
2.6 Research Assumptions and Limitations
2.6.1 Assumptions
2.6.2 Limitations
3 Executive Summary (Page No. - 27)
4 Premium Insights (Page No. - 30)
4.1 Significant Opportunities in the Smart Polymers Market
4.2 Smart Polymers Market in North America, By Type, and Country
4.3 Smart Polymers Market, By Type
4.4 Smart Polymers Market, By End-Use Industry
4.5 Smart Polymers Market Size, By Country
5 Market Overview (Page No. - 34)
5.1 Introduction
5.2 Market Dynamics
5.2.1 Drivers
5.2.1.1 Increasing Adoption of Smart Polymers in the Automotive Industry and Drug Delivery to Drive the Global Smart Polymers Market
5.2.1.2 The Development of Smart Textiles is Expected to Drive the Global Smart Polymers Market
5.2.1.3 Rising Need for Efficient Drug Delivery Systems
5.2.2 Restraints
5.2.2.1 High Cost of Technology Development and Polymer Production
5.2.2.2 Concerns Related to the Use of Smart Polymers In-Vivo
5.2.3 Opportunities
5.2.3.1 Increasing Awareness Regarding the Use of Smart Polymers
5.2.4 Challenges
5.2.4.1 Most of the Currently Developed Smart Polymeric Drug Delivery Systems are Yet to Make Clinical Transition
5.2.4.2 Higher Molecular Weight Smart Polymers, Though Effective, are Still Not Tested in Clinical Trials
6 Smart Polymers Market, By Type (Page No. - 38)
6.1 Introduction
6.2 Physical Stimuli-Responsive Polymers
6.2.1 Thermo-Responsive Polymers
6.2.2 Photo-Responsive Polymers
6.2.3 Pressure-Responsive Polymers
6.2.4 Electric & Magnetic Field-Responsive Polymers
6.3 Chemical Stimuli-Responsive Polymers
6.3.1 Ph-Responsive Polymers
6.4 Biological Stimuli-Responsive Polymers
6.4.1 Enzymes-Responsive Polymers
6.4.2 Self-Healing Polymers
7 Smart Polymers Market, By End-Use Industry (Page No. - 50)
7.1 Introduction
7.2 Biomedical & Biotechnology
7.3 Textile
7.4 Electrical & Electronics
7.5 Automotive
7.6 Others
8 Smart Polymers Market, By Region (Page No. - 60)
8.1 Introduction
8.2 North America
8.2.1 U.S.
8.2.2 Canada
8.2.3 Mexico
8.3 South America
8.3.1 Brazil
8.3.2 Rest of South America
8.4 Europe
8.4.1 Spain
8.4.2 France
8.4.3 Germany
8.4.4 Italy
8.4.5 UK
8.4.6 Rest of Europe
8.5 Asia-Pacific
8.5.1 China
8.5.2 Japan
8.5.3 India
8.5.4 Australia
8.5.5 Rest of Asia-Pacific
8.6 Middle East & Africa
8.6.1 Saudi Arabia
8.6.2 Rest of Middle East & Africa
9 Company Profiles (Page No. - 108)
(Overview, Strength of Product Portfolio, Business Strategy Excellence, Recent Developments)*
9.1 BASF SE
9.2 The Lubrizol Corporation
9.3 The DOW Chemical Company
9.4 Evonik Industries AG
9.5 Merck Group
9.6 Advanced Polymer Materials Inc.
9.7 Spintech LLC
9.8 Akina Inc.
9.9 SMP Technologies Inc.
9.10 Reactive Surfaces Ltd
9.11 NEI Corporation
9.12 Other Key Market Players
*Details on Overview, Strength of Product Portfolio, Business Strategy Excellence, Recent Developments Might Not Be Captured in Case of Unlisted Companies.
10 Appendix (Page No. - 130)
10.1 Insights of Industry Experts
10.2 Discussion Guide
10.3 Knowledge Store: Marketsandmarkets Subscription Portal
10.4 Introducing RT: Real Time Market Intelligence
10.5 Available Customizations
10.6 Related Reports
10.7 Author Details
List of Tables (142 Tables)
Table 1 Smart Polymer Adaptive Property vs Stimulus
Table 2 Smart Polymers Market Size, By Type, 2015–2022 (USD Million)
Table 3 By Market Size, By Physical Stimuli-Responsive Polymers Type, 2015–2022 (USD Million)
Table 4 Smart Polymers Market Size, By Chemical Stimuli-Responsive Polymers Type, 2015–2022 (USD Million)
Table 5 By Market Size, By Biological Stimuli-Responsive Polymers Type, 2015–2022 (USD Million)
Table 6 Physical Stimuli-Responsive Polymers Market Size, By Region, 2015–2022 (USD Million)
Table 7 Thermo-Responsive Polymers Market Size, By Region, 2015–2022 (USD Million)
Table 8 Photo-Responsive Polymers Market Size, By Region, 2015–2022 (USD Million)
Table 9 Pressure-Responsive Polymers Market Size, By Region, 2015–2022 (USD Million)
Table 10 The Electric & Magnetic Field-Responsive Polymers Market Size, By Region, 2015–2022 (USD Million)
Table 11 Chemical Stimuli-Responsive Polymers Market Size, By Region, 2015–2022 (USD Million)
Table 12 Ph-Responsive Polymers Market Size, By Region, 2015–2022 (USD Million)
Table 13 Biological Stimuli-Responsive Polymers Market Size, By Region, 2015–2022 (USD Million)
Table 14 Enzymes-Responsive Polymers Market Size, By Region, 2015–2022 (USD Million)
Table 15 Self-Healing Polymers Market Size, By Region, 2015–2022 (USD Million)
Table 16 Smart Polymers Market Size, By End-Use Industry, 2015–2022 (USD Million)
Table 17 By Market Size in Biomedical & Biotechnology End-Use Industry, By Region, 2015–2022 (USD Million)
Table 18 Smart Polymers Market Size in Textile End-Use Industry, By Region, 2015–2022 (USD Million)
Table 19 By Market Size in Electrical & Electronics End-Use Industry, By Region, 2015–2022 (USD Million)
Table 20 Smart Polymers Market Size in Automotive End-Use Industry, By Region, 2015–2022 (USD Million)
Table 21 By Market Size in Other End-Use Industries, By Region, 2015–2022 (USD Million)
Table 22 Smart Polymers Market Size, By Region, 2015–2022 (USD Million)
Table 23 North America: Smart Polymers Market Size, By Country, 2015–2022 (USD Million)
Table 24 North America: By Market Size, By Type, 2015–2022 (USD Million)
Table 25 North America: Smart Polymers Market Size, By Physical Stimuli-Responsive Polymers Type, 2015–2022 (USD Million)
Table 26 North America: By Market Size, By Chemical Stimuli-Responsive Polymers Type, 2015–2022 (USD Million)
Table 27 North America: Smart Polymers Market Size, By Biological Stimuli-Responsive Polymers Type, 2015–2022 (USD Million)
Table 28 North America: By Market Size, By End-Use Industry, 2015–2022 (USD Million)
Table 29 U.S.: Smart Polymers Market Size, By Type, 2015–2022 (USD Million)
Table 30 U.S.: By Market Size, By Physical Stimuli-Responsive Polymers Type, 2015–2022 (USD Million)
Table 31 U.S.: Smart Polymers Market Size, By Chemical Stimuli-Responsive Polymers Type, 2015–2022 (USD Million)
Table 32 U.S.: By Market Size, By Biological Stimuli-Responsive Polymers Type, 2015–2022 (USD Million)
Table 33 U.S.: Smart Polymers Market Size, By End-Use Industry, 2015–2022 (USD Million)
Table 34 Canada: By Market Size, By Type, 2015–2022 (USD Million)
Table 35 Canada: Smart Polymers Market Size, By Physical Stimuli-Responsive Polymers Type, 2015–2022 (USD Million)
Table 36 Canada: By Market Size, By Chemical Stimuli-Responsive Polymers Type, 2015–2022 (USD Million)
Table 37 Canada: Smart Polymers Market Size, By Biological Stimuli-Responsive Polymers Type, 2015–2022 (USD Million)
Table 38 Canada: By Market Size, By End-Use Industry, 2015–2022 (USD Million)
Table 39 Mexico: Smart Polymers Market Size, By Type, 2015–2022 (USD Million)
Table 40 Mexico: By Market Size, By Physical Stimuli-Responsive Polymers Type, 2015–2022 (USD Million)
Table 41 Mexico: Smart Polymers Market Size, By Chemical Stimuli-Responsive Polymers Type, 2015–2022 (USD Million)
Table 42 Mexico: By Market Size, By Biological Stimuli-Responsive Polymers Type, 2015–2022 (USD Million)
Table 43 Mexico: Smart Polymers Market Size, By End-Use Industry, 2015–2022 (USD Million)
Table 44 South America: Smart Polymers Market Size, By Country, 2015–2022 (USD Million)
Table 45 South America: By Market Size, By Type, 2015–2022 (USD Million)
Table 46 South America: Smart Polymers Market Size, By Physical Stimuli-Responsive Polymers Type, 2015–2022 (USD Million)
Table 47 South America: By Market Size, By Chemical Stimuli-Responsive Polymers Type, 2015–2022 (USD Million)
Table 48 South America: Smart Polymers Market Size, By Biological Stimuli-Responsive Polymers Type, 2015–2022 (USD Million)
Table 49 South America: By Market Size, By End-Use Industry, 2015–2022 (USD Million)
Table 50 Brazil: Smart Polymers Market Size, By Type, 2015–2022 (USD Million)
Table 51 Brazil: By Market Size, By Physical Stimuli-Responsive Polymers Type, 2015–2022 (USD Million)
Table 52 Brazil: Smart Polymers Market Size, By Chemical Stimuli-Responsive Polymers Type, 2015–2022 (USD Million)
Table 53 Brazil: By Market Size, By Biological Stimuli-Responsive Polymers Type, 2015–2022 (USD Million)
Table 54 Brazil: Smart Polymers Market Size, By End-Use Industry, 2015–2022 (USD Million)
Table 55 Rest of South America: By Market Size, By Type, 2015–2022 (USD Million)
Table 56 Rest of South America: Smart Polymers Market Size, By Physical Stimuli-Responsive Polymers Type, 2015–2022 (USD Million)
Table 57 Rest of South America: By Market Size, By Chemical Stimuli-Responsive Polymers Type, 2015–2022 (USD Million)
Table 58 Rest of South America: Smart Polymers Market Size, By Biological Stimuli-Responsive Polymers Type, 2015–2022 (USD Million)
Table 59 Rest of South America: By Market Size, By End-Use Industry, 2015–2022 (USD Million)
Table 60 Europe: Smart Polymers Market Size, By Country, 2015–2022 (USD Million)
Table 61 Europe: By Market Size, By Type, 2015–2022 (USD Million)
Table 62 Europe: Smart Polymers Market Size, By Physical Stimuli Responsive Polymers Type, 2015–2022 (USD Million)
Table 63 Europe: By Market Size, By Chemical Stimuli Responsive Polymers Type, 2015–2022 (USD Million)
Table 64 Europe: Smart Polymers Market Size, By Biological Stimuli Responsive Polymers Type, 2015–2022 (USD Million)
Table 65 Europe: By Market Size, By End-Use Industry, 2015–2022 (USD Million)
Table 66 Spain: Smart Polymers Market Size, By Type, 2015–2022 (USD Million)
Table 67 Spain: By Market Size, By Physical Stimuli Responsive Polymers Type, 2015–2022 (USD Million)
Table 68 Spain: Smart Polymers Market Size, By Chemical Stimuli Responsive Polymers Type, 2015–2022 (USD Million)
Table 69 Spain: By Market Size, By Biological Stimuli Responsive Polymers Type, 2015–2022 (USD Million)
Table 70 Spain: Smart Polymers Market Size, By End-Use Industry, 2015–2022 (USD Million)
Table 71 France: By Market Size, By Type, 2015–2022 (USD Million)
Table 72 France: Smart Polymers Market Size, By Physical Stimuli Responsive Polymers Type, 2015–2022 (USD Million)
Table 73 France: By Market Size, By Chemical Stimuli Responsive Polymers Type, 2015–2022 (USD Million)
Table 74 France: Smart Polymers Market Size, By Biological Stimuli Responsive Polymers Type, 2015–2022 (USD Million)
Table 75 France: By Market Size, By End-Use Industry, 2015–2022 (USD Million)
Table 76 Germany: Smart Polymers Market Size, By Type, 2015–2022 (USD Million)
Table 77 Germany: By Market Size, By Physical Stimuli Responsive Polymers Type, 2015–2022 (USD Million)
Table 78 Germany: Smart Polymers Market Size, By Chemical Stimuli Responsive Polymers Type, 2015–2022 (USD Million)
Table 79 Germany: By Market Size, By Biological Stimuli Responsive Polymers Type, 2015–2022 (USD Million)
Table 80 Germany: Smart Polymers Market Size, By End-Use Industry, 2015–2022 (USD Million)
Table 81 Italy: By Market Size, By Type, 2015–2022 (USD Million)
Table 82 Italy: Smart Polymers Market Size, By Physical Stimuli Responsive Polymers Type, 2015–2022 (USD Million)
Table 83 Italy: By Market Size, By Chemical Stimuli Responsive Polymers Type, 2015–2022 (USD Million)
Table 84 Italy: Smart Polymers Market Size, By Biological Stimuli Responsive Polymers Type, 2015–2022 (USD Million)
Table 85 Italy: By Market Size, By End-Use Industry, 2015–2022 (USD Million)
Table 86 UK: Smart Polymers Market Size, By Type, 2015–2022 (USD Million)
Table 87 UK: By Market Size, By Physical Stimuli Responsive Polymers Type, 2015–2022 (USD Million)
Table 88 UK: Smart Polymers Market Size, By Chemical Stimuli Responsive Polymers Type, 2015–2022 (USD Million)
Table 89 UK: By Market Size, By Biological Stimuli Responsive Polymers Type, 2015–2022 (USD Million)
Table 90 UK: Smart Polymers Market Size, By End-Use Industry, 2015–2022 (USD Million)
Table 91 Rest of Europe: By Market Size, By Type, 2015–2022 (USD Million)
Table 92 Rest of Europe: Smart Polymers Market Size, By Physical Stimuli Responsive Polymers Type, 2015–2022 (USD Million)
Table 93 Rest of Europe: By Market Size, By Chemical Stimuli Responsive Polymers Type, 2015–2022 (USD Million)
Table 94 Rest of Europe: Smart Polymers Market Size, By Biological Stimuli Responsive Polymers Type, 2015–2022 (USD Million)
Table 95 Rest of Europe: By Market Size, By End-Use Industry, 2015–2022 (USD Million)
Table 96 Asia-Pacific: Smart Polymers Market Size, By Country, 2015–2022 (USD Million)
Table 97 Asia-Pacific: By Market Size, By Type, 2015–2022 (USD Million)
Table 98 Asia-Pacific: Smart Polymers Market Size, By Physical Stimuli-Responsive Polymers Type, 2015–2022 (USD Million)
Table 99 Asia-Pacific: By Market Size, By Chemical Stimuli-Responsive Polymers Type, 2015–2022 (USD Million)
Table 100 Asia-Pacific: Smart Polymers Market Size, By Biological Stimuli-Responsive Polymers Type, 2015–2022 (USD Million)
Table 101 Asia-Pacific: By Market Size, By End-Use Industry, 2015–2022 (USD Million)
Table 102 China: Smart Polymers Market Size, By Type, 2015–2022 (USD Million)
Table 103 China: By Market Size, By Physical Stimuli-Responsive Polymers Type, 2015–2022 (USD Million)
Table 104 China: Smart Polymers Market Size, By Chemical Stimuli-Responsive Polymers Type, 2015–2022 (USD Million)
Table 105 China: By Market Size, By Biological Stimuli-Responsive Polymers Type, 2015–2022 (USD Million)
Table 106 China: Smart Polymers Market Size, By End-Use Industry, 2015–2022 (USD Million)
Table 107 Japan: By Market Size, By Type, 2015–2022 (USD Million)
Table 108 Japan: Smart Polymers Market Size, By Physical Stimuli-Responsive Polymers Type, 2015–2022 (USD Million)
Table 109 Japan: By Market Size, By Chemical Stimuli-Responsive Polymers Type, 2015–2022 (USD Million)
Table 110 Japan: Smart Polymers Market Size, By Biological Stimuli-Responsive Polymers Type, 2015–2022 (USD Million)
Table 111 Japan: By Market Size, By End-Use Industry, 2015–2022 (USD Million)
Table 112 India: Smart Polymers Market Size, By Type, 2015–2022 (USD Million)
Table 113 India: By Market Size, By Physical Stimuli-Responsive Polymers Type, 2015–2022 (USD Million)
Table 114 India: Smart Polymers Market Size, By Chemical Stimuli-Responsive Polymers Type, 2015–2022 (USD Million)
Table 115 India: By Market Size, By Biological Stimuli-Responsive Polymers Type, 2015–2022 (USD Million)
Table 116 India: Smart Polymers Market Size, By End-Use Industry, 2015–2022 (USD Million)
Table 117 Australia: By Market Size, By Type, 2015–2022 (USD Million)
Table 118 Australia: Smart Polymers Market Size, By Physical Stimuli-Responsive Polymers Type, 2015–2022 (USD Million)
Table 119 Australia: By Market Size, By Chemical-Stimuli Responsive Polymers Type, 2015–2022 (USD Million)
Table 120 Australia: Smart Polymers Market Size, By Biological-Stimuli Responsive Polymers Type, 2015–2022 (USD Million)
Table 121 Australia: By Market Size, By End-Use Industry, 2015–2022 (USD Million)
Table 122 Rest of Asia-Pacific: Smart Polymers Market Size, By Type, 2015–2022 (USD Million)
Table 123 Rest of Asia-Pacific: By Market Size, By Physical Stimuli-Responsive Polymers Type, 2015–2022 (USD Million)
Table 124 Rest of Asia-Pacific: Smart Polymers Market Size, By Chemical Stimuli-Responsive Polymers Type, 2015–2022 (USD Million)
Table 125 Rest of Asia-Pacific: By Market Size, By Biological Stimuli-Responsive Polymers Type, 2015–2022 (USD Million)
Table 126 Rest of Asia-Pacific: Smart Polymers Market Size, By End-Use Industry, 2015–2022 (USD Million)
Table 127 Middle East & Africa: By Market Size, By Country, 2015–2022 (USD Million)
Table 128 Middle East & Africa: Smart Polymers Market Size, By Type, 2015–2022 (USD Million)
Table 129 Middle East & Africa: By Market Size, By Physical Stimuli-Responsive Polymers Type, 2015–2022 (USD Million)
Table 130 Middle East & Africa: Smart Polymers Market Size, By Chemical Stimuli-Responsive Polymers Type, 2015–2022 (USD Million)
Table 131 Middle East & Africa: By Market Size, By Biological Stimuli-Responsive Polymers Type, 2015–2022 (USD Million)
Table 132 Middle East & Africa: Smart Polymers Market Size, By End-Use Industry, 2015–2022 (USD Million)
Table 133 Saudi Arabia: Smart Polymers Market Size, By Type, 2015–2022 (USD Million)
Table 134 Saudi Arabia: Smart Polymers Market Size, By Physical Stimuli-Responsive Polymers Type, 2015–2022 (USD Million)
Table 135 Saudi Arabia: Smart Polymers Market Size, By Chemical Stimuli-Responsive Polymers Type, 2015–2022 (USD Million)
Table 136 Saudi Arabia: Smart Polymers Market Size, By Biological Stimuli Responsive Polymers Type, 2015–2022 (USD Million)
Table 137 Saudi Arabia: Smart Polymers Market Size, By End-Use Industry, 2015–2022 (USD Million)
Table 138 Rest of Middle East & Africa: Smart Polymers Market Size, By Type, 2015–2022 (USD Million)
Table 139 Rest of Middle East & Africa: Smart Polymers Market Size, By Physical Stimuli-Responsive Polymers Type, 2015–2022 (USD Million)
Table 140 Rest of Middle East & Africa: Smart Polymers Market Size, By Chemical Stimuli-Responsive Polymers Type, 2015–2022 (USD Million)
Table 141 Rest of Middle East & Africa: Smart Polymers Market Size, By Biological Stimuli-Responsive Polymers Type, 2015–2022 (USD Million)
Table 142 Rest of Middle East & Africa: Smart Polymers Market Size, By End-Use Industry, 2015–2022 (USD Million)
List of Figures (31 Figures)
Figure 1 Global Smart Polymers Market: Research Design
Figure 2 Market Size Estimation: Top-Down Approach
Figure 3 Global Smart Polymers: Data Triangulation
Figure 4 Physical Stimuli-Responsive Polymers Type Leads Smart Polymers Market, 2017-2022
Figure 5 Biomedical & Biotechnology to Be the Dominant End-Use Industry of Smart Polymers Market, 2017-2022
Figure 6 North America Led the Smart Polymers Market in 2016
Figure 7 Smart Polymers Market Size, 2017 vs 2022 (USD Million)
Figure 8 U.S. to Lead the Smart Polymers Market in North America
Figure 9 Physical Stimuli-Responsive Polymers Accounted for the Largest Share in 2016 (USD Million)
Figure 10 Biomedical & Biotechnology Industry Accounted for the Largest Share in 2016 (USD Million)
Figure 11 U.S. Projected to Be the Fastest-Growing Market Between 2017 and 2022
Figure 12 Adoption of Smart Polymers in Different End-Use Industries to Increase Their Consumption
Figure 13 Physical Stimuli-Responsive Polymers Type Led the Smart Polymers Market in 2016 (USD Million)
Figure 14 North America Projected to Account for the Largest Share in Physical Stimuli-Responsive Polymers Type, Between 2017 and 2022
Figure 15 North America to Witness the Highest CAGR for Chemical Stimuli-Responsive Polymers Type in Smart Polymers Market Between 2017 and 2022
Figure 16 Europe to Account for A Major Share in Biological Stimuli-Responsive Polymers Type, Between 2017 and 2022
Figure 17 Biomedical & Biotechnology Led the Smart Polymers Market in 2016 (USD Million)
Figure 18 North America Projected to Account for the Largest Share in Biomedical & Biotechnology End-Use Industry, Between 2017 and 2022
Figure 19 North America Textile End-Use Industry to Witness Highest Growth Rate in the Smart Polymers Market, Between 2017 and 2022
Figure 20 North America Accounts for A Majority Share in the Electrical & Electronics End-Use Industry
Figure 21 Europe to Account for A Major Share in the Automotive End-Use Industry in 2017
Figure 22 North America to Account for Largest Share in the Other End-Use Industries, Between 2017 and 2022
Figure 23 Regional Snapshot: Rapidly Growing Markets are Emerging as New Strategic Locations
Figure 24 North America Market Snapshot: U.S. Was the Largest Market in 2016
Figure 25 U.S. Market Snapshot, 2017 vs 2022
Figure 26 Europe Market Snapshot: Germany Was the Largest Market in 2016
Figure 27 BASF SE: Company Snapshot
Figure 28 The Lubrizol Corporation: Company Snapshot
Figure 29 The DOW Chemical Company: Company Snapshot
Figure 30 Evonik Industries AG: Company Snapshot
Figure 31 Merck Group: Company Snapshot


Growth opportunities and latent adjacency in Smart Polymers Market