Opacifiers Market by Type (Titanium Dioxide, Opaque Polymers, Zircon, Zinc Oxide, Cerium Oxide, Antimony Trioxide), Application (Paints & Coatings, Plastics, Ceramics, Paper, Inks, Fibres, Inks, Personal Care, Home Care, Glass) - Global Forecast to 2023


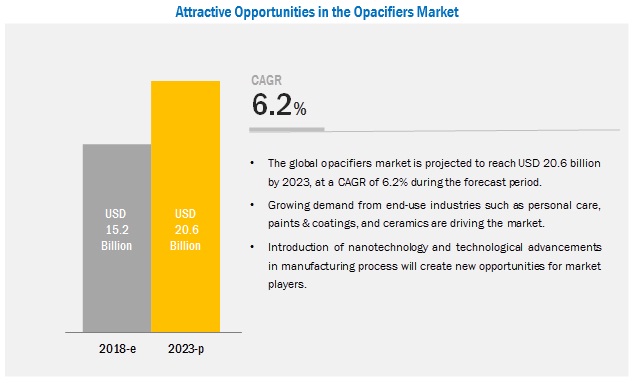
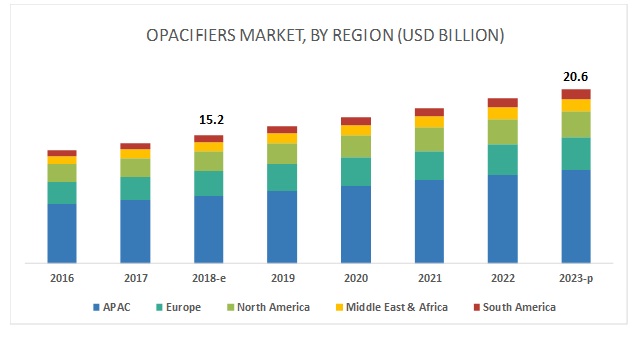
[139 Pages Report] The opacifiers market size is estimated to be USD 15.2 billion in 2018 and is projected reach USD 20.6 billion by 2023, at a CAGR of 6.2% between 2018 and 2023. The market is mainly driven by the rising demand for opacifiers from the end-use industries such as personal care, paints & coatings, and ceramics. Growing demand for opacifiers in upcoming applications has created various opportunities for its manufacturers. APAC is the key market for opacifiers, globally, followed by Europe and North America. One of the primary drivers of the market is the increasing demand for paints & coatings, ceramics, and personal care products in these regions.
Paints & coatings is expected to be the largest application during the forecast period
On the basis of application, the opacifiers market has been segmented into paints & coatings, plastics, ceramics, paper, inks, fibers, personal care, home care, glass, and others. The increased consumption of paints & coatings is attributed to the growing construction industry in APAC. The construction output of the APAC countries is increasing gradually due to the growing population and the increased number of nuclear families. In addition, the increasing purchasing power of the middle-class population and rising standards of living are driving the industry. These factors are expected to fuel the growth of the opacifiers market between 2018 and 2023.
The titanium dioxide segment accounts for the largest share of the overall market.
On the basis of type, the opacifiers market has been segmented into titanium dioxide, opaque polymers, zircon, zinc oxide, cerium oxide, antimony trioxide, tin oxide, and arsenic trioxide. The titanium dioxide is expected to be the largest type during the forecast period. The growth of end-use industries such as paints & coatings, personal care, and plastics are driving the demand for this type. Rising demand for personal care products, increase in a number of working women, changing lifestyle, and growing awareness of hygiene and skin care products are fueling the growth of the market in the personal care end-use industry. The increase in spending on superior personal care products is also driving the titanium dioxide opacifiers market.
APAC is expected to account for the largest share of the opacifiers market during the forecast period.
APAC is estimated to be the largest market for opacifiers due to its growing economy and increasing population. With industrialization and increasing employment, disposable income is expected to increase. This dominance of APAC is mainly due to the increasing population and improving lifestyles at each financial stratum. The demand for opacifiers is dependent on their usage in industries such as paints & coatings, plastics, and ceramics, which contributes more than 80% of its global demand. Companies are investing more in R&D to find out applications of opacifiers in the unconventional industry segments to increase their scope and demand.
The key market players profiled in the report include DowDuPont (US), Arkema (France), Ashland Global Holdings Inc. (US), Tayca Corporation (Japan), Chemours Company (US), Tronox Limited (US), Kronos Worldwide Inc. (US), Cristal (Kuwait), Alkane Resources Ltd (US), En-tech Polymer Co. Ltd. (South Korea), and Venator (UK).
DowDuPont is amongst the leading manufacturers of opacifiers. The company focuses on adopting organic and inorganic strategies such as expansions, mergers & acquisitions, and new product launches to increase its customer base and product portfolio. For instance, in 2017, the company signed an agreement to establish the coating manufacturing site in Saudi Arabia to increase the global reach and to cater to the market of Saudi Arabia effectively. In 2011, the company developed EVOQUE pre-composite polymer technology for opaque polymers to increase their efficiency.
Chemours Company is also amongst the leading suppliers of opacifiers. Chemours Company caters to the demand for specialized opacifiers in North America, South America, the Middle East & Africa, Europe, and APAC. It has a strong foothold in APAC, North America, and Europe, generating a majority of its revenue. It has expanded its R&D centers and floor capacity by continuously investing in the expansion of laboratories, which enables the company to cater to the demand of customers effectively.
Recent Developments
- In September 2017, The Dow Chemical Company announced the successful completion of the merger of equals with DuPont (US). This merger helped the companies to expand their business and cater to the demand for opacifiers effectively through each other�s distribution network.
- In June 2017, Tronox acquired a stake of 24% in the National Titanium dioxide Company (Cristal), for USD 1.67 billion.
- In May 2017, DowDuPont signed an agreement to establish a new polymer manufacturing site in Jubail (Saudi Arabia). This expansion enabled it to capture the opaque polymers market in Saudi Arabia and to increase revenue.
- In May 2016, Chemours Company began the commercial start-up of its new Titanium dioxide line at its Altamira plant in the Mexican state of Tamaulipas with a full capacity of 200,000 metric tons per year. This plant will produce Ti-Pure Titanium dioxide pigments and will serve global customers with high-performance products.
Key questions addressed by the report
- What are the major developments impacting the market?
- Where will all these developments take the industry in the mid to long term?
- What are the upcoming types of opacifiers?
- What are the emerging end-use industries for opacifiers?
- What are the major factors impacting market growth during the forecast period?
To speak to our analyst for a discussion on the above findings, click Speak to Analyst
 Exclusive indicates content/data unique to MarketsandMarkets and not available with any competitors.
Table of Contents
1 Introduction (Page No. - 16)
1.1 Objectives of the Study
1.2 Market Definition
1.2.1 Market Scope
1.2.2 Years Considered for the Study
1.3 Currency
1.4 Unit Considered
1.5 Limitations
1.6 Stakeholders
2 Research Methodology (Page No. - 19)
2.1 Research Data
2.1.1 Secondary Data
2.1.1.1 Key Data From Secondary Sources
2.1.2 Primary Data
2.1.2.1 Key Data From Primary Sources
2.1.2.2 Key Industry Insights
2.1.2.3 Breakdown of Primary Interviews
2.2 Market Size Estimation
2.2.1 Bottom-Up Approach
2.2.2 Top-Down Approach
2.3 Data Triangulation
2.3.1 Assumptions
3 Executive Summary (Page No. - 27)
4 Premium Insights (Page No. - 30)
4.1 Growth Opportunities for Opacifiers Manufacturers Between 2018 and 2023
4.2 Opacifiers Market, By Region
4.3 APAC Opacifiers Market, By Country and Application
4.4 Opacifiers Market, By Country
4.5 Opacifiers Market, By Application, 2018
5 Market Overview (Page No. - 33)
5.1 Introduction
5.2 Market Dynamics
5.2.1 Drivers
5.2.1.1 Growth of the Application Segments
5.2.1.1.1 Personal Care
5.2.1.1.2 Ceramics
5.2.1.1.3 Paints & Coatings
5.2.2 Restraints
5.2.2.1 Stringent Government Regulations Against Certain Oxides
5.2.2.1.1 Titanium Dioxide
5.2.2.1.2 Antimony Trioxide
5.2.3 Opportunities
5.2.3.1 Role of Nanotechnology in Manufacturing Titanium Dioxide
5.2.3.2 Technological Advancements to Improve the Efficiency of Opaque Polymers
5.2.3.3 Increasing Demand for Ceramics in the Developing Markets
5.3 Porter�s Five Forces Analysis
5.3.1 Threat of New Entrants
5.3.2 Threat of Substitutes
5.3.3 Bargaining Power of Suppliers
5.3.4 Bargaining Power of Buyers
5.3.5 Intensity of Competitive Rivalry
5.4 Macroeconomic Indicators
6 Opacifiers Market, By Type (Page No. - 43)
6.1 Introduction
6.1.1 Titanium Dioxide
6.1.1.1 Titanium Dioxide is the Dominating Segment of the Opacifiers Market in APAC
6.1.2 Opaque Polymers
6.1.2.1 Emerging Economies and Demand for Sustainable Products are Likely to Boost the Market
6.1.3 Zircon
6.1.3.1 Zircon is Mainly Used for Ceramics Application as Opacifiers
6.1.4 Zinc Oxide
6.1.4.1 The Growing Real Estate Sector is Expected to Propel the Zinc Oxide Market for Opacifiers
6.1.5 Cerium Oxide
6.1.5.1 The Ceramic Industry is Boosting the Cerium Oxide Market for Opacifiers in APAC
6.1.6 Antimony Trioxide
6.1.6.1 Antimony Trioxide is Widely Used in the Plastic and Ceramic Industries as Opacifiers
6.1.7 Tin Oxide
6.1.7.1 The Tin Oxide Market for Opacifiers is Witnessing A Declining Trend
6.1.8 Arsenic Trioxide
6.1.8.1 The Arsenic Trioxide Segment is Expected to Witness A Declining Trend Owing to the Increasing Regulations Against Its Usage
7 Opacifiers Market, By Application (Page No. - 53)
7.1 Introduction
7.1.1 Paints & Coatings
7.1.1.1 Titanium Dioxide and Opaque Polymers are Widely Used in the Paints & Coatings Application
7.1.2 Plastics
7.1.2.1 Emerging Economies in APAC are Contributing to the Market Growth in the Plastics Segment
7.1.3 Ceramics
7.1.3.1 The Large Manufacturing Base of Ceramics in China and India Drives the Opacifiers Market in APAC
7.1.4 Paper
7.1.4.1 The Growing Paper Industry is A Governing Factor for the Market Growth in This Segment
7.1.5 Inks
7.1.5.1 Titanium Dioxide is Used in Every Type of Printing Ink
7.1.6 Personal Care
7.1.6.1 Rising Disposable Income and Consumer Spending are Driving the Market in This Segment
7.1.7 Fibers
7.1.7.1 Large Production Base of Textiles in APAC is Boosting the Market in Fibers Application
7.1.8 Home Care
7.1.8.1 China and India are Supporting the Demand for Opacifiers in Home Care Application
7.1.9 Glass
7.1.9.1 The Rising Construction Industry Support the Demand for Opacifiers in Glass Application
7.1.10 Others
7.1.10.1 Europe is Expected to Be the Largest Market in Others Segment
8 Opacifiers Market, By Region (Page No. - 65)
8.1 Introduction
8.2 APAC
8.2.1 China
8.2.1.1 Paints & Coatings and Ceramics are the Major Applications of Opacifiers in the Country
8.2.2 India
8.2.2.1 Ceramics and Personal Care Applications Generate High Demand for Opacifiers in India
8.2.3 Japan
8.2.3.1 Steady Demand for Opacifiers is Attributed to the Growth of the Paints & Coatings and Personal Care Applications
8.2.4 South Korea
8.2.4.1 Home Care and Personal Care Segments are Expected to Support the Opacifiers Market Growth
8.2.5 Thailand
8.2.5.1 Increasing Industrialization Along With Social and Economic Development are Likely to Propel the Opacifiers Market Across Various Applications
8.2.6 Indonesia
8.2.6.1 Rapid Urbanization, High Infrastructure Spending, and Rise in Population are Driving the Demand for Opacifiers in Various Applications
8.2.7 Malaysia
8.2.7.1 Rising Income Level and Growing Population are Likely to Support the Market Growth
8.3 Europe
8.3.1 Germany
8.3.1.1 The Large Industrial Base of Plastic is Driving the German Opacifiers Market
8.3.2 Italy
8.3.2.1 Growing Construction and Personal Care Industries Support the Demand for Opacifiers in the Country
8.3.3 Spain
8.3.3.1 The Rising Demand for Personal Care Products is Driving the Opacifiers Market in Spain
8.3.4 France
8.3.4.1 The Growing Construction Industry Fuels the Demand for Opacifiers in the Paints & Coatings Application
8.3.5 UK
8.3.5.1 The Growing Construction Industry is Expected to Drive the UK Opacifiers Market
8.3.6 Russia
8.3.6.1 The Rising Manufacturing Base of Paints & Coatings and Increasing Construction Activities are Likely to Boost the Opacifiers Market
8.4 North America
8.4.1 US
8.4.1.1 Paints & Coatings and Plastics Applications are Driving the Opacifiers Market in the Country
8.4.2 Canada
8.4.2.1 Rising Construction Activities Boost the Demand for Opacifiers in the Paints & Coatings Application
8.4.3 Mexico
8.4.3.1 Increasing Production of Ceramics, Paints and Coatings, and Plastics are Expected to Support the Opacifiers Market
8.5 Middle East & Africa
8.5.1 Saudi Arabia
8.5.1.1 Increasing Construction Activities are Likely to Drive the Opacifiers Market Across Various Applications
8.5.2 Iran
8.5.2.1 Upcoming Petrochemical Projects are Expected to Propel the Opacifiers Market in Iran
8.5.3 South Africa
8.5.3.1 Rising Manufacturing Sector is Likely to Boost the South African Opacifiers Market
8.5.4 Turkey
8.5.4.1 Growing Housing Sector and Rapid Urbanization Drive the Opacifiers Market in the Country
8.6 South America
8.6.1 Brazil
8.6.1.1 Rising Industrial and Infrastructure Sectors are Likely to Drive the Opacifiers Market in Brazil
8.6.2 Argentina
8.6.2.1 High Demand for Paints and Coatings is Driving the Opacifiers Market in the Country
9 Competitive Landscape (Page No. - 110)
9.1 Overview
9.2 Competitive Situations and Trends
9.2.1 Expansion
9.2.2 Merger & Acquisition
9.2.3 Agreement
9.2.4 New Product Launch
9.3 Share of Players in Opacifiers Market
9.3.1 Market Share of Players in Titanium Dioxide Segment
9.3.2 Market Share of Players in Opaque Polymers Segment
9.3.3 Market Share of Players in Zircon Segment
10 Company Profiles (Page No. - 114)
(Business Overview, Products Offered, Recent Developments, SWOT Analysis, MnM View)*
10.1 Dowdupont
10.2 Arkema
10.3 Ashland Global Holdings
10.4 Tayca Corporation
10.5 Chemours
10.6 Tronox Limited
10.7 Kronos Worldwide
10.8 Cristal
10.9 Alkane Resources
10.10 En-Tech Polymer
*Details on Business Overview, Products Offered, Recent Developments, SWOT Analysis, MnM View Might Not Be Captured in Case of Unlisted Companies.
10.11 List of Other Players
10.11.1 Interpolymer Corporation
10.11.2 Organik Kimya
10.11.3 Croda International
10.11.4 Hankuck Latices
10.11.5 Indulor Chemie
10.11.6 Junneng Chemical
10.11.7 Evonik Industries
10.11.8 Cinkarna Celje
10.11.9 Lomon Billions
10.11.10 Ishihara Sangyo Kaisha
10.11.11 Grupa Azoty
10.11.12 Precheza As
10.11.13 Argex Titanium
10.11.14 Apollo Colors
11 Appendix (Page No. - 132)
11.1 Discussion Guide
11.2 Knowledge Store: Marketsandmarkets� Subscription Portal
11.3 Available Customizations
11.4 Related Reports
11.5 Author Details
List of Tables (121 Tables)
Table 1 Regional Urbanization Prospects
Table 2 Opacifiers Market Size, By Type, 2016�2023 (Kiloton)
Table 3 Opacifiers Market Size, By Type, 2016�2023 (USD Million)
Table 4 Titanium Dioxide Market Size for Opacifiers, By Region, 2016�2023 (Kiloton)
Table 5 Titanium Dioxide Market Size for Opacifiers, By Region, 2016�2023 (USD Million)
Table 6 Opaque Polymers Market Size for Opacifiers, By Region, 2016�2023 (Kiloton)
Table 7 Opaque Polymers Market Size for Opacifiers, By Region, 2016�2023 (USD Million)
Table 8 Zircon Market Size for Opacifiers, By Region, 2016�2023 (Kiloton)
Table 9 Zircon Market Size for Opacifiers, By Region, 2016�2023 (USD Million)
Table 10 Zinc Oxide Market Size for Opacifiers, By Region, 2016�2023 (Kiloton)
Table 11 Zinc Oxide Market Size for Opacifiers, By Region, 2016�2023 (USD Million)
Table 12 Cerium Oxide Market Size for Opacifiers, By Region, 2016�2023 (Kiloton)
Table 13 Cerium Oxide Market Size for Opacifiers, By Region, 2016�2023 (USD Million)
Table 14 Antimony Trioxide Market Size for Opacifiers, By Region, 2016�2023 (Kiloton)
Table 15 Antimony Trioxide Market Size for Opacifiers, By Region, 2016�2023 (USD Million)
Table 16 Tin Oxide Market Size for Opacifiers, By Region, 2016�2023 (Kiloton)
Table 17 Tin Oxide Market Size for Opacifiers, By Region, 2016�2023 (USD Million)
Table 18 Arsenic Trioxide Market Size for Opacifiers, By Region, 2016�2023 (Kiloton)
Table 19 Arsenic Trioxide Market Size for Opacifiers, By Region, 2016�2023 (USD Million)
Table 20 Opacifiers Market Size, By Application, 2016�2023 (Kiloton)
Table 21 Opacifiers Market Size, By Application, 2016�2023 (USD Million)
Table 22 By Market Size in Paints & Coatings Application, By Region, 2016�2023 (Kiloton)
Table 23 By Market Size in Paints & Coatings Application, By Region, 2016�2023 (USD Million)
Table 24 By Market Size in Plastics Application, By Region, 2016�2023 (Kiloton)
Table 25 By Market Size in Plastics Application, By Region, 2016�2023 (USD Million)
Table 26 By Market Size in Ceramics Application, By Region, 2016�2023 (Kiloton)
Table 27 By Market Size in Ceramics Application, By Region, 2016�2023 (USD Million)
Table 28 By Market Size in Paper Application, By Region, 2016�2023 (Kiloton)
Table 29 By Market Size in Paper Application, By Region, 2016�2023 (USD Million)
Table 30 By Market Size in Inks Application, By Region, 2016�2023 (Kiloton)
Table 31 By Market Size in Inks Application, By Region, 2016�2023 (USD Million)
Table 32 By Market Size in Personal Care Application, By Region, 2016�2023 (Kiloton)
Table 33 By Market Size in Personal Care Application, By Region, 2016�2023 (USD Million)
Table 34 By Market Size in Fibers Application, By Region, 2016�2023 (Kiloton)
Table 35 By Market Size in Fibers Application, By Region, 2016�2023 (USD Million)
Table 36 By Market Size in Home Care Application, By Region, 2016�2023 (Kiloton)
Table 37 By Market Size in Home Care Application, 2016�2023 (USD Million)
Table 38 By Market Size in Glass Application, By Region, 2016�2023 (Kiloton)
Table 39 By Market Size in Glass Application, By Region, 2016�2023 (USD Million)
Table 40 By Market Size in Other Applications, By Region, 2016�2023 (Kiloton)
Table 41 By Market Size in Other Applications, By Region, 2016�2023 (USD Million)
Table 42 By Market Size, By Region, 2016�2023 (Kiloton)
Table 43 By Market Size, By Region, 2016�2023 (USD Million)
Table 44 APAC: By Market Size, By Country, 2016�2023 (Kiloton)
Table 45 APAC: By Market Size, By Country, 2016�2023 (USD Million)
Table 46 APAC: By Market Size, By Type, 2016�2023 (Kiloton)
Table 47 APAC: By Market Size, By Type, 2016�2023 (USD Million)
Table 48 APAC: By Market Size, By Application, 2016�2023 (Kiloton)
Table 49 APAC: By Market Size, By Application, 2016�2023 (USD Million)
Table 50 China: By Market Size, By Application, 2016�2023 (Kiloton)
Table 51 China: By Market Size, By Application, 2016�2023 (USD Million)
Table 52 India: By Market Size, By Application, 2016�2023 (Kiloton)
Table 53 India: By Market Size, By Application, 2016�2023 (USD Million)
Table 54 Japan: By Market Size, By Application, 2016�2023 (Kiloton)
Table 55 Japan: By Market Size, By Application, 2016�2023 (USD Million)
Table 56 South Korea: By Market Size, By Application, 2016�2023 (Kiloton)
Table 57 South Korea: By Market Size, By Application, 2016�2023 (USD Million)
Table 58 Thailand: By Market Size, By Application, 2016�2023 (Kiloton)
Table 59 Thailand: By Market Size, By Application, 2016�2023 (USD Million)
Table 60 Indonesia: By Market Size, By Application, 2016�2023 (Kiloton)
Table 61 Indonesia: By Market Size, By Application, 2016�2023 (USD Million)
Table 62 Malaysia: By Market Size, By Application, 2016�2023 (Kiloton)
Table 63 Malaysia: By Market Size, By Application, 2016�2023 (USD Million)
Table 64 Europe: By Market Size, By Country, 2016�2023 (Kiloton)
Table 65 Europe: By Market Size, By Country, 2016�2023 (USD Million)
Table 66 Europe: By Market Size, By Type, 2016�2023 (Kiloton)
Table 67 Europe: By Market Size, By Type, 2016�2023 (USD Million)
Table 68 Europe: By Market Size, By Application, 2016�2023 (Kiloton)
Table 69 Europe: By Market Size, By Application, 2016�2023 (USD Million)
Table 70 Germany: By Market Size, By Application, 2016�2023 (Kiloton)
Table 71 Germany: By Market Size, By Application, 2016�2023 (USD Million)
Table 72 Italy: By Market Size, By Application, 2016�2023 (Kiloton)
Table 73 Italy: By Market Size, By Application, 2016�2023 (USD Million)
Table 74 Spain: By Market Size, By Application, 2016�2023 (Kiloton)
Table 75 Spain: By Market Size, By Application, 2016�2023 (USD Million)
Table 76 France: By Market Size, By Application, 2016�2023 (Kiloton)
Table 77 France: By Market Size, By Application, 2016�2023 (USD Million)
Table 78 UK: By Market Size, By Application, 2016�2023 (Kiloton)
Table 79 UK: By Market Size, By Application, 2016�2023 (USD Million)
Table 80 Russia: By Market Size, By Application, 2016�2023 (Kiloton)
Table 81 Russia: By Market Size, By Application, 2016�2023 (USD Million)
Table 82 North America: By Market Size, By Country, 2016�2023 (Kiloton)
Table 83 North America: By Market Size, By Country, 2016�2023 (USD Million)
Table 84 North America: By Market Size, By Type, 2016�2023 (Kiloton)
Table 85 North America: By Market Size, By Type, 2016�2023 (USD Million)
Table 86 North America: By Market Size, By Application, 2016�2023 (Kiloton)
Table 87 North America: By Market Size, By Application, 2016�2023 (USD Million)
Table 88 US: By Market Size, By Application, 2016�2023 (Kiloton)
Table 89 US: By Market Size, By Application, 2016�2023 (USD Million)
Table 90 Canada: By Market Size, By Application, 2016�2023 (Kiloton)
Table 91 Canada: By Market Size, By Application, 2016�2023 (USD Million)
Table 92 Mexico: By Market Size, By Application, 2016�2023 (Kiloton)
Table 93 Mexico: By Market Size, By Application, 2016�2023 (USD Million)
Table 94 Middle East & Africa: By Market Size, By Country, 2016�2023 (Kiloton)
Table 95 Middle East & Africa: By Market Size, By Country, 2016�2023 (USD Million)
Table 96 Middle East & Africa: By Market Size, By Type, 2016�2023 (Kiloton)
Table 97 Middle East & Africa: By Market Size, By Type, 2016�2023 (USD Million)
Table 98 Middle East & Africa: By Market Size, By Application, 2016�2023 (Kiloton)
Table 99 Middle East & Africa: By Market Size, By Application, 2016�2023 (USD Million)
Table 100 Saudi Arabia: By Market Size, By Application, 2016�2023 (Kiloton)
Table 101 Saudi Arabia: By Market Size, By Application, 2016�2023 (USD Million)
Table 102 Iran: By Market Size, By Application, 2016�2023 (Kiloton)
Table 103 Iran: By Market Size, By Application, 2016�2023 (USD Million)
Table 104 South Africa: By Market Size, By Application, 2016�2023 (Kiloton)
Table 105 South Africa: By Market Size, By Application, 2016�2023 (USD Million)
Table 106 Turkey: By Market Size, By Application, 2016�2023 (Kiloton)
Table 107 Turkey: By Market Size, By Application, 2016�2023 (USD Million)
Table 108 South America: Opacifiers Market Size, By Country, 2016�2023 (Kiloton)
Table 109 South America: Opacifiers Market Size, By Country, 2016�2023 (USD Million)
Table 110 South America: Opacifiers Market Size, By Type, 2016�2023 (Kiloton)
Table 111 South America: Opacifiers Market Size, By Type, 2016�2023 (USD Million)
Table 112 South America: Opacifiers Market Size, By Application, 2016�2023 (Kiloton)
Table 113 South America: Opacifiers Market Size, By Application, 2016�2023 (USD Million)
Table 114 Brazil: By Market Size, By Application, 2016�2023 (Kiloton)
Table 115 Brazil: By Market Size, By Application, 2016�2023 (USD Million)
Table 116 Argentina: By Market Size, By Application, 2016�2023 (Kiloton)
Table 117 Argentina: By Market Size, By Application, 2016�2023 (USD Million)
Table 118 Expansion, 2016�2017
Table 119 Merger & Acquisition, 2017
Table 120 Agreement, 2014
Table 121 New Product Launch, 2016
List of Figures (30 Figures)
Figure 1 Opacifiers Market: Research Design
Figure 2 Market Size Estimation: Bottom-Up Approach
Figure 3 Market Size Estimation: Top-Down Approach
Figure 4 Opacifiers Market: Data Triangulation
Figure 5 Titanium Dioxide to Be the Largest Segment of the Opacifiers Market
Figure 6 Paints & Coatings to Be the Largest Application
Figure 7 APAC Dominated the Opacifiers Market in 2017
Figure 8 Growing Application Areas Offer Opportunities in the Opacifiers Market
Figure 9 APAC to Be the Fastest-Growing Market
Figure 10 Paints & Coatings to Be the Largest Application of Opacifiers in APAC
Figure 11 China to Be the Fastest-Growing Opacifiers Market
Figure 12 Paints & Coatings Segment Leads the Opacifiers Market
Figure 13 Drivers, Restraints, and Opportunities of the Opacifiers Market
Figure 14 Opacifiers Market: Porter�s Five Forces Analysis
Figure 15 APAC: Opacifiers Market Snapshot
Figure 16 Europe: Opacifiers Market Snapshot
Figure 17 Companies Adopted Expansion as the Key Growth Strategy Between 2014 and 2017
Figure 18 Dowdupont: Company Snapshot
Figure 19 Dowdupont: SWOT Analysis
Figure 20 Arkema: Company Snapshot
Figure 21 Arkema: SWOT Analysis
Figure 22 Ashland Global Holdings: Company Snapshot
Figure 23 Ashland Global Holdings: SWOT Analysis
Figure 24 Tayca Corporation: Company Snapshot
Figure 25 Tayca Corporation: SWOT Analysis
Figure 26 Chemours: Company Snapshot
Figure 27 Chemours: SWOT Analysis
Figure 28 Tronox Limited: Company Snapshot
Figure 29 Kronos Worldwide: Company Snapshot
Figure 30 Alkane Resources: Company Snapshot
The study involved four major activities to estimate the market size for opacifiers. Exhaustive secondary research was done to collect information on the market, the peer market, and the parent market. The next step was to validate these findings, assumptions, and sizing with industry experts across the value chain through primary research. Both top-down and bottom-up approaches were employed to estimate the complete market size. Thereafter, the market breakdown and data triangulation procedures were used to estimate the market size of the segments and subsegments.
Secondary Research
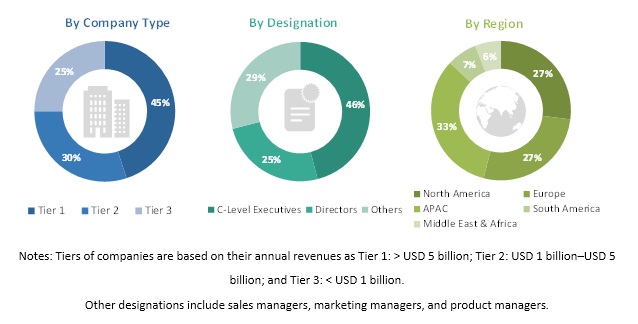
Secondary sources used in this study included annual reports, press releases, and investor presentations of companies; white papers; certified publications; articles from recognized authors; and gold standard & silver standard websites such as Factiva, ICIS, Bloomberg, and others. Findings of this study were verified through primary research by conducting extensive interviews with key officials such as CEOs, VPs, directors, and other executives. The breakdown of profiles of the primary interviewees is illustrated in the figure below:
Primary Research
The opacifiers market comprises several stakeholders such as raw material suppliers, end-product manufacturers, and regulatory organizations in the supply chain. The demand side of this market is characterized by the development of paints & coatings, plastics, ceramics, paper, inks, fibers, personal care, home care, and glass industries. The supply side is characterized by advancements in technology and diverse application industries. Various primary sources from both the supply and demand sides of the market were interviewed to obtain qualitative and quantitative information.
To know about the assumptions considered for the study, download the pdf brochure
Market Size Estimation
Both top-down and bottom-up approaches were used to estimate and validate the total size of the opacifiers market. These methods were also used extensively to estimate the size of various subsegments in the market. The research methodology used to estimate the market size includes the following:
The key players in the industry have been identified through extensive secondary research.
n The industry�s supply chain and market size, in terms of volume and value, were determined through primary and secondary research processes.
n All percentage shares, splits, and breakdowns were determined using secondary sources and verified through primary sources.
Data Triangulation
After arriving at the overall market size-using the market size estimation processes as explained above�the market was split into several segments and subsegments. In order to complete the overall market engineering process and arrive at the exact statistics of each market segment and subsegment, the data triangulation and market breakdown procedures were employed, wherever applicable. The data was triangulated by studying various factors and trends from both the demand and supply sides in paints & coatings, plastics, ceramics, paper, inks, fibers, personal care, home care, and glass industries.Report Objectives
- To analyze and forecast the size of the opacifiers market in terms volume and value
- To provide detailed information regarding key factors, such as drivers, restraints, and opportunities influencing the growth of the market
- To define, describe, and segment the opacifiers market on the basis of type and application
- To forecast the size of the market segments for regions such as APAC, North America, Europe, South America, and the Middle East & Africa
- To strategically analyze the segmented markets with respect to individual growth trends, prospects, and contribution to the overall market
- To identify and analyze opportunities for stakeholders in the market
- To analyze competitive developments such as expansions, new product launches, mergers & acquisitions in the opacifiers market
- To strategically profile key players and comprehensively analyze their core competencies
Scope Of The Report
|
| |
|
| |
|
| |
|
| |
|
| |
|
| |
|
| |
|
|
This report categorizes the global opacifiers market based on type, application, and region.
On the basis of Type, the opacifiers market has been segmented as follows:
- Titanium Dioxide
- Opaque Polymers
- Zircon
- Zinc Oxide
- Cerium Oxide
- Antimony Trioxide
- Tin Oxide
- Arsenic Trioxide
On the basis of Application, the opacifiers market has been segmented as follows:
- Paints & Coatings
- Plastics
- Ceramics
- Paper
- Inks
- Fibers
- Personal Care
- Home Care
- Glass
- Others (Food and Pharmaceuticals)
On the basis of region, the opacifiers market has been segmented as follows:
- APAC
- North America
- Europe
- Middle East & Arica
- South America
Available Customizations
Along with the given market data, MarketsandMarkets offers customizations according to the company�s specific needs. The following customization options are available for the report:
Regional Analysis
- Further breakdown of a region with respect to a particular country or additional end-use industry
Company Information
- Detailed analysis and profiles of additional market players (up to five)


Growth opportunities and latent adjacency in Opacifiers Market