Packaged Substation Market by voltage Split (below 36kV and above 36kV to 150kV), by Application (Industrial, Infrastructure, and Power Utilities & Generation) and by Region - Global Trends and Forecasts to 2019


A packaged substation is an integral part of the electric power distribution system. The power sector offers a promising future with growing demands for electricity, following increasing urbanization and industrialization in the developed as well as developing nations. Packaged substations form a crucial part in the power sector across distribution and equipment protection segments. A packaged substation is employed to minimize space utilization, (step-up or step-down) transform voltage, and protect equipment in the event of abnormalities.
The packaged substation market has been segmented on the basis of type, application, and region. The market on the basis of application has been segmented into industries, infrastructure, and power.
Packaged substations are preferred over conventional ones as they require minimum installation space, minimum installation time, ready-to-use on delivery, efficient as compared to conventional substations, and are more cost-effective.
Leading players in the packaged substation market, with their recent developments and other strategic industry activities, have been profiled in the report. These companies include ABB Ltd. (Switzerland), Schneider Electric SE (France), Eaton Corporation (Ireland), GE (U.S.), and Siemens AG (Germany).
Asia-Pacific is expected to be a lucrative market with an estimated value of $445,903.21 million by 2019.
Packaged Substation Market Size, by Application, 2014 & 2019 ($Billion)
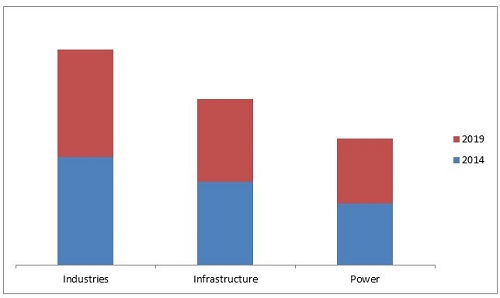
Source: Press Releases and MarketsandMarkets Analysis
This packaged substation market is projected to be promising for industries owing to urbanization and industrialization in developed regions. Infrastructure is expected to be the second-most growing application for packaged substations; power generation is likely to have a considerable share in the market as well.
The packaged substation market has also been analyzed with respect to Porter's Five Force model. Analysis of the sector�s value chain and the various factors affecting the stages of the value chain has been tracked to assess and evaluate the Five Forces of the Porter�s model. The report also describes the competitive landscape of major market players that includes new product developments, mergers and acquisition, facility expansion, agreements and collaborations, and contracts. Key developments have been mapped against the involved market players, to determine the growth strategies implemented by the leaders within the segment. The report also classifies and defines the value of packaged substations and power distribution system and the parent market segment of packaged substations. This study also provides a comprehensive review of the major market drivers, restraints, opportunities, winning imperatives, and key burning issues in the packaged substation market.
Scope of the Report:
The global packaged substation market has been analyzed in terms of revenue ($million) for the following types, applications, and regions.
By Type
- Below 36 kV
- 36-150 kV
By Application
- Industries
- Infrastructure
- Power
By Region
- North America
- Europe
- Asia-Pacific
- The Middle East
- South & Central America
- Africa
Packaged substation are mostly used in distribution networks to supply power to consumers. Major benefits associated with the use of this equipment are better voltage transformation, minimum space requirements, effective fault monitoring and control, lower losses as compared to, both aggregate technical & commercial, and remote access to information regarding supply and fault conditions. It is also very cost effective as compared to conventional substation as the equipment is assembled by the same manufacturer; hence the process of procurement is also very simplified.
The global packaged substation market is projected to exhibit high growth on account of growing urbanization and rise in the number of upgrades on electrical infrastructure, influenced by increasing energy demand. The market is expected to be valued at $6.89 million globally in 2014. It is projected to grow at a CAGR of 10.19% during the forecast period.
Asia-Pacific holds the major market share, followed by North America & Europe. In terms of individual countries, the U.S. is expected to dominate the market in 2014 on account of extensive electrical infrastructure upgrades and installation of distribution utilities. The U.S. alone is estimated to hold more than 15% of the global packaged substation market in 2014. Rapid growth in the BRIC nations' economies is expected to be the major driving factor for the development of power sector in these nations. China and India are the leading countries that are undergoing rapid transformation with huge developments in infrastructure and grid expansion.Packaged substations are expected to be used extensively in the new electrical distribution networks, which are expected to ensure minimum losses and uninterrupted power supply.
The industries application holds the major market share in 2014 as packaged substations are used extensively by industries. Along with the capacity enhancement trending worldwide, investment distributed generation and distribution are expected to drive the market.
Packaged Substation Market Share, by Region, 2014 (Units)
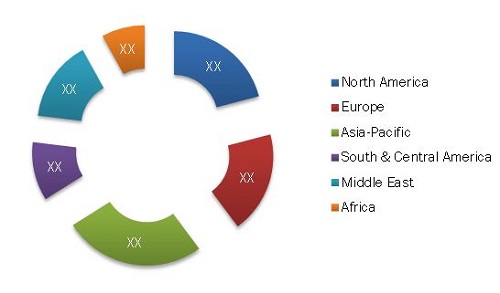
Source: MarketsandMarkets Analysis
The packaged substation industry is very fragmented and offers opportunities for consolidation. This can be seen as several major M&A activities are taking place in the industry, as well as subsidiary formation by big players. There are few industry leaders disconcerted over the optimal growth strategy for this market. In this industry, most players are global multinational companies, though there are growing number of local competitors that offer packaged substations with high customization and suitability of local requirements.
The top five companies in the packaged substation industry include ABB Ltd. (Switzerland), Eaton Corporation (Ireland), GE (U.S.), Siemens AG (Germany), and Schneider Electric SA (France).
 Exclusive indicates content/data unique to MarketsandMarkets and not available with any competitors.
Table of Content
1. Introduction
1.1. Objectives of the Study
1.2. Report Description
1.3. Markets Covered
1.4. Stakeholders
1.5. Market Scope
2. Research Methodology
2.1. Description of the Packaged Substation Market
2.2. Market Size Estimation
2.3. Market Crackdown & Data Triangulation
2.4. Market Share Estimation
2.4.1. Key Data Points Taken From Secondary Sources
2.4.2. Key Data Points From Primary Sources
2.4.2.1. Key Industry Insights
2.5. Assumptions
3. Executive Summary
4. Premium Insights
5. Market Overview
5.1. Introduction
5.2. Packaged Substation Segment Evolution
5.3. Market Segmentation
5.3.1. PSS Market By Type
5.3.2. PSS Market By Application
5.3.3. PSS Market By Geography
5.4. Market Dynamics
5.4.1. Drivers
5.4.1.1. Growing Industrialization and Urbanization
5.4.1.2. Rise in Power Demand and Reducing Space Availability
5.4.1.3. Reduced Losses in Power Distribution System
5.4.1.4. Cost Effectiveness
5.4.2. Restraints
5.4.2.1. Low Acceptance Level
5.4.3. Opportunities
5.4.3.1. Urban Infrastructure Development
5.4.4. Challenges
5.4.4.1. Cheap and Low Quality Products
6. Industry Trends
6.1. Introduction
6.2. Value Chain Analysis
6.3. Supply Chain Analysis
6.4. Industry Trends
6.4.1. Packaged Substation Industry Overview
6.5. Porter�s Five Forces Analysis
6.5.1. Threat of New Entrants
6.5.2. Threat From Substitutes
6.5.3. Bargaining Power of Suppliers
6.5.4. Bargaining Power of Buyers
6.5.5. Intensity of Competitive Rivalry
7. Global PSS Market By Type
7.1. Introduction
7.2. Below 36 KV
7.3. 36-150 KV
8. Global PSS Market By Application
8.1. Industries
8.2. Infrastructure
8.3. Power
9. Global PSSmarket, By Geography
9.1. Introduction
9.2. North America
9.2.1. U.S.
9.2.1.1. U.S. Market By Type
9.2.1.2. U.S. Market By Application
9.2.2. Canada
9.2.2.1. Canada Market By Type
9.2.2.2. Canada Market By Application
9.2.3. Mexico
9.2.3.1. Mexico Market By Type
9.2.3.2. Mexico Market By Application
9.3. Europe
9.3.1. Germany
9.3.1.1. Germany Market By Type
9.3.1.2. Germany Market By Application
9.3.2. France
9.3.2.1. France Market By Type
9.3.2.2. France Market By Application
9.3.3. U.K.
9.3.3.1. U.K. Market By Type
9.3.3.2. U.K. Market By Application
9.3.4. Others
9.3.4.1. Others Market By Type
9.3.4.2. Others Market By Application
9.4. Middle East
9.4.1. U.A.E.
9.4.1.1. U.A.E Market By Type
9.4.1.2. U.A.E Market By Application
9.4.2. Kuwait
9.4.2.1. Kuwait Market By Type
9.4.2.2. Kuwait Market By Application
9.4.3. Saudi Arabia
9.4.3.1. Saudi Arabia Market By Type
9.4.3.2. Saudi Arabia Market By Application
9.4.4. Others
9.4.4.1. Others Market By Type
9.4.4.2. Others Market By Application
9.5. Asia-Pacific
9.5.1. Australia
9.5.1.1. Australia Market By Type
9.5.1.2. Australia Market By Application
9.5.2. China
9.5.2.1. China Market By Type
9.5.2.2. China Market By Application
9.5.3. India
9.5.3.1. India Market By Type
9.5.3.2. India Market By Application
9.5.4. Japan
9.5.4.1. Japan Market By Type
9.5.4.2. Japan Market By Application
9.5.5. Others
9.5.5.1. Others Market By Type
9.5.5.2. Others Market By Application
9.6. South and Central America
9.6.1. Brazil
9.6.1.1. Brazil Market By Type
9.6.1.2. Brazil Market By Application
9.6.2. Argentina
9.6.2.1. Argentina Market By Type
9.6.2.2. Argentina Market By Application
9.6.3. Others
9.6.3.1. Others Market By Type
9.6.3.2. Others Market By Application
9.7. Africa
9.7.1. South Africa
9.7.1.1. South Africa Market By Type
9.7.1.2. South Africa Market By Application
9.7.2. Others
9.7.2.1. Others Market By Type
9.7.2.2. Others Market By Application
10. Competitive Landscape
10.1. Introduction
10.2. Strategic Benchmarking
10.2.1. Technology Integration & Product Enhancement
10.3. Key Players of the Packaged Substation Market
10.3.1. Regional Analysis
10.3.2. Key Companies� Focus Area
10.4. Most Active Companies in the PSS Market
11. Company Profiles
11.1. ABB Ltd
11.2. Alstom
11.3. Asia Electrical Power Equipment (Shenzhen) Co., Ltd.
11.4. Crompton Greaves Limited
11.5. Eaton Corporation
11.6. General Electric Company
11.7. Larsen & Toubro Ltd.
11.8. Littlefuse Inc.
11.9. Lucy Electric
11.10. Schneider Electric SA
11.11. Siemens AG
11.12. Toshiba Corporation
List of Tables (97 Tables)
Table 1 Basic Property of Packaged Substation Types
Table 2 Urbanization and Industrialization is the Driving Forces of the Market
Table 3low Acceptance is the Major Restraining Force for the Global Market
Table 4 Urban Infrastructure Development Offers High Growth Opportunities for Manufacturers
Table 5 Cheap and Low Quality Products A Challenge for the Industry
Table 6 Packaged Substation Market Size, By Type, 2014-2019 (Units)
Table 7 Market Size, By Type, 2014-2019 ($Million)
Table 8 Below 36 KV Packaged Substation Market Size, By Region, 2014-2019 (Units)
Table 9 Below 36 KV Packaged Substation Market Size, By Region, 2014-2019 ($Million)
Table 10 36-150 KV Packaged Substation Market Size, By Region, 2014-2019 (Units)
Table 11 36-150 KV Packaged Substation Market Size, By Region, 2014-2019 ($Million)
Table 12 Packaged Substation Market Size, By Application, 2012-2019 (Units)
Table 13 Industries Market Size, By Region, 2012-2019 (Units)
Table 14 Infrastructure Market Size, By Region, 2012-2019 (Units)
Table 15 Power Market Size, By Region, 2012-2019 (Units)
Table 16 Packaged Substation Market Size, By Region, 2012-2019 (Units)
Table 17 North America: Packaged Substation Market Size, By Country, 2012-2019 (Units)
Table 18 North America: Market Size, By Country, 2012-2019 ($Million)
Table 19 U.S.: Net Generation By Energy Source, 2012-2014 (Thousand Megawatt-Hours)
Table 20 U.S.: Packaged Substation Market Size, By Type, 2012-2019 (Units)
Table 21 U.S.: Packaged Substation Market Size, By Type, 2012-2019 ($Million)
Table 22 U.S.: Packaged Substation Market Size, By Application, 2012-2019 (Units)
Table 23 Canada: Packaged Substation, By Market Size, By Type, 2012-2019 (Units)
Table 24 Canada: Packaged Substation, By Market Size, By Type, 2012-2019 ($Million)
Table 25 Canada: Packaged Substation Market Size, By Application, 2012-2019 (Units)
Table 26 Mexico: Packaged Substation By Market Size, By Type, 2012-2019 (Units)
Table 27 Mexico: Packaged Substation Market Size, By Type, 2012-2019 ($Million)
Table 28 Mexico: Packaged Substation Market Size, By Application, 2012-2019 (Units)
Table 29 Europe: Packaged Substation, By Market Size, By Country, 2012-2019 (Units)
Table 30 Europe: Packaged Substation Market Size, By Country, 2012-2019 ($Million)
Table 31 U.K.: Packaged Substation, By Market Size, By Type, 2012-2019 (Units)
Table 32 U.K.: Packaged Substation, By Market Size, By Type, 2012-2019 ($Million)
Table 33 U.K.: Packaged Substation Market Size, By Application, 2012-2019 (Units)
Table 34 Germany: Packaged Substation, By Market Size, By Type, 2012-2019 (Units)
Table 35 Germany: Packaged Substation Market Size, By Type, 2012-2019 ($Million)
Table 36 Germany: Market Size, By Application, 2012-2019 (Units)
Table 37 France: Packaged Substation Market Size, By Type, 2012-2019 (Units)
Table 38 France: Market Size, By Type, 2012-2019 ($Million)
Table 39 France: Market Size, By Application, 2012-2019 (Units)
Table 40 Rest of Europe: Market Size, By Type, 2012-2019 (Units)
Table 41 Rest of Europe: Market Size, By Type, 2012-2019 ($Million)
Table 42 Rest of Europe: Market Size, By Application, 2012-2019(Units)
Table 43 South and Central America: Market Size, By Country, 2012-2019(Units)
Table 44 South and Central America: Market Size, By Country, 2012-2019($Million)
Table 45 Brazil: Market Size, By Type, 2012-2019 (Units)
Table 46 Brazil: Market Size, By Type, 2012-2019 ($Million)
Table 47 Brazil: Market Size, By Application, 2012-2019 (Units)
Table 48 Argentina: Market Size, By Type, 2012-2019 (Units)
Table 49 Argentina: Market Size, By Type, 2012-2019 ($Million)
Table 50 Argentina: Market Size, By Application, 2012-2019 (Units)
Table 51 Rest of South and Central America: Market Size, By Type, 2012-2019(Units)
Table 52 Rest of South and Central America: Market Size, By Type, 2012-2019($Million)
Table 53 Rest of South and Central America: Market Size, By Application, 2012-2019 (Units)
Table 54 Middle East: Market Size, By Country, 2012-2019 (Units)
Table 55 Middle East: Market Size, By Country, 2012-2019 ($Million)
Table 56 UAE: Market Size, By Type, 2012-2019 (Units)
Table 57 UAE: Market Size, By Type, 2012-2019 ($Million)
Table 58 UAE: Market Size, By Application, 2012-2019 (Units)
Table 59 Saudi Arabia: Market Size, By Type, 2012-2019 (Units)
Table 60 Saudi Arabia: Market Size, By Type, 2012-2019 ($Million)
Table 61 Saudi Arabia: Market Size, By End User, 2012-2019 (Units)
Table 62 Kuwait: Market Size, By Type, 2012-2019 (Units)
Table 63 Kuwait: Market Size, By Type, 2012-2019 ($Million)
Table 64 Kuwait: Market Size, By Application, 2012-2019 (Units)
Table 65 Rest of the Middle East: Market Size, By Type, 2012- 2019 (Units)
Table 66 Rest of the Middle East: Market Size, By Type, 2012- 2019 ($Million)
Table 67 Rest of the Middle East: Market Size, By Application, 2012-2019 (Units)
Table 68 Asia-Pacific: Market Size, By Country, 2012-2019 (Units)
Table 69 Asia-Pacific: Market Size, By Country, 2012-2019 ($Million)
Table 70 China: Market Size, By Type, 2012-2019 (Units)
Table 71 China: Market Size, By Type, 2012-2019 ($Million)
Table 72 China: Market Size, By Application, 2012-2019 (Units)
Table 73 India: Packaged Substation Market Size, By Type, 2012-2019 (Units)
Table 74 India: Market Size, By Type, 2012-2019 ($Million)
Table 75 India:Market Size, By Application, 2012-2019 (Units)
Table 76 Australia: Packaged Substation Market Size, By Type, 2012-2019 (Units)
Table 77 Australia: Market Size, By Type, 2012-2019 ($Million)
Table 78 Australia: Packaged Substation Market Size, By Application, 2012-2019 (Units)
Table 79 Japan: Packaged Substation Market Size, By Type, 2012-2019 (Units)
Table 80 Japan: Packaged Substation Market Size, By Type, 2012-2019 ($Million)
Table 81 Japan: Packaged Substation Market Size, By Application, 2012-2019 (Units)
Table 82 Rest of Asia-Pacific: Packaged Substation Market Size, By Type, 2012-2019 (Units)
Table 83 Rest of Asia-Pacific: Packaged Substation Market Size, By Type, 2012-2019 ($Million)
Table 84 Rest of Asia-Pacific: Packaged Substation Market Size, By Application, 2012-2019 (Units)
Table 85 Africa: Packaged Substation Market Size, By Country, 2012-2019 (Units)
Table 86 Africa: Packaged Substation Market Size, By Country, 2012-2019 ($Million)
Table 87 South Africa: Packaged Substation Market Size, By Type, 2012-2019 (Units)
Table 88 South Africa: Packaged Substation Market Size, By Type, 2012-2019 ($Million)
Table 89 South Africa: Packaged Substation Market Size, By Application, 2012-2019 (Units)
Table 90 Rest of Africa: Packaged Substation Market Size, By Type, 2012-2019 (Units)
Table 91 Rest of Africa: Packaged Substation Market Size, By Type, 2012-2019 ($Million)
Table 92 Rest of Africa: Packaged Substation Market Size, By Application, 2012-2019 (Units)
Table 93 New Product Launch, 2011-2014
Table 94 Partnerships/Agreements/Collaborations, 2011-2014
Table 95 Mergers & Acquisitions, 2011-2014
Table 96 Expansion, 2011-2014
Table 97 Recent Developments
List of Figures (54 Figures)
Figure 1 Global Packaged Substation Market Segmentations
Figure 2 Global Packaged Substation Market: Research Methodology
Figure 3 World Energy Consumption, 1990-2040 (Quadrillion Btu)
Figure 4 Market Size Estimation Methodology: Bottom-Up Approach
Figure 5 Market Size Estimation Methodology: Top-Down Approach
Figure 6 Packaged Substation Market Snapshot (2013 vs.2018):
Figure 7 Packaged Substation Market Size, By Application, 2014 (Units)
Figure 8 Packaged Substation Market Share, By Geography, 2014
Figure 9 Asia-Pacific Will Remain the Largest and Fastest Growing Market
Figure 10 Industries Segment Will Continue to Dominate the Packaged Substation Market in the Next Five Years
Figure 11 Developing Economies to Grow Faster Than the Developed Economies
Figure 12 36-150 KV Segment Has Promising Future in Emerging Economies of the Asia-Pacific Region
Figure 13 Markets in Middle East Soon to Enter Exponential Growth Phase in the Forecast Period
Figure 14 Packaged Substation evolution: Timeline
Figure 15 Packaged Substation Market Segmentation: By Application
Figure 16 Packaged Substation Market Segmentation: By Type
Figure 17 Packaged Substation Market Segmentation: By Geography
Figure 18 Packaged Substation: Selection Parameters
Figure 19 Urbanization and Industrialization Will Propel the Market
Figure 20 Value Chain Analysis (2013): Major Value Addition is Occurs During Manufacturing and Assembly Phase
Figure 21 Supply Chain:
Figure 22 Shift From Conventional Substation to Packaged Substation
Figure 23 Porter's Five Forces Analysis (2014)
Figure 24 36-150 KV Packaged Substations Are Expected to Increase Their Market Share By 2019
Figure 25 Below 36 KV Packaged Substations Market is Expected to Grow in Asia-Pacific By 2019
Figure 26 Industries Are the Largest Market for Packaged Substation
Figure 27 Rapid Urbanization in Asia-Pacific Region is Fueling the Growth of Packaged Substation Market
Figure 28 Asia-Pacific is the Largest Consumer of Industrial Packaged Substation
Figure 29 Substantial Growth Projected in the Use of Packaged Substations
Figure 30 Urbanization and Modernization to Push the Growth of Packaged Substations Market
Figure 31 Geographic Snapshot (2013) � Rapid Growth Markets Are Emerging as New Hot Spots
Figure 32 China � an Attractive Destination for All Application
Figure 33 Companies Adopted Partnerships/Agreements/Collaborations as the Key Growth Strategy Over the Last Three Years
Figure 34 Market Share Analysis of the Top Players,2013
Figure 35 Battle for Market Share: Partnerships/Agreements/Collaborations is the Key Strategy(2011-2014)
Figure 36 Geographic Revenue Mix of Top Five Players
Figure 37 ABB Ltd.: Company Snapshot
Figure 38 ABB Ltd.: SWOT Analysis
Figure 39 Alstom: Business Overview
Figure 40 Asia Electrical Power Equipment (Shenzhen) Co., Ltd.: Company Snapshot
Figure 41 Crompton Greaves Limited: Company Snapshot
Figure 42 Eaton Corporation: Company Snapshot
Figure 43 Eaton Corporation: SWOT Analysis
Figure 44 General Electric: Company Snapshot
Figure 45 General Electric: SWOT Analysis
Figure 46 Larsen & Toubro Ltd.: Company Snapshot
Figure 47 Littlefuse Inc.: Company Snapshot
Figure 48 Lucy Electric: Company Snapshot
Figure 49 Schneider Electric SA: Company Snapshot
Figure 50 Schneider Electric SA: SWOT Analysis
Figure 51 Siemens AG: Company Snapshot
Figure 52 Siemens AG: SWOT Analysis
Figure 53 Schneider Electric SA: SWOT Analysis
Figure 54 Toshiba Corporation: Company Snapshot


Growth opportunities and latent adjacency in Packaged Substation Market