
Switchgear Market

Switchgear Market by Insulation (Gas-insulated, Air-insulated), Installation (Indoor, Outdoor), Current (AC, DC), Voltage (Low, Medium, High), End User (T&D Utilities, Industries, Commercial & Residential, Data center) and Region - Global Forecast to 2030


OVERVIEW
Source: Secondary Research, Interviews with Experts, MarketsandMarkets Analysis
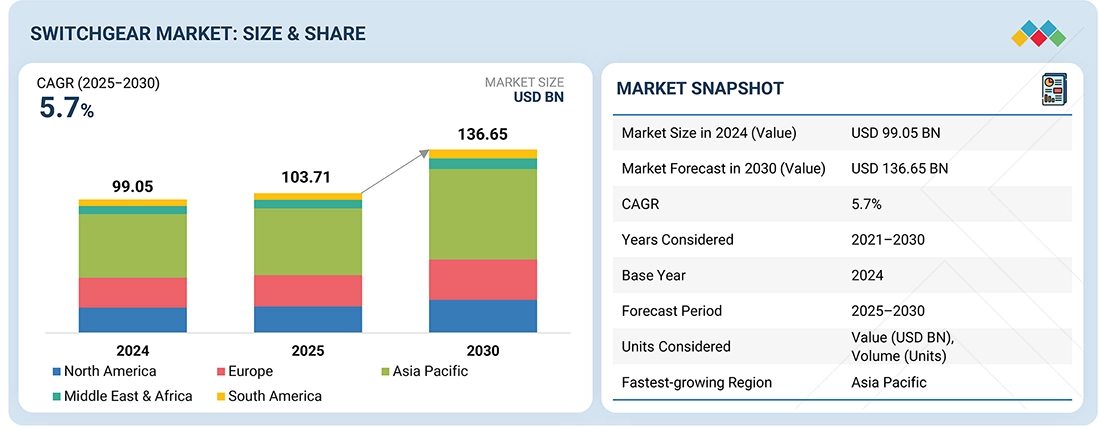
The global switchgear market is expected to reach USD 103.71 billion in 2025 and grow to USD 136.65 billion by 2030, with a CAGR of 5.7% during the forecast period. The demand for global switchgear is driven by the increasing need for reliable and efficient power distribution systems amid rising electricity use across residential, commercial, and industrial sectors.
Switchgear Market Size and Forecast:
- Market Size Value in 2024: USD 99.05 Billion
- Market Size Value in 2025: USD 103.71 Billion
- Revenue Forecast in 2030: USD 136.65 Billion
- Growth Rate: CAGR of 5.7% from 2025 to 2030
- Data available from 2021 to 2030
- The air-insulated switchgear segment holds the largest market share due to its cost-effectiveness, ease of installation, and widespread use across transmission, distribution, and industrial applications.
Key Market Trends and Insights
- Market Growth: Driven by increasing demand for reliable and uninterrupted power supply, rising investments in grid modernization, and rapid urbanization and industrialization across emerging economies.
- Growing Trends: Adoption of digital and smart switchgear solutions with IoT-enabled monitoring, predictive maintenance, and advanced automation capabilities is gaining momentum worldwide.
- Growth Opportunities: Expanding renewable energy integration, increasing investments in data centers, and the replacement of aging electrical infrastructure are creating significant market opportunities.
- Market Share Analysis: The air-insulated switchgear (AIS) segment accounts for the largest market share in 2025 owing to its affordability and operational reliability, while the transmission & distribution utilities segment remains the leading end-user category due to ongoing expansion and modernization of power networks.
KEY TAKEAWAYS
-
BY INSULATIONThe insulation segment includes air-insulated switchgear, gas-insulated switchgear, and other types of insulation. It plays a critical role in the global switchgear market because insulation technology directly affects operational safety, space efficiency, lifecycle costs, and environmental impact of electrical systems.
-
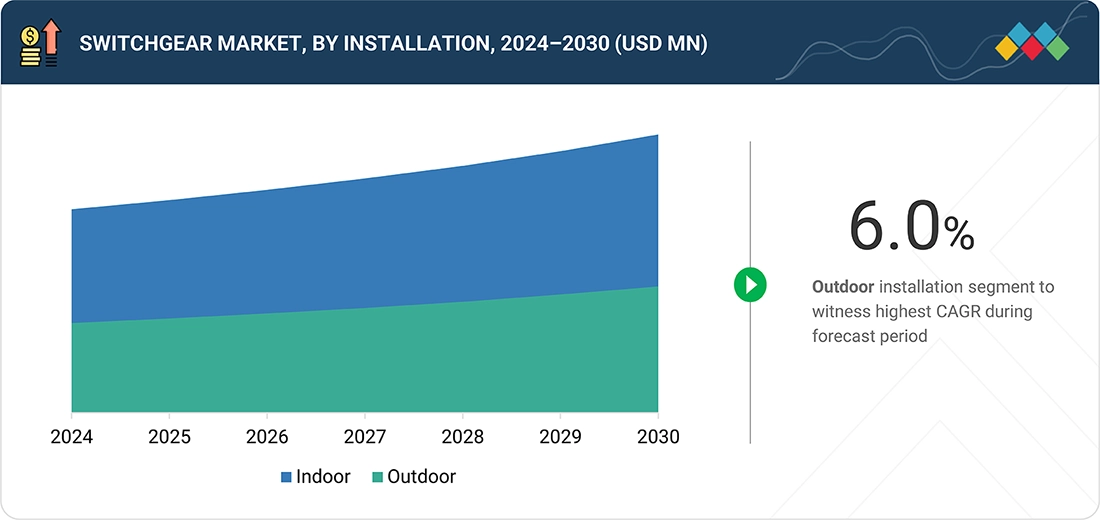
BY INSTALLATIONThe installation segment of the global switchgear market, mainly divided into indoor and outdoor switchgear, is key to how power distribution and control systems are installed in various operational settings.
-
BY VOLTAGEThe voltage segment includes low (up to 1 kV), medium (2-36 kV), and high (above 36 kV). Voltage-based segmentation is a fundamental approach in the global switchgear market, helping to distinguish technologies, applications, and infrastructure requirements based on different voltage ranges.
-
BY CURRENTThe current segment in the switchgear market refers to the type of electrical current—alternating current (AC) or direct current (DC)—that the switchgear is designed to manage, distribute, or protect. This classification is crucial, as AC and DC systems differ fundamentally in behavior, infrastructure needs, and end-use applications.
-
BY END USEREnd users generally include transmission and distribution utilities, industrial, commercial, and residential sectors, water and wastewater facilities, data centers, and other end users with specialized applications. Recognizing this segment offers insights into market trends, investment behaviors, and the adoption of emerging technologies across various infrastructure sectors.
-
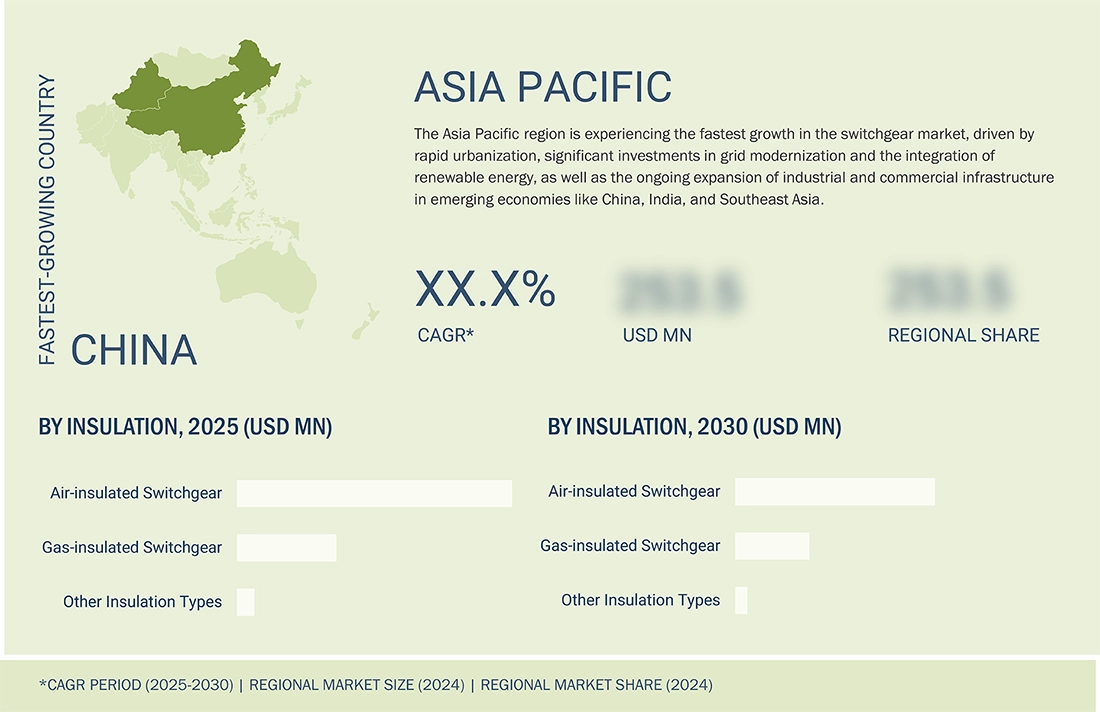
BY REGIONThe switchgear market includes Europe, North America, Asia Pacific, South America, the Middle East, and Africa. Asia Pacific led the switchgear market in 2024. The demand for switchgear in Asia Pacific is fueled by rapid urbanization, growing renewable energy projects, and large-scale grid modernization efforts.
-
COMPETITIVE LANDSCAPEAcquisitions, contracts, partnerships, agreement, expansions, and product launches are among the key growth strategies adopted by leading companies, such as ABB (Switzerland), Schneider Electric (France), Eaton (Ireland), Siemens (Germany), and Hitachi, Ltd. (Japan), to boost their position in the switchgear market. Companies operating in this market also focus on investments to increase their market shares and expand their geographic presence.
Rapid urbanization, rising investments in grid modernization, and the global effort to integrate renewable energy are key drivers of this demand. As countries expand their power infrastructure to support smart cities, data centers, and electric vehicle networks, the need for advanced switchgear systems that ensure operational safety and grid stability is growing. Additionally, government initiatives focused on rural electrification, reducing transmission losses, and improving energy security are speeding up switchgear deployment, particularly in emerging economies.
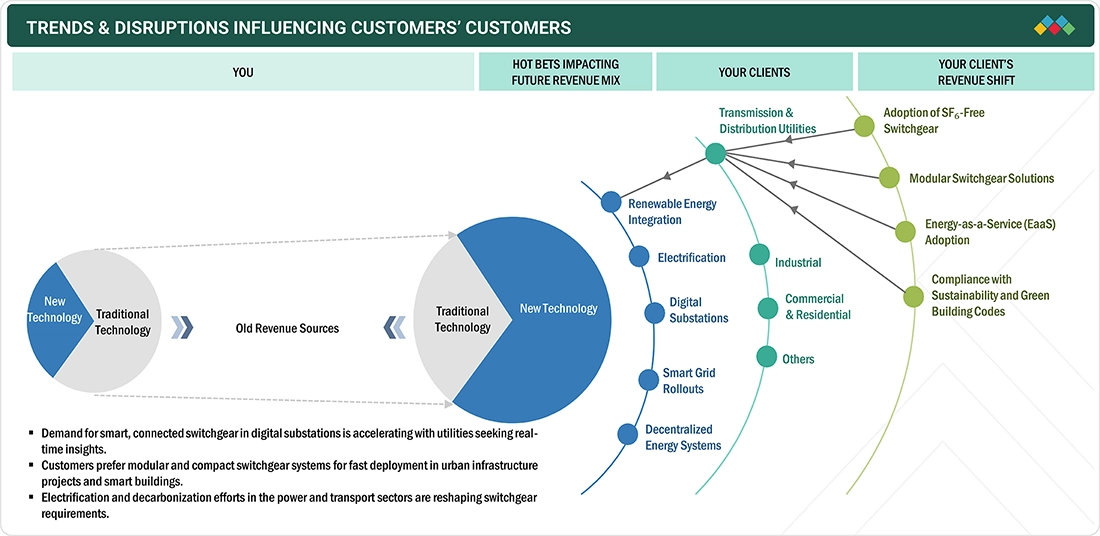
TRENDS & DISRUPTIONS IMPACTING CUSTOMERS' CUSTOMERS
The global switchgear market is experiencing a significant change as end-users across industries focus on resilient, intelligent, and sustainable power distribution systems in a more electrified and digital world. The development of electrical infrastructure, driven by smart grid advancements, renewable energy adoption, and increased electrification in transportation and manufacturing, is fundamentally changing customer needs and switchgear specifications.
Source: Secondary Research, Interviews with Experts, MarketsandMarkets Analysis
MARKET DYNAMICS
Level
-
Increasing demand for electricity

-
Integration of renewable energy sources

Level
-
Regulatory restrictions on SF6 gas emissions

-
High capital and lifecycle costs

Level
-
Exponential growth of digital services, cloud computing, and AI

-
Deployment of smart grid and digital substations

Level
-
Fragmented regulatory and standardization landscape

-
Cybersecurity risks associated with digital switchgear systems

Source: Secondary Research, Interviews with Experts, MarketsandMarkets Analysis
Driver: Increasing demand for electricity
Global electricity demand is increasing rapidly, with a notable 4.3% growth projected for 2024. This marks the strongest expansion since the post-COVID-19 rebound in 2021 and greatly exceeds the average of 2.7% over the past decade. It equals about 1,080 TWh of new electricity use—a quantity comparable to the annual output of a mid-sized country—in just one year. The main reasons include extreme weather events like intense heat waves, the electrification of transportation, and the growth of data center infrastructure, pointing to a fundamental shift toward more electricity-reliant activities. To handle the rising demand and improve resilience, governments are making significant investments in modernizing the grid. In the US, the Bipartisan Infrastructure Law allocates USD 65 billion for smart grid technologies and digital switchgear. Europe’s Recovery and Resilience Facility (RRF) funds smart interconnections and substation upgrades. At the same time, multilateral development banks such as the World Bank and Asian Development Bank are backing electrification and distribution projects across Africa and South Asia. These efforts inherently rely on medium and high-voltage switchgear systems for protection, automation, and reliability.
Restraint: Regulatory restrictions on SF6 gas emissions
Sulfur hexafluoride (SF6), used mainly in gas-insulated switchgear (GIS), faces strict regulatory pressure because of its extremely high global warming potential, about 23,500 times that of CO2. While GIS is the main user of SF6, the regulations affect the entire switchgear supply chain, including product innovation, cost structures, procurement decisions, and user adoption across air-insulated, hybrid, and digital switchgear systems.
Opportunity: Exponential growth of digital services, cloud computing, and AI
The exponential growth of digital services, cloud computing, and artificial intelligence is driving an unprecedented increase in hyperscale data centers worldwide. These facilities, operated by tech giants like Amazon Web Services (AWS), Microsoft Azure, Google Cloud, and Meta, need reliable and continuous power supply systems to sustain 24/7 operations. Consequently, the demand for high-reliability, intelligent switchgear has grown to support these critical infrastructures.
Challenge: Fragmented regulatory and standardization landscape
The global switchgear market is heavily influenced by the absence of standardized regulatory frameworks across major regions. Although switchgear is a universal necessity in power transmission and distribution, the compliance requirements that regulate its design, safety, testing, and performance differ significantly between regions. The U.S., for example, mainly follows ANSI and IEEE standards, Europe adheres to IEC standards, China to GB/T, and India to IS standards. Consequently, manufacturers often need to produce multiple versions of the same switchgear product tailored to each market's specifications, creating considerable engineering, certification, and logistical challenges.
Switchgear Market: COMMERCIAL USE CASES ACROSS INDUSTRIES
| COMPANY | USE CASE DESCRIPTION | BENEFITS |
|---|---|---|
 |
Deployed molded vacuum modules to replace oil-insulated switchgear for a municipal utility in the US | Eliminated issues of moisture infiltration and high maintenance | Oil-free, solid-dielectric solution improved reliability, safety, and reduced infrastructure rework and downtime |
 |
Enemalta revives switchgear performance through SSL-led refurbishment at Marsa power station | Customized, technically sound, and cost-effective solution restoring operational integrity and reliability |
 |
Designed a custom LV switchboard for a motorsport manufacturer to meet high-performance vehicle testing needs | Addressed issues of high current loads and space constraints | Reliable high-current handling, compact design, and enhanced safety for advanced testing environments |
Logos and trademarks shown above are the property of their respective owners. Their use here is for informational and illustrative purposes only.
MARKET ECOSYSTEM
Key stakeholders involved in the switchgear market, from raw material providers/suppliers, switchgear manufacturers/assemblers, and distributors (buyers)/end users to the regulatory bodies/standards organizations.
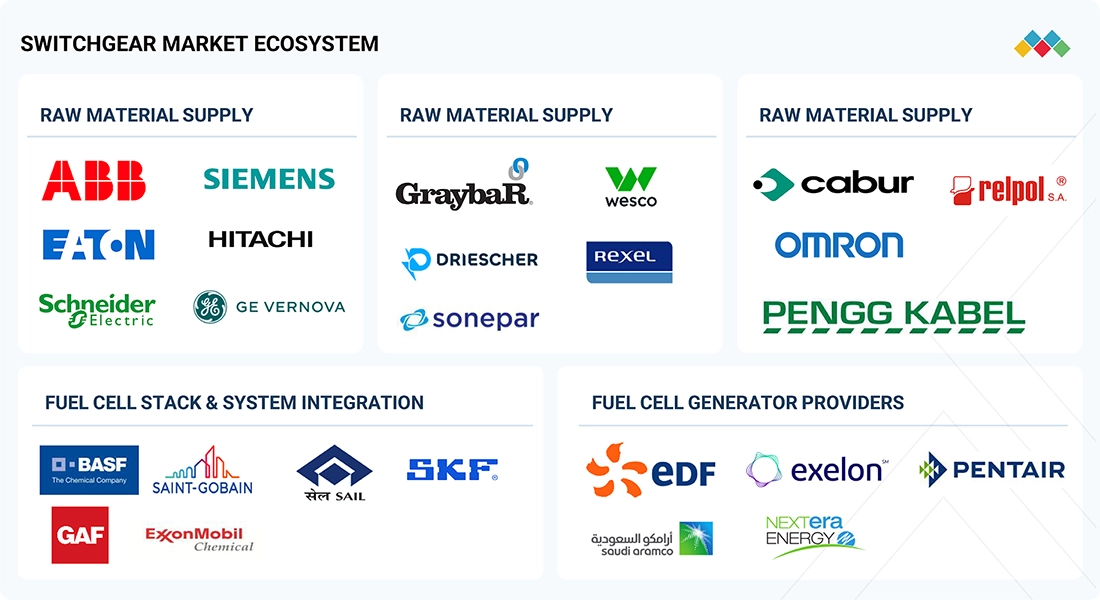
Logos and trademarks shown above are the property of their respective owners. Their use here is for informational and illustrative purposes only.
MARKET SEGMENTS
Source: Secondary Research, Interviews with Experts, MarketsandMarkets Analysis
Switchgear Market, By Insulation
In 2024, the Air-Insulated Switchgear (AIS) segment holds the largest market share owing to its cost-effectiveness, ease of installation, and suitability for a wide range of voltage applications. AIS systems are widely adopted in distribution networks, industrial facilities, and commercial buildings due to their simpler design, lower maintenance requirements, and strong performance in indoor and outdoor installations. Additionally, the growing expansion of power distribution infrastructure and refurbishment of aging substations in developing economies further bolster the demand for air-insulated switchgear solutions.
Switchgear Market, By Installation
In 2024, the indoor switchgear segment held the largest market share, primarily driven by the rising demand for reliable power distribution in urban and industrial settings where space optimization and safety are key priorities. The rapid growth of commercial buildings, data centers, and manufacturing facilities has increased the adoption of compact, low-maintenance indoor switchgear systems. Moreover, the shift toward smart grids and the integration of digital monitoring technologies are encouraging utilities and industries to invest in advanced indoor switchgear for enhanced operational efficiency and reduced downtime.
Switchgear Market, By Voltage
High (above 36 kV) dominates the market primarily due to the rapid expansion of transmission and distribution (T&D) networks to meet growing electricity demand and integrate renewable energy sources. Utilities are investing heavily in high-voltage infrastructure to ensure grid reliability, reduce losses over long-distance power transmission, and support large-scale renewable projects such as wind and solar farms. Additionally, urbanization and industrialization in emerging economies are driving the need for robust high-voltage systems to handle increasing load requirements, further boosting segment growth.
Switchgear Market, By Current
AC switchgear held the largest market share in 2024 due to the continued prevalence of AC power as the global standard for electricity transmission and distribution. The majority of grid infrastructure, industrial systems, and commercial facilities are specifically designed for AC, establishing it as the preferred option for high-capacity and long-distance power transmission. The increasing integration of renewable energy sources, such as wind and solar—both typically connected to AC grids—further strengthens the demand for AC switchgear. Furthermore, ongoing investments aimed at upgrading aging AC-based transmission and distribution networks, as well as expanding electrification in emerging economies, continue to propel growth within this segment.
Switchgear Market, By End User
Transmission and distribution utilities dominated the switchgear market in 2024 because they play a key role in global grid modernization and expansion efforts. Increasing electricity demand, the integration of renewable energy sources, and the need to reduce technical losses over long-distance transmission drive utilities to invest significantly in advanced switchgear solutions. Governments and private investors are also funding large-scale projects to upgrade aging infrastructure and enhance grid reliability, especially in emerging economies and regions with high renewable energy penetration. Overall, these factors make T&D utilities the largest end user segment.
REGION
Asia Pacific to be fastest-growing region in global switchgear market during forecast period
Asia Pacific is experiencing the highest CAGR during the forecast period of 2025–2030. The region's switchgear market is currently gaining strong momentum, driven by rapid urbanization, industrial expansion, and extensive grid upgrades. Governments across Asia Pacific are prioritizing environmental sustainability and reducing greenhouse gas emissions, which is accelerating the adoption of gas-insulated switchgear that supports these efforts. Additionally, technological advancements and energy transition initiatives focused on sustainability and efficiency are fueling strong demand for switchgear monitoring systems. In Southeast Asia, the ASEAN Power Grid initiative is promoting cross-border interconnections to improve regional energy security and integrate renewable energy sources, increasing demand for standardized switchgear among utilities. In the manufacturing and commercial sectors, companies such as Shihlin Electric are making significant investments in green-energy components—including EV charging systems and solar-ready products—across China, Taiwan, and Vietnam, reflecting a robust industrial shift.
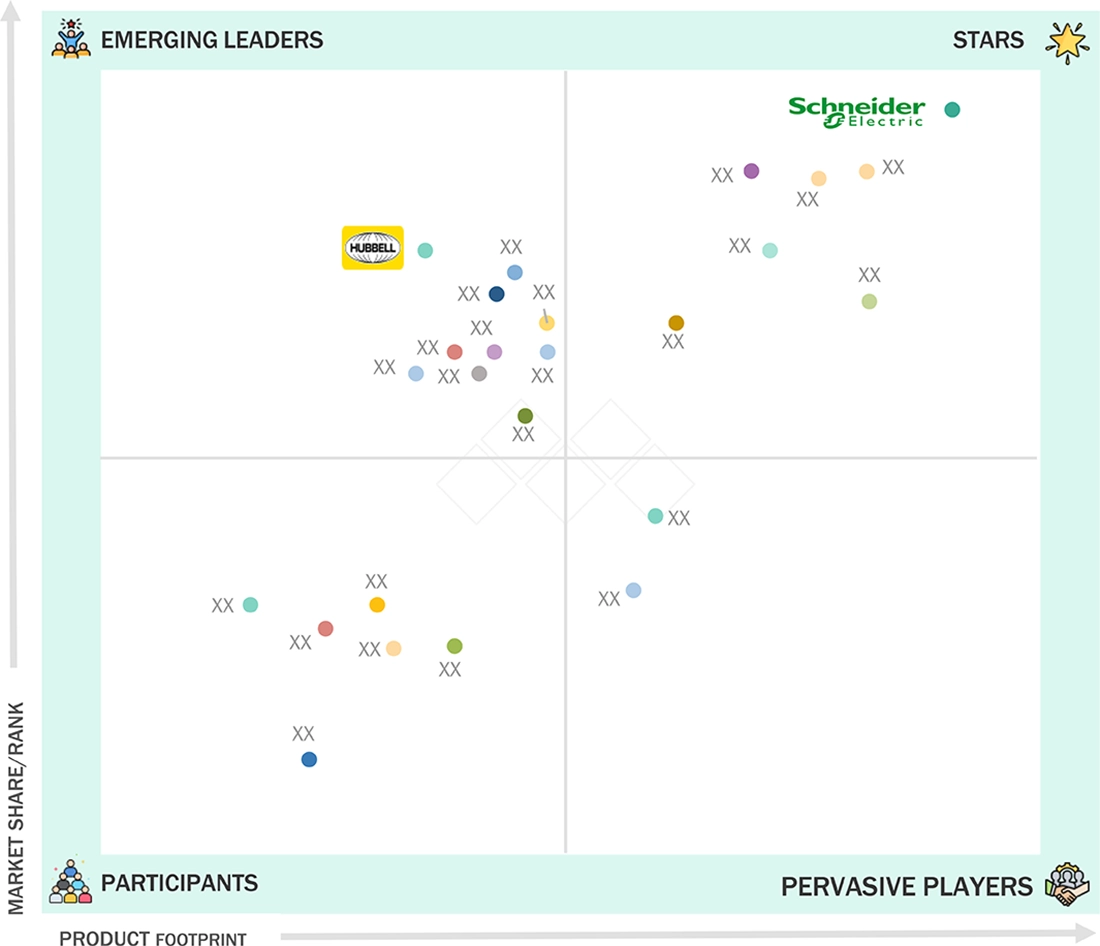
Switchgear Market: COMPANY EVALUATION MATRIX
In the switchgear market matrix, Schneider Electric (Star) leads with a strong market share and extensive product footprint, driven by comprehensive portfolio of smart and sustainable solutions, strong global presence, and continuous innovation in digital energy management and grid modernization technologies. Hubbell (Emerging Leader) due to its strategic focus on innovative medium-voltage solutions, and growing investments in grid modernization and smart infrastructure projects.
Source: Secondary Research, Interviews with Experts, MarketsandMarkets Analysis
KEY MARKET PLAYERS
MARKET SCOPE
| REPORT METRIC | DETAILS |
|---|---|
| Market Size in 2024 (Value) | USD 99.05 Billion |
| Market Forecast in 2030 (Value) | USD 136.65 Billion |
| Growth Rate | CAGR of 5.7% from 2025-2030 |
| Years Considered | 2021-2030 |
| Base Year | 2024 |
| Forecast Period | 2025-2030 |
| Units Considered | Value (USD Billion/Million), Volume (Units) |
| Report Coverage | Revenue forecast, company ranking, competitive landscape, growth factors, and trends |
| Segments Covered |
|
| Regions Covered | North America, Asia Pacific, Europe, South America, Middle East & Africa |
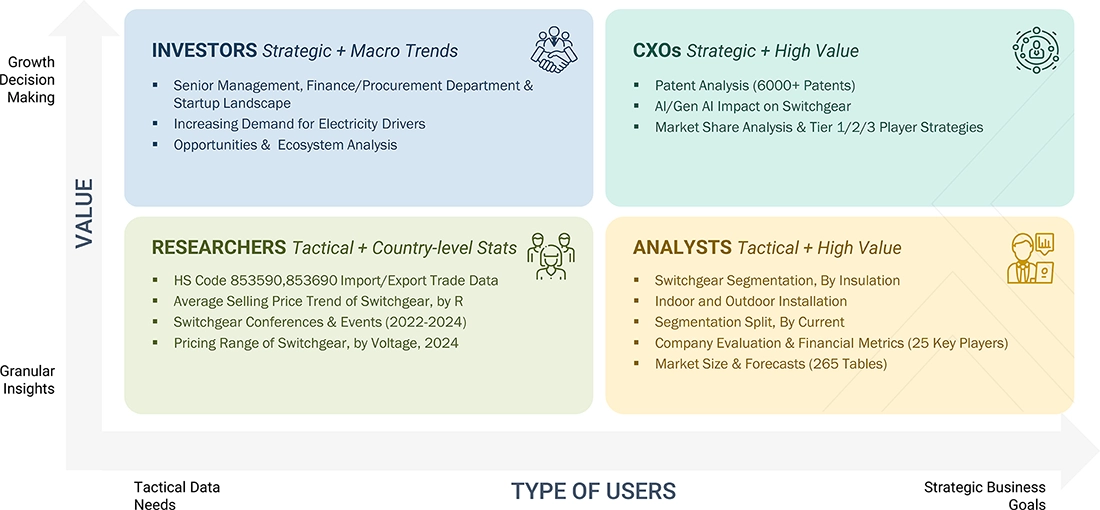
WHAT IS IN IT FOR YOU: Switchgear Market REPORT CONTENT GUIDE
DELIVERED CUSTOMIZATIONS
We have successfully delivered the following deep-dive customizations:
| CLIENT REQUEST | CUSTOMIZATION DELIVERED | VALUE ADDS |
|---|---|---|
| Leading Electrical Equipment OEM | Detailed analysis of the medium voltage section of the switchgear market (market sizing segmentation, competitive landscape) |
|
| Electrical Engineering & ICT Solution Company | Deep dive analysis and breakdown of different segments in the European switchgear market | Cross segment analysis of segments across the European market |
RECENT DEVELOPMENTS
- April 2025 : Eaton (Ireland) introduced a Rear-Access Arc-Resistant Magnum PXR Low-Voltage Switchgear, an advanced solution designed to improve safety, reliability, and maintainability in power distribution systems. This model is engineered for applications up to 600V AC with interrupting capacities up to 100 kA and features arc-resistant construction with a rear-access design, enabling safer operation and maintenance by keeping personnel away from potential arc flash zones. It also includes sophisticated features like motorized remote racking (MR2), automatic transfer, and intelligent control packages, making it suitable for critical environments such as data centers, healthcare facilities, and industrial plants.
- March 2025 : ABB (Switzerland) increased the production capacity of its low-voltage electrification products in the US. The expansion will allow ABB to meet growing customer demand in key growth sectors, including data centers, buildings, and utilities.
- October 2024 : Schneider Electric (France) collaborated with Ausgrid to speed up grid decarbonization in Australia by deploying SF6-free switchgear in Ausgrid's distribution network. This initiative is part of Ausgrid's broader sustainability plan and represents a significant move toward lowering greenhouse gas emissions.
- June 2024 : Siemens (Germany) invested USD 115 million in its Frankfurt switchgear plant to increase its production capacity and promote sustainable technologies. The initiative will support the manufacturing of Siemens' SF6-free 8DAB–blue GIS medium-voltage switchgear, which uses climate-neutral Clean Air insulation, reaffirming Siemens' commitment to sustainable and digital power distribution solutions.
- April 2024 : ABB (Switzerland) introduced PrimeGear ZX0 in India. This environmentally friendly switchgear is based on ABB's SF6-free ecoGIS technology with Dry Air for applications up to 12kV at the Nashik factory, promoting a transition to a greener, smarter, and safer future.
Table of Contents
 Exclusive indicates content/data unique to MarketsandMarkets and not available with any competitors.
Methodology
This study involved major activities in estimating the current size of the switchgear market. Comprehensive secondary research was done to collect information on the market, peer, and parent markets. The next step involved the validation of these findings, assumptions, and market sizing with industry experts across the value chain through primary research. The total market size was estimated through country-wise analysis. Then, the market breakdown and data triangulation were performed to estimate the market size of the segments and sub-segments.
Secondary Research
Secondary sources referred to for this research study include annual reports, press releases, investor presentations of companies, white papers, certified publications, articles from recognized authors, and databases of various companies and associations. Secondary research has been mainly used to obtain key information about the industry's supply chain to identify the key players offering various products and services, market classification and segmentation according to the offerings of major players, industry trends to the bottom-most level, regional markets, and key developments from market- and technology-oriented perspectives.
Primary Research
In the primary research process, various primary sources from the supply and demand sides have been interviewed to obtain qualitative and quantitative information for this report. Primary sources from the supply side included industry experts, such as chief executive officers (CEO), vice presidents, marketing directors, technology and innovation directors, and related key executives from various companies and organizations operating in the switchgear market. Various primary sources from both the supply and demand sides of the market were interviewed to obtain qualitative and quantitative information. The breakdown of primary respondents is given below:

Note: "Others" include sales managers, engineers, and regional managers
The tiers of the companies are defined based on their total revenue as of 2024: Tier 1: >USD 1 billion,
Tier 2: USD 500 million–1 billion, and Tier 3:
To know about the assumptions considered for the study, download the pdf brochure
Market Size Estimation
Both top-down and bottom-up approaches were used to estimate and validate the total size of the solid biomass feedstock market. These methods were also used extensively to estimate the size of various subsegments in the market. The research methodology used to estimate the market size includes the following:
- The key players in the industry and market have been identified through extensive secondary research, and their market share has been determined through primary and secondary research.
- The industry's value chain and market size, in terms of value, have been determined through both primary and secondary research processes.
- All percentage shares, splits, and breakdowns have been determined using secondary sources and verified through primary sources.
Switchgear Market : Top-Down and Bottom-Up Approach

Data Triangulation
After arriving at the overall market size from the estimation process explained above, the total market has been split into several segments and subsegments. Data triangulation and market breakdown processes have been employed to complete the overall market engineering process and arrive at the exact statistics for all the segments and sub-segments, wherever applicable. The data has been triangulated by studying various factors and trends from both the demand and supply sides. Along with this, the market has been validated using both the top-down and bottom-up approaches.
Market Definition
Switchgear refers to an integrated assembly of electrical disconnect switches, fuses, relays, and circuit breakers used to control, protect, and isolate electrical equipment within a power system. It ensures the safe and reliable operation of electrical networks by managing normal load currents and responding to abnormal conditions such as faults or short circuits.
Typically installed on both the high-voltage and low-voltage sides of power transformers, switchgear facilitates maintenance by de-energizing equipment and enhances system protection by detecting and isolating faults, ensuring continued power supply to unaffected areas.
Modern switchgear systems incorporate sensing devices (e.g., current and potential transformers), protection relays, and intelligent monitoring units for real-time diagnostics, metering, and control. These systems are vital in transmission, distribution, industrial, and commercial applications, especially as power networks evolve to become more digital, decentralized, and integrated with renewable energy sources.
Stakeholders
- Government & research organizations
- State and national regulatory authorities
- Organizations, forums, alliances, and associations
- Institutional investors
- Investors/Shareholders
- Environmental research institutes
- Manufacturers' associations
- Integrated Device Manufacturers (IDMs)
- Switchgear raw material and component manufacturers
- Switchgear manufacturers, dealers, and suppliers
- Electrical equipment manufacturers' associations and groups
- Power utilities and other end-user companies
- Consulting companies in the energy and power domain
- Investment banks
Report Objectives
- To define, describe, analyze, and forecast the switchgear market based on insulation, installation, voltage, current, end user, and region
- To describe and forecast the market for five key regions: North America, Europe, Asia Pacific, South America, and the Middle East & Africa, along with their country-level market sizes, in terms of value and volume
- To forecast the switchgear market, by region, in terms of volume
- To give comprehensive details regarding the main factors, obstacles, chances, and sector-specific difficulties impacting the expansion of the switchgear market.
- To systematically examine the market for switchgear in terms of each segment's contributions to the market, growth trends, and prospects.
- To provide the supply chain analysis, trends/disruptions impacting customers' businesses, market map, ecosystem analysis, regulatory landscape, pricing analysis, patent analysis, case study analysis, technology analysis, key conferences and events, trade analysis, Porter's five forces analysis, key stakeholders and buying criteria, and regulatory analysis of the market
- To conduct a strategic analysis of micromarkets1 concerning their respective growth trends, planned expansions, and market share contributions
- To sketch a competitive environment for market participants and assess the potential for stakeholders in the switchgear business.
- To benchmark players within the market using the company evaluation quadrant, which analyzes market players on various parameters within the broad categories of business and product strategies.
- To compare key market players for the market share, product specifications, and applications.
- To strategically profile key players and comprehensively analyze their market ranking and core competencies.
- To track and analyze competitive developments in the switchgear market, such as sales contracts, agreements, investments, expansions, product launches, alliances, mergers, partnerships, joint ventures, collaborations, and acquisitions.
Available Customizations
With the given market data, MarketsandMarkets offers customizations based on the company's specific needs. The following customization options are available for the report:
Product Analysis
- Product Matrix, which provides a detailed comparison of the product portfolio of each company
Geographic Analysis as per Feasibility
- Further breakdown of the switchgear market by country
Company Information
- Detailed analyses and profiling of additional market players
Key Questions Addressed by the Report
What was the size of the switchgear market in 2025?
The market size of the global switchgear market was USD 103.71 billion in 2025.
What are the major drivers for the switchgear market?
Modernization of power distribution infrastructure and rising investment in industrial production are significant factors driving the switchgear market.
Which is the largest region during the forecast period in the switchgear market?
The Asia Pacific region is estimated to be the largest market during the forecast period.
By voltage, which is the fastest-growing segment during the forecast period in the switchgear market?
The medium (2–36kV) segment is estimated to be the fastest-growing segment during the forecast period.
What can be restraints for the switchgear market?
Regulatory restrictions on SF6 gas emissions are one of the restraints of the switchgear market.
Need a Tailored Report?
Customize this report to your needs
Get 10% FREE Customization
Customize This ReportPersonalize This Research
- Triangulate with your Own Data
- Get Data as per your Format and Definition
- Gain a Deeper Dive on a Specific Application, Geography, Customer or Competitor
- Any level of Personalization
Let Us Help You
- What are the Known and Unknown Adjacencies Impacting the Switchgear Market
- What will your New Revenue Sources be?
- Who will be your Top Customer; what will make them switch?
- Defend your Market Share or Win Competitors
- Get a Scorecard for Target Partners

Custom Market Research Services
We Will Customise The Research For You, In Case The Report Listed Above Does Not Meet With Your Requirements
Get 10% Free CustomisationTESTIMONIALS

Kimberly Murphy
GLOBAL MARKETING DIRECTOR
Bently Nevada,
Leading Condition Monitoring & Asset Protectionwww.bakerhughesds.com/bently-nevada

MarketsandMarkets™ showed consistent rigor for success and relentlessly worked with Bently Nevada stakeholders to positively impact go-to-market strategy. Their proactiveness and flexibility has been instrumental in achieving the objectives to grow our sales pipeline in key industrial markets.

DARRICK HUEBER
Business Development Leader
Nexus Controls LLC,
Leading Manufacturer of Automation System & Electrical Panelswww.bakerhughesds.com/nexus-controls

We partnered with MarketsandMarkets to expand our business further by tapping into new industrial segments. It was critical for us to gather crucial business insights about specific markets to achieve this goal. MarketsandMarkets engagement model and client services helped us provide those insights, it was really impressive and valuable for my business. The team was extremely flexible and helpful.

Mike Schoff
Global Industrial Commercial Strategy Leader
Nexus Controls LLC
Leading Manufacturer of Automation System & Electrical Panelswww.bakerhughesds.com/nexus-controls
We consulted MarketsandMarkets for potential Partner Identification. Overall, it was a good experience. The insights provided through interviews conducted by the team helped us put together the questionnaire required for discussion with the selected partners. Their ability to provide insights through interviews with customers in a timely manner was quite impressive.
Growth opportunities and latent adjacency in Switchgear Market


Linda
Jun, 2022
We want a Scorecard for Competitors in the switchgear Market projected forecast should be 2022 to 2030..