Performance Additives Market by Type (Plastic Additives, Paint & Coatings Additives, Pigment Additives, Ink Additives), End-Use Industry (Packaging, Household Goods, Automotive, Industrial, Construction), and Region - Global Forecast to 2021


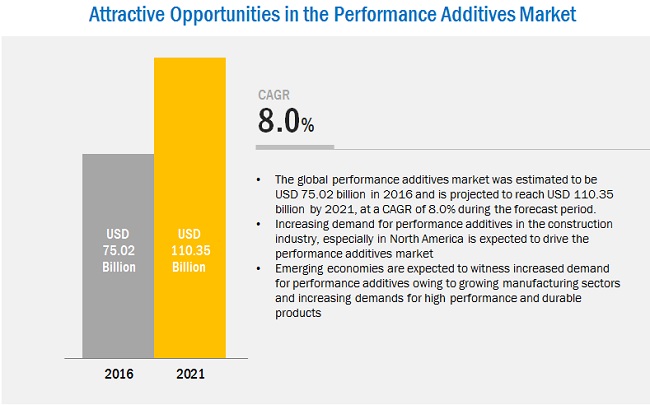
[169 Pages Report] The Global Performance Additives Market is projected to reach USD 110.35 Billion by 2021 at a CAGR of 8.0%, in terms of value. The market is driven by the increasing demand for performance additives from end-use industries, such as packaging, household goods, and automotive. The base year considered for the study is 2015 while the forecast period is from 2016 to 2021. The report includes an analysis of the performance additives market by region, namely, North America, Europe, Asia-Pacific, Middle East & Africa, and South America.
Objectives of the Study:
- To define, describe, and forecast the performance additives market on the basis of type, end-use industry, and region
- To provide detailed information about the key factors influencing the growth of the market (drivers, restraints, opportunities, and challenges)
- To strategically analyze micromarkets1 with respect to individual growth trends, future prospects, and contribution to the total market
- To analyze the opportunities in the market for stakeholders and provide a competitive landscape for market leaders
- To strategically profile key players and comprehensively analyze their market shares and core competencies2
Note1: Micromarkets are the subsegments of the performance additives market included in the report
Note2: Core competencies of companies are determined in terms of their key developments, SWOT analysis, and key strategies adopted by them to sustain in the market
The top-down and bottom-up both approaches have been used to estimate and validate the size of the global performance additives market and to estimate the size of various other dependent submarkets. The research study involved the use of extensive secondary sources, directories, and databases, such as Hoovers, Bloomberg, Chemical Weekly, Factiva, Commonwealth Scientific and Industrial Research Organization (CSIRO), Securities and Exchange Commission (SEC), American National Standards Institute (ANSI), Organization for Economic Co-operation and Development (OECD), and other government and private websites, to identify and collect information useful for the technical, market-oriented, and commercial study of the performance additives market.
To know about the assumptions considered for the study, download the pdf brochure
Key Target Audience:
- Manufacturers of Performance Additives
- Traders, Distributors, and Suppliers of Performance Additives
- Regional Manufacturers� Associations and General performance additives Associations
- Government and Regional Agencies and Research Organizations
- Investment Research Firms
�This study answers several questions for the stakeholders, primarily which market segments they should focus upon during the next two to five years to prioritize their efforts and investments�.
Scope of the Report:
- This research report categorizes the performance additives market on the basis of type, end-use industry, and region
Based on Type:
- Plastic Additives
- Paint & Coatings Additives
- Pigment Additives
- Ink Additives
- Rubber Additives
Based on End-use Industry:
- Packaging
- Household Goods
- Construction
- Automotive
- Industrial
- Wood & Furniture
- Others
Based on Region:
- North America
- Europe
- Asia-Pacific
- Middle East & Africa
- South America
- The market is further analyzed for the key countries in each of these regions.
Available Customizations:
With the given market data, MarketsandMarkets offers customizations according to the company�s specific needs. The following customization options are available for the report:
Regional Analysis:
- Country-level analysis of the performance additives market is provided by end-use industry.
Company Information:
- Detailed analysis and profiles of additional market players.
The global performance additive market is projected to reach USD 110.35 Billion by 2021, growing at a CAGR of 8.0% in terms of value. The market has witnessed significant growth in recent years, and this growth is projected to persist in the coming years as well. Performance additives are used in a wide range of end-use industries, including packaging, household goods, automotive, industrial, construction, wood & furniture, and others as these additives enhance the processability, performance, and appearance of the final product.
Performance additives are materials added to plastics in small quantities to improve their performance and durability. For this report, the performance additives market is segmented based on type into plastic additives, rubber additives, ink additives, pigment additives, and paint & coatings additives. The plastic additives segment accounted for the largest market share in 2016, due to the suitability of these additives in several application areas. Plastic additives are ingredients that are added to polymers to improve their characteristics, such as strength, durability, and heat sensitivity. The demand for plastic additives is estimated to grow on account of the increasing consumption of plastic and the rising disposable income of consumers. However, the paint & coatings segment is estimated to be the fastest-growing type segment of the performance additive market, in terms of value and volume, due to the increasing acceptance of paint & coatings additives in various end-use industries, such as packaging, household goods, automotive, industrial, construction, wood & furniture, and others.
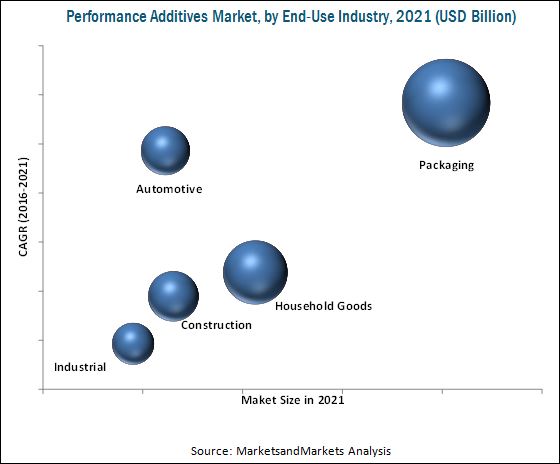
In 2015, the packaging end-use industry segment accounted for the largest share of the performance additives market, in terms of value and volume, followed by household goods, construction, automotive, and others. The packaging segment is also projected to grow at the highest CAGR from 2016 to 2021.
The geographical analysis of the performance additive market includes five main regions, namely, North America, Europe, Asia-Pacific, Middle East & Africa, and South America. Asia-Pacific is the largest market for performance additives. The Asia-Pacific performance additives market is also projected to grow at the highest rate during the forecast period. The demand for performance additives in this region is mainly driven by their increased use in the packaging and household goods industries. Europe is the second-largest consumer and manufacturer of performance additives. Packaging and household goods are the top two end-use industries contributing to the growing demand for performance additives globally.
Though the performance additives market is growing at a significant rate, a few factors, such as the high price of raw materials, shift of the end-use market from developed countries to emerging countries, and the rising cost of production, hinder the growth of the market, globally.
BASF SE (Germany), AkzoNobel N.V. (Netherlands), Solvay S.A. (Belgium), Evonik Industries AG (Germany), Lanxess (Germany), Arkema SA (France), and Huntsman International LLC (U.S.) are the leading companies in this market. These companies are projected to account for a significant share of the market during the forecast period. Entering into related industries and targeting new markets will enable performance additive manufacturers to overcome the effects of volatile economies, leading to diversified business portfolios and increase in revenues. Other major performance additive manufacturers include Altana AG (Germany), Clariant (Switzerland), and The Dow Chemical Company (U.S.).
To speak to our analyst for a discussion on the above findings, click Speak to Analyst
 Exclusive indicates content/data unique to MarketsandMarkets and not available with any competitors.
Table of Contents
1 Introduction (Page No. - 17)
1.1 Objectives of the Study
1.2 Market Definition
1.3 Market Scope
1.3.1 Years Considered for the Study
1.3.2 Currency
1.4 Research Limitations
1.5 Stakeholders
2 Research Methodology (Page No. - 20)
2.1 Research Data
2.1.1 Secondary Data
2.1.1.1 Key Data From Secondary Sources
2.1.2 Primary Data
2.1.2.1 Key Data From Primary Sources
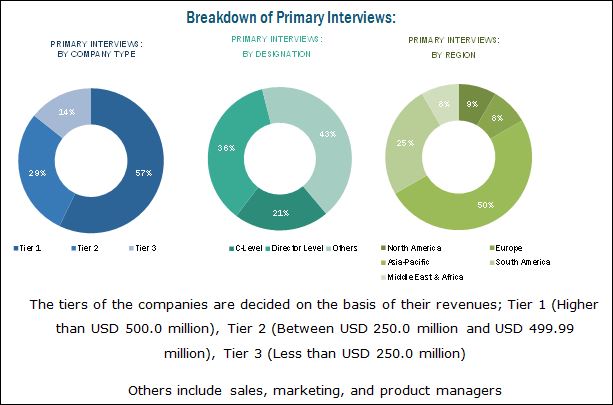
2.1.2.2 Breakdown of Primary Interviews
2.2 Market Size Estimation
2.2.1 Bottom-Up Approach
2.2.2 Top-Down Approach
2.3 Data Triangulation
2.4 Research Assumptions
3 Executive Summary (Page No. - 29)
4 Premium Insights (Page No. - 35)
4.1 Performance Additives Market Overview, 2016 vs 2021
4.2 Performance Additives Market, By Type
4.3 Performance Additives Market Share in Asia-Pacific, By End-User Industry and Country
4.4 Performance Additives Market Attractiveness
4.5 Performance Additives Market Share, By End-User Industry and Region
5 Market Overview and Industry Trends (Page No. - 40)
5.1 Introduction
5.2 Market Dynamics
5.2.1 Drivers
5.2.1.1 Growing Population and Rapid Urbanization
5.2.1.2 Increase in Demand From End-Use Industries
5.2.1.3 Development of Multipurpose Additives
5.2.2 Restraints
5.2.2.1 Volatile Raw Material Prices
5.2.2.2 Stringent Environmental Regulations
5.2.3 Opportunities
5.2.3.1 Opportunities for Packaging Applications in Emerging Markets
5.2.4 Challenges
5.2.4.1 High Labor Cost in Developed Countries
5.3 Porter�s Five Forces Analysis
5.3.1 Threat of New Entrants
5.3.2 Threat of Substitutes
5.3.3 Bargaining Power of Buyers
5.3.4 Bargaining Power of Suppliers
5.3.5 Intensity of Competitive Rivalry
6 Performance Additives Market, By Type (Page No. - 48)
6.1 Introduction
6.1.1 Plastic Additives
6.1.1.1 Plasticizers
6.1.1.2 Flame Retardants
6.1.1.3 Impact Modifiers
6.1.1.4 Heat & Light Stabilizers
6.1.1.5 Others
6.1.2 Rubber Additives
6.1.2.1 Antidegradants
6.1.2.2 Accelerators
6.1.2.3 Others (Blowing Agents and Adhesive Agents )
6.1.3 Ink Additives
6.1.3.1 Rheology Modifier
6.1.3.2 Slip/Rub Material
6.1.3.3 Defoamers
6.1.3.4 Dispersants
6.1.3.5 Antioxidant
6.1.3.6 Chelating Agents
6.1.3.7 Others (Wetting Agents, Driers, and PH Modifiers)
6.1.4 Pigment Additives
6.1.4.1 Organic Pigments
6.1.4.2 Inorganic Pigments
6.1.5 Paints & Coating Additives
6.1.5.1 Antifoaming
6.1.5.2 Wetting & Dispersion
6.1.5.3 Biocides
6.1.5.4 Rheology Modification
6.1.5.5 Impact Modification
6.1.5.6 Others
7 Performance Additives Market, By End-Use Industry (Page No. - 55)
7.1 Introduction
7.2 Packaging
7.2.1 Rigid Packaging
7.2.2 Flexible Packaging
7.2.3 Sheets & Films
7.3 Household Goods
7.3.1 Appliances
7.3.2 Flat Panel Displays
7.3.3 Electrical Profiles
7.3.4 Personal Care Products
7.4 Construction
7.4.1 Pipes & Fitting
7.4.2 Roofing Membranes
7.4.3 Sealing Profiles & Sealants
7.4.4 Window Profiles
7.4.5 Technical Profiles
7.4.6 Wood Plastic Composites
7.5 Automotive
7.5.1 Interior Parts
7.5.2 Exterior Parts
7.5.3 Tires
7.6 Industrial
7.6.1 Protective Coating
7.6.2 Metal & Surface Treatment
7.6.3 Printing, Inks, & Adhesives
7.6.4 Industrial Equipment
7.6.5 Chemical Industry
7.6.6 Mining
7.7 Wood & Furniture
7.7.1 Flooring
7.7.2 Fence, Siding & Decking
7.7.3 Windows & Doors
7.7.4 Furniture
7.8 Others
8 Performance Additives Market, By Region (Page No. - 64)
8.1 Introduction
8.2 North America
8.2.1 The U.S.
8.2.1.1 The U.S.: Economic Outlook (2015)
8.2.2 Canada
8.2.2.1 Canada: Economic Outlook (2015)
8.2.3 Mexico
8.2.3.1 Mexico: Economic Outlook (2015)
8.3 Europe
8.3.1 Germany
8.3.1.1 Germany: Economic Outlook (2015)
8.3.2 France
8.3.2.1 France: Economic Outlook (2014)
8.3.3 Italy
8.3.4 U.K.
8.3.4.1 U.K.: Economic Outlook (2015)
8.3.5 Spain
8.3.6 Russia
8.3.6.1 Russia: Economic Outlook (2015)
8.3.7 Rest of Europe
8.4 Asia Pacific
8.4.1 China
8.4.2 India
8.4.3 Japan
8.4.4 South Korea
8.4.5 Thailand
8.4.6 Indonesia
8.4.7 Malaysia
8.4.8 Rest of Asia-Pacific
8.5 Middle East & Africa
8.5.1 Saudi Arabia
8.5.2 South Africa
8.5.3 Iran
8.5.4 Rest of Middle East & Africa
8.6 South America
8.6.1 Brazil
8.6.2 Argentina
8.6.3 The Rest of South America
9 Dive, Performance Additives (Page No. - 129)
9.1 Introduction
9.1.1 Dynamics
9.1.2 Innovators
9.1.3 Vanguards
9.1.4 Emerging
9.2 Overview
9.3 Product Offerings (For All 25 Players)
9.4 Business Strategy (For All 25 Players)
10 Company Profiles (Page No. - 133)
10.1 Akzo Nobel N.V.
10.1.1 Business Overview
10.1.2 Akzonobel N.V.: Company Snapshot
10.1.3 Products Offered
10.1.3.1 Scorecard
10.1.4 Business Strategy
10.1.4.1 Scorecard
10.1.5 Developments
10.2 Arkema Sa
10.2.1 Business Overview
10.2.2 Arkema Sa: Company Snapshot
10.2.3 Products Offered
10.2.3.1 Scorecard
10.2.4 Business Strategy
10.2.4.1 Scorecard
10.2.5 Developments
10.3 Evonik Industries AG
10.3.1 Business Overview
10.3.2 Evonik Industries AG: Company Snapshot
10.3.3 Products Offered
10.3.3.1 Scorecard
10.3.4 Business Strategy
10.3.4.1 Scorecard
10.3.5 Developments
10.4 BASF SE
10.4.1 Business Overview
10.4.2 BASF SE: Company Snapshot
10.4.3 Products Offered
10.4.3.1 Scorecard
10.4.4 Business Strategy
10.4.4.1 Scorecard
10.4.5 Developments
10.5 The DOW Chemical Company
10.5.1 Business Overview
10.5.2 The DOW Chemical Company: Company Snapshot
10.5.3 Products Offered
10.5.3.1 Scorecard
10.5.4 Business Strategy
10.5.4.1 Scorecard
10.5.5 Developments
10.6 Clariant
10.6.1 Business Overview
10.6.2 Clariant: Company Snapshot
10.6.3 Products Offered
10.6.3.1 Scorecard
10.6.4 Business Strategy
10.6.4.1 Scorecard
10.6.5 Developments
10.7 Huntsman
10.7.1 Business Overview
10.7.2 Huntsman Corporation: Company Snapshot
10.7.3 Products Offered
10.7.3.1 Scorecard
10.7.4 Business Strategy
10.7.4.1 Scorecard
10.7.5 Developments
10.8 Altana
10.8.1 Business Overview
10.8.2 Altana: Company Snapshot
10.8.3 Products Offered
10.8.3.1 Scorecard
10.8.4 Business Strategy
10.8.4.1 Scorecard
10.8.5 Developments
10.9 Cytec Solvay
10.9.1 Business Overview
10.9.2 Cytec Solvay: Company Snapshot
10.9.3 Products Offered
10.9.3.1 Scorecard
10.9.4 Business Strategy
10.9.4.1 Scorecard
10.9.5 Developments
10.10 Lanxess AG
10.10.1 Business Overview
10.10.2 Lanxess AG: Company Snapshot
10.10.3 Products Offered
10.10.3.1 Scorecard
10.10.4 Business Strategy
10.10.4.1 Scorecard
10.10.5 Developments
11 Appendix (Page No. - 164)
11.1 Insights From Industry Experts
11.2 Discussion Guide
11.3 Introducing RT: Real-Time Market Intelligence
11.4 Related Reports
List of Tables (76 Tables)
Table 1 Performance Additives Market Size, By Type, 2014�2021 (USD Million)
Table 2 Performance Additives Market Size, By Type, 2014�2021 (Kilotons)
Table 3 Performance Additives Market Size, By End-Use Industry, 2014�2021 (USD Million)
Table 4 Performance Additives Market Size, By End-Use Industry, 2014�2021 (Kilotons)
Table 5 Performance Additives Market, By Region, 2014�2021 (USD Million)
Table 6 Performance Additives Market, By Region, 2014�2021 (Kilotons)
Table 7 North America: Performance Additives Market Size, By Country, 2014�2021 (USD Million)
Table 8 North America: Performance Additives Market Size, By Country, 2014�2021 (Kiloton)
Table 9 North America: Performance Additives Market Size, By End-Use Industry, 2014�2021 (USD Million)
Table 10 North America: Performance Additives Market Size, By End-Use Industry, 2014�2021 (Kiloton)
Table 11 The U.S.: Performance Additives Market Size, By End-Use Industry, 2014�2021 (USD Million)
Table 12 The U.S.: Performance Additives Market Size, By End-Use Industry, 2014�2021 (Kiloton)
Table 13 Canada: Performance Additives Market Size, By End-Use Industry, 2014�2021 (USD Million)
Table 14 Canada: Performance Additives Market Size, By End-Use Industry, 2014�2021 (Kiloton)
Table 15 Mexico: Performance Additives Market Size, By End-Use Industry, 2014�2021 (USD Million)
Table 16 Mexico: Performance Additives Market Size, By End-Use Industry, 2014�2021 (Kiloton)
Table 17 Europe: Performance Additives Market Size, By Country, 2014�2021 (USD Million)
Table 18 Europe: Performance Additives Market Size, By Country, 2014�2021 (Kiloton)
Table 19 Europe: Performance Additives Market Size, By End-Use Industry, 2014�2021 (USD Million)
Table 20 Europe: Performance Additives Market Size, By End-Use Industry, 2014�2021 (Kiloton)
Table 21 Germany: Performance Additives Market Size, By End-Use Industry, 2014�2021 (USD Million)
Table 22 Germany: Performance Additives Market Size, By End-Use Industry, 2014�2021 (Kiloton)
Table 23 France: Performance Additives Market Size, By End-Use Industry, 2014�2021 (USD Million)
Table 24 France: Performance Additives Market Size, By End-Use Industry, 2014�2021 (Kiloton)
Table 25 Italy: Performance Additives Market Size, By End-Use Industry, 2014�2021 (USD Million)
Table 26 Italy: Performance Additives Market Size, By End-Use Industry, 2014�2021 (Kiloton)
Table 27 U.K.: Performance Additives Market Size, By End-Use Industry, 2014�2021 (USD Million)
Table 28 U.K.: Performance Additives Market Size, By End-Use Industry, 2014�2021 (Kiloton)
Table 29 Spain: Performance Additives Market Size, By End-Use Industry, 2014�2026 (USD Million)
Table 30 Spain: Performance Additives Market Size, By End-Use Industry, 2014�2026 (Kiloton)
Table 31 Russia: Performance Additives Market Size, By End-Use Industry, 2014�2021 (USD Million)
Table 32 Russia: Performance Additives Market Size, By End-Use Industry, 2014�2021 (Kiloton)
Table 33 Rest of Europe: Performance Additives Market Size, By End-Use Industry, 2014�2021 (USD Million)
Table 34 Rest of Europe: Performance Additives Market Size, By End-Use Industry, 2014�2021 (Kiloton)
Table 35 Asia-Pacific: Performance Additives Market Size, By Country, 2014�2021 (USD Million)
Table 36 Asia-Pacific: Performance Additives Market Size, By Country, 2014�2021 (Kiloton)
Table 37 Asia-Pacific: Performance Additives Market Size, By End-Use Industry, 2014�2021 (USD Million)
Table 38 Asia-Pacific: Performance Additives Market Size, By End-Use Industry, 2014�2021 (Kiloton)
Table 39 China: Performance Additives Market Size, By End-Use Industry, 2014�2021 (USD Million)
Table 40 China: Performance Additives Market Size, By End-Use Industry, 2014�2021 (Kiloton)
Table 41 India: Performance Additives Market Size, By End-Use Industry, 2014�2021 (USD Million)
Table 42 India: Performance Additives Market Size, By End-Use Industry, 2014�2021 (Kiloton)
Table 43 Japan: Performance Additives Market Size, By End-Use Industry, 2014�2021 (USD Million)
Table 44 Japan: Performance Additives Market Size, By End-Use Industry, 2014�2021 (Kiloton)
Table 45 South Korea: Performance Additives Market Size, By End-Use Industry, 2014�2021 (USD Million)
Table 46 South Korea: Performance Additives Market Size, By End-Use Industry, 2014�2021 (Kiloton)
Table 47 Thailand: Performance Additives Market Size, By End-Use Industry, 2014�2021 (USD Million)
Table 48 Thailand: Performance Additives Market Size, By End-Use Industry, 2014�2021 (Kiloton)
Table 49 Indonesia: Performance Additives Market Size, By End-Use Industry, 2014�2021 (USD Million)
Table 50 Indonesia: Performance Additives Market Size, By End-Use Industry, 2014�2021 (Kiloton)
Table 51 Malaysia: Performance Additives Market Size, By End-Use Industry, 2014�2021 (USD Million)
Table 52 Malaysia: Performance Additives Market Size, By End-Use Industry, 2014�2021 (Kiloton)
Table 53 Rest of Asia-Pacific: Performance Additives Market Size, By End-Use Industry, 2014�2021 (USD Million)
Table 54 Rest of Asia-Pacific: Performance Additives Market Size, By End-Use Industry, 2014�2021 (Kiloton)
Table 55 Middle East & Africa: Performance Additives Market Size, By Country, 2014�2021 (USD Million)
Table 56 Middle East & Africa: Performance Additives Market Size, By Country, 2014�2021 (Kiloton)
Table 57 Middle East & Africa: Performance Additives Market Size, By End-Use Industry, 2014�2021 (USD Million)
Table 58 Middle East & Africa: Performance Additives Market Size, By End-Use Industry, 2014�2021 (Kiloton)
Table 59 Saudi Arabia: Performance Additives Market Size, By End-Use Industry, 2014�2021 (USD Million)
Table 60 Saudi Arabia: Performance Additives Market Size, By End-Use Industry, 2014�2021 (Kiloton)
Table 61 South Africa: Performance Additives Market Size, By End-Use Industry, 2014�2021 (USD Million)
Table 62 South Africa: Performance Additives Market Size, By End-Use Industry, 2014�2021 (Kiloton)
Table 63 Iran: Performance Additives Market Size, By End-Use Industry, 2014�2021 (USD Million)
Table 64 Iran: Performance Additives Market Size, By End-Use Industry, 2014�2021 (Kiloton)
Table 65 Rest of Middle East & Africa: Performance Additives Market Size, By End-Use Industry, 2014�2021 (USD Million)
Table 66 Rest of Middle East & Africa: Performance Additives Market Size, By End-Use Industry, 2014�2021 (Kiloton)
Table 67 South America: Performance Additives Market Size, By Country, 2014�2021 (USD Million)
Table 68 South America: Performance Additives Market Size, By Country, 2014�2021 (Kiloton)
Table 69 South America: Performance Additives Market Size, By End-Use Industry, 2014�2021 (USD Million)
Table 70 South America: Performance Additives Market Size, By End-Use Industry, 2014�2021 (Kiloton)
Table 71 Brazil: Performance Additives Market Size, By End-Use Industry, 2014�2021 (USD Million)
Table 72 Brazil: Performance Additives Market Size, By End-Use Industry, 2014�2021 (Kiloton)
Table 73 Argentina: Performance Additives Market Size, By End-Use Industry, 2014�2021 (USD Million)
Table 74 Argentina: Performance Additives Market Size, By End-Use Industry, 2014�2021 (Kiloton)
Table 75 The Rest of South America: Performance Additives Market Size, By End-Use Industry, 2014�2021 (USD Million)
Table 76 The Rest of South America: Performance Additives Market Size, By End-Use Industry, 2014�2021 (Kiloton)
List of Figures (26 Figures)
Figure 1 Market Segmentation
Figure 2 Performance Additives Market: Research Methodology
Figure 3 Market Size Estimation: Bottom-Up Approach
Figure 4 Market Size Estimation: Top-Down Approach
Figure 5 Performance Additives: Data Triangulation
Figure 6 Packaging End-Use Industry to Dominate the Performance Additives Market Between 2016 & 2021
Figure 7 Plastic Additives Dominates the Perfomance Additives Market
Figure 8 The Market in Asia-Pacific is to Register the Highest CAGR in the Market Between 2016 and 2021
Figure 9 The Market in the U.S. to Dominate the Global Performance Additives Market Till 2021
Figure 10 Asia-Pacific Dominated the Global Performance Additives Market, 2015
Figure 11 Performance Additives Market to Witness Rapid Growth Between 2016 and 2021
Figure 12 Paint & Coatings Additives to Register the Highest CAGR During the Forecast Period
Figure 13 China Accounted for the Largest Market Share in 2015
Figure 14 Asia-Pacific to Be the Fastest-Growing Performance Additives Market Between 2016 and 2021
Figure 15 Packaging Segment Accounted for the Largest Market Share in 2015
Figure 16 Performance Additives: Market Dynamics
Figure 17 Porter�s Five Forces Analysis: Performance Additives Market
Figure 18 Performance Additives Market in Packaging Segment to Grow Rapidly Between 2016 and 2021
Figure 19 India, China, and Japan are Emerging as the New Hotspots in the Global Performance Additives Market, 2016�2021
Figure 20 The Market in the U.S. Was the Key Performance Additives Market in North America, 2015
Figure 21 The U.S. to Remain the Leading Player in the Performance Additives Market in North America, 2016�2021
Figure 22 Performance Additives Market: Regional Snapshot (2015)
Figure 23 Asia-Pacific is the Fastest-Growing Market for Performance Additives
Figure 24 China to Remain the Leading Performance Additives Market in Asia-Pacific, 2016�2021
Figure 25 The Market in Brazil is the Largest Performance Additives Market in South America
Figure 26 Dive Chart


Growth opportunities and latent adjacency in Performance Additives Market